In today’s WSJ, Justin Lahart notes “China Wind Chills U.S. Earnings”, and presents an interesting graph of import prices, which inspired me to look more closely at the issue.
In Figure 1, I reproduce the graph, with a slightly longer time span, augmented with the Chinese producer price index.
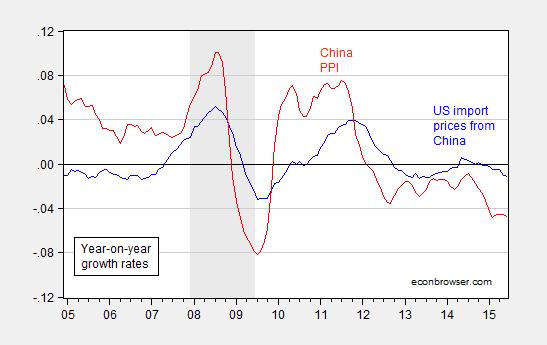
Figure 1: Year-on-year percent change (in decimal form), in prices of Chinese goods imports into the US (blue), and in Chinese producer price index (red). Source: BLS, tradingeconomics.com, and author’s calculations.
My first observation is that it’s kind of surprising that import prices haven’t been declining for a longer period. Year-on-year Chinese PPI inflation has been negative since early 2012. The second observation is this means one has to be a little careful about inferring a contracting economy from price trends, given the PPI has been declining even during periods when the economy was widely viewed as growing).
Of course, one critical factor is omitted from the graph — namely the exchange rate. Recall the identity (in logs) that the import price equals the export price converted by the exchange rate:
p$Import = s$/¥ + p¥Export
Where p$Import is the log dollar price of imported goods from China, s$/¥ is the log exchange rate, in number of USD per CNY, and p¥Export is the log CNY price of Chinese exports to the US.
Taking the first difference:
Δp$Import = Δs$/¥ + Δ p¥Export
That means the growth rate of dollar import prices equals the depreciation rate of the dollar against the yuan plus the yuan price of exports.
Since this is an identity, it doesn’t speak to the actual correlations observed in reality, since the yuan price of exports is likely to respond to exchange rate changes (i.e., p¥Export is not exogenous). (In Figure 1, I’m using the PPI as a proxy for the exogenous component of export prices.)
The exchange rate depreciation shown in Figure 2:

Figure 2: Year-on-year percent change (in decimal form), in prices of Chinese goods imports into the US (blue), and in dollar/yuan exchange rate (violet). Source: BLS, Federal Reserve Board, and author’s calculations.
These plots sidestep the issue of dynamics. What’s true is that the dollar has appreciated against the yuan by about 2.5% since 2014M01, while import prices fell by 0.8%. I suspect what happens to import prices will probably depend a lot more on the bilateral exchange rate than production costs in China. (Which is not to say the state of the economy generally won’t affect the government’s setting of the exchange rate.)
My back of the envelope estimates suggest that over the 2005-2015 period, exchange rate pass through is about 0.45, not far off from my 2011 estimate of 0.52 (pass through of PPI into import prices is only about 0.20). This is below estimates based on disaggregated sectoral data and the 2005 RMB regime reform (e.g., Auer, 2011) (see also Kim, Nam, Wang and Wu (2015) for a more recent period).
Note that the exchange rate pass through coefficient will vary depending on a variety of factors, including competition from domestic firms in the US, market share, and the imported component of Chinese exports (see e.g., CBO).