So said Republican Presidential candidate Donald Trump. Pay no heed to the massive wildfires. And temperature readings.
Here is a map of current fires in the US (see here for Canada):
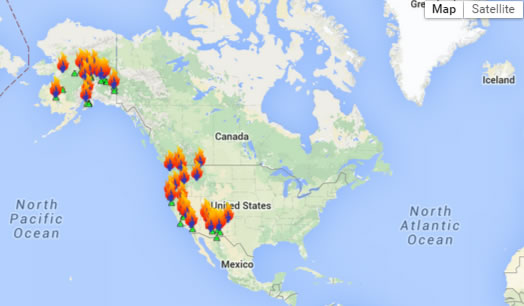
Source: NOAA.
July was the hottest on record (w/o reference to statistical significance).
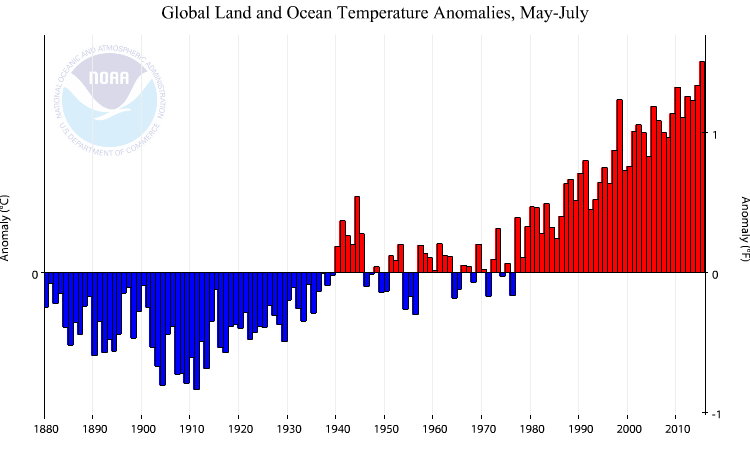
Figure 1: May-July global surface temperature anomalies. Source: NOAA.
From NY Times:
Global warming caused by human emissions has most likely intensified the drought in California by 15 to 20 percent, scientists said on Thursday, warning that future dry spells in the state are almost certain to be worse than this one as the world continues to heat up.
…
“This would be a drought no matter what,” said A. Park Williams, a climate scientist at the Lamont-Doherty Earth Observatory of Columbia University and the lead author of a paper published by the journal Geophysical Research Letters. “It would be a fairly bad drought no matter what. But it’s definitely made worse by global warming.”
Update, 8/22, 11am Pacific: See also this NY Times article, reported from Walla Walla, near my hometown in Eastern Washington.
Update, noon Pacific: On reading this document, it occurs to me that Donald Trump’s current worldview (who knows what it will be tomorrow) is a perfect representation of a perspective held by a certain group of Americans. This is illustrated in this Venn diagram:
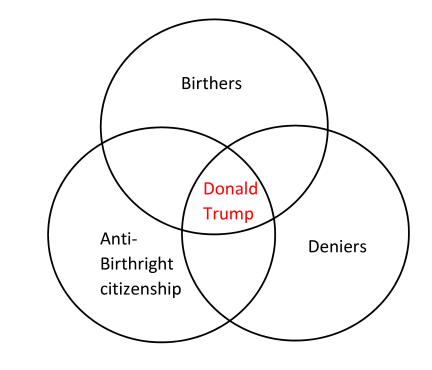
In this sense, he is a perfect distillation of a segment of one American political party.
Update, 8/28 8pm Pacific: And here is Donald Trump on negotiating with Japan and China.
As climate change guru and former Democratic Presidential Candidate Al Gore told Conan O’Brien, the temperature is several million degrees 2 kilometers or so below the surface of the earth. Given that scientific fact, I guess I’m surprised that there aren’t a lot more fires. I wonder why the drought isn’t spreading outside of California?
Rick Stryker: I’m sorry, did I cite VP Gore in this post, thread, or any post?
And is your comment meant to dispute either (1) hottest July, or (2) relationship between global climate change and drought intensity?
No you didn’t mention Al Gore, but you did refer to the Donald, making sure to describe the former Democrat as a Republican, in order to imply Republicans don’t understand science. So in the interests of balance, I thought it would be well to remember that it’s very easy to find cases on the Democratic side.
Al Gore won a Nobel Prize for his work on climate change. He almost won the Presidency. He’s an expert that progressives look to for climate policy wisdom. The progressive journalists at Newsweek even gushed that Gore is The Thinking Man’s Thinking Man And yet the former VP thinks geothermal energy is the answer to climate change because it’s several million degrees 2 kilometers below the earth.
Rick Stryker: I missed the memo. Is Al Gore running for President right now?
Menzie,
Whether the former VP is running now is not clear as trial balloons seem to be coming from his camp, which is not surprising as the email scandal intensifies with media analyses that some emails were born classified.
I’d say bringing up the former VP is fair because his chance of being the Democratic nominee is greater than the Donald’s chance of being the Republican nominee.
rick, i am impressed. you can come up with amazing excuses to justify your partisan viewpoints!
What do you mean “almost”?
Almost means that Gore came close but Bush actually won.
Rick: you unknowingly provided the perfect example of non sequitur
Robert,
What’s the non sequitur?
Drought is spreading outside California: see
http://droughtmonitor.unl.edu/
Teslamotors is building a battery gigafactory outside of Reno, Nevada — within the severest drought area. Apparently, tax breaks are more important than water for making batteries.
Drought is spreading outside California. See
http://droughtmonitor.unl.edu/Home/StateDroughtMonitor.aspx?NV
Teslamotors is building their battery gigafactory near Reno Nevada — smack in the middle of an extreme drought area, demonstrating that tax breaks are more important than water!
Rick you’re a moron. You post a video from 6 years ago from someone who is NOT a scientist and you think this proves what exactly?
Tony,
Yes, I suppose that was a bit unfair of me. Only a highly-trained scientist would know that the earth can’t be millions of degrees 2 kilometers down.
Menzie, from the NYT article we see this: “The immediate reason for the drought is clear enough: For more t”han three years, a persistent ridge of high pressure in the western Pacific Ocean has blocked storms from reaching California in the winter, when the state typically gets most of its moisture. That pattern closely resembles past California droughts.” It actually has been given a name, The Ridiculously Resilient Ridge. This early 2015 article explains what is known about it. http://www.weatherwest.com/archives/2947
” This overall setup–with a big Western ridge and a deep Eastern trough–has become known as the “Warm West/Cool East” dipole pattern, and it has been a common feature of recent winters in North America. There are a number of hypotheses currently being investigated regarding the causes of an apparent recent increase in the occurrence of this pattern, though there’s not yet compelling evidence pointing to a singular cause (that’s a topic for a future blog post!).
If you are a carpenter you will think everything is fixed by a hammer. If you are a climatologist you think everything is fixed by changing climate. Of course if you are an economist you are probably ….
While we are considering CA drought as extreme and caused by Global Warming, show us on this graphic how it works
https://wattsupwiththat.files.wordpress.com/2014/08/california_drought_timeline.png?w=720&h=278
That was supposed to be the North Eastern Pacific.
CoRev: The scientist says the likelihood and severity of severe drought is higher. We live in a stochastic world.
Menzie. is that the best you have? Why the drought is present is answered. Why the 3R exists is unknown. Projection is not science!
We live in a multivariate world. Give me more than “a scientist said something”. Give me regressions and analysis of confounding variables (e.g. land use, fire policies).
1. You are talking a single bad season. It’s as silly as a denier talking about a cold winter disproving global warming. STA-TIS-TICS.
2. The relation of fire seasons to global warming is pretty tenuous. Like the hurricane hubbub (that hasn’t panned out). Lead from strength (like the trend of temp itself or icecaps or glaciers) not some emotive soundbite-y thing like forest fires.
P.s. I hope your economic regressions are more thoughtful and really…more curious. Not trying to prove some lefty point but to impartially sift relations and see what is born out and what not (and report it all, including the failed significance tests.)
Nony: I think one of the coauthors (James Stock) of the paper discussed in this post knows a little about econometrics. If you disagree, I would like to know your reasons for disputing his credentials. Please be specific.
Two points about statistical significance.
1. On (stochastic) trends, see addendum to this this post.
2. Test for difference in means (hottest vs. second hottest July) yields z-score of 1.4, which rejects no difference at 10% using 1-sided test.
Did you miss the part of my post where I said, lead from strength like the temperature trend?
Did you miss where I dissed you for emphasizing a single season and FOREST FIRES (not temp)?
Why do you try to shift to a general argument on AGW? I actually think there’s a decent backing for AGW based on the temp rise. I’m talking about this post. And all my points remain.
Nony: If memory serves, we’ve had several very bad fire seasons in a row.
Menzie, you memory is incorrect. From here we have annual totals: http://www.nifc.gov/fireInfo/fireInfo_statistics.html
Wildland Fires ————-Wild ————–Prescribed
————————–# fires–# Acres –# Fires- # Acres
2014 Grand Totals 63,612 3,595,613 17,044 2,389,798
2013 Grand Totals 47,579 4,319,546 18,764 2,000,040
2012 Grand Totals 67,774 9,326,238 16,626 1,971,834
2011 Grand Totals 74,126 8,711,367 8,672 2,112,811
2010 Grand Totals 71,971 3,422,724 16,882 2,423,862
2009 Grand Totals 78,792 5,921,786 12,429 2,531,133
2008 Grand Totals 78,949 5,292,468 7,669 1,935,001 264 236,834
2007 Grand Totals 85,705 9,328,045 24,073 3,149,067 346 430,529
2006 Grand Totals 96,385 9,873,745 24,429 2,720,545 359 165,056
2005 Grand Totals 66,753 8,689,389 7,756 2,310,346 437 489,186
There is a trend but it is opposite of what you remember. Remember 2005 and 2010 were el Nino years with conditions similar to what we are seeing today.
–
CoRev: Thanks for the data link. I have posted an analysis of the data (using a longer time span).
There is no coherent theory that explains why the tropsophere is warming and the stratosphere is cooling except for one; the one that in fact predicted it. I.e., the GHG theory of global warming. Similarly, only one coherent theory explains why we escaped several different ice ages. While orbital cycles can explain why we would cool, they don’t offer enough energy to melt the ice created during glaciations. Scientists were basically stumped at how we ever emerged – until they realized massive amounts of CO2 would eventuallly be released. The arctic is increasing in temperature faster than the rest of the planet. Another simple prediction from the GHG theory.
Do climate scientists have all the answers? Of course not, but the basic science has been known for over a hundred years. What Fourier, Arrhenius and Callendar were able to figure out without the aid of computers regarding GHGs in general and CO2 specifically is not secret hidden knowledge. Those that deny the GHG theory and by extension AGW simply are deniers. They *choose* to be ignorant. The parallels between climate change deniers and those of a libertarian economic flavor is pretty striking.
Yes we currently have some excellent models that explains almost all of the observed temperature observations. At this time the residuals are very small and of no real consequence. Here is a link to a brilliant graphic of the multivariate model and how close it explains the observed data:
http://www.bloomberg.com/graphics/2015-whats-warming-the-world/
But there was a worse drought 157,832 years ago (even though the Earth is only 6000 years old), so, clearly, anthropogenic CO2 emissions have nothing to do with the current drought.
Plus, the sun is causing the warming.
And cosmic rays.
And rebound from the last ice age.
And there is no warming, anyway.
We call you denialists, instead of skeptics, because the case you make for your position is incoherent.
Nony: “You are talking a single bad season. It’s as silly as a denier talking about a cold winter disproving global warming. STA-TIS-TICS.
It’s not just a single season. It is a steadily rising trend over time. In the last three decades the average number of acres burned has more than doubled from 2.9 million acres to 6.8 million acres per year. This is despite rapidly increasing expenditures and technology improvements for fire suppression. Those are the statistics.
http://nationalaglawcenter.org/wp-content/uploads/assets/crs/R43077.pdf
Dr. Chinn, are you trying to argue that a warming climate will reduce precipitation? Because the EPA, at least, seems to disagree, as does the data:
http://www.epa.gov/climatechange/science/indicators/weather-climate/precipitation.html
Or are you saying that the EPA is wrong, or a “climate denier” or something like that?
Look at the actual link you are providing it has a map. The concept of climate change has always included that temperatures, precipitation and other parameters will have local ups and downs. So even as higher temperatures increase evaporation (and precipitation) there will be local drought because precipitation patterns will change.
What do wildfires and a warmer planet have to do with each other? Yes, the bigger wildfires are manmade but not related to global warming.
The reason for the more and more powerful wildfires in the Western USA is that you fight the fires. Without any human intervention trees would die and become kindle on the forest bottom. Along comes a lighting strike and voila a large swab of forest burns down and fertilize the ground with ashes and the forest will return.
By stopping this natural process you have accumulated more and more dead wood on the forest floor plus more trees survive to an older age thereby making the fires much worse. In short more firewood available means bigger fires.
Just look at these pictures from Montana dated from left to right anno 1909, 1948 & 1989
https://en.wikipedia.org/wiki/File:Forest_Development_in_Bitterroot.jpg
See the increase in burnable wood. A wildfire in 1909 would be much milder than in 1989.
Return to a natural circle of wildfires and the size will decrease when the present excess of wood have been removed.
Of course the world is warming, just as the world is on the way to ten billion people and the Indians – on their own merry way to overtake China in headcount – have announced plans to increase their use of coal. And large animals are being killed in Africa. And mega-cities are hell on earth. And so on – humans are the ultimate pollution and source of warming.
The issue is what – if anything – can be done about this.
Pious, job destroying – or bird killing – gestures in the US don’t seem obviously useful in global terms, though pleasing to our eco-freaks, liberals and progressives. Good snivel topic.
Why not think about reducing the human footprint through birth control? This is something the US COULD lead in. Pay single women on welfare to quit after one child, for example. Who but the prison officers’ union could object to this?
Menzie et al who blindly believe in the GW/AGW hypothesis, can you give us brief list of the correct irrefutable predictions made by climate science? While building that list build a second category of positive associated with global warming.
To be perfectly clear there is almost no one who does not believe in AGW. Nearly all arguments are centered upon the predictions and their cause. Y’ano just like this article. Arguments that are supported by explanations like “we live in a stochastic world”, which say absolutely nothing more than could be true (or not). And that’s the foundation upon which this blind belief rests?
Wild fires, drought, rain, snow, hurricanes, tornadoes all “linked” to AGW. None of which, are historic by any measure
Dave, back up the assertions.
The only solution to global warming is destroying the global economy which would have the side effect of killing millions of poor people.
Time to change the name of this site to The Daily Menz.
Or change it to Guardians of the Hypothesis.
W.C. Varones: Still waiting to hear how your prediction of dollar debasement is completely consistent with the surge in the value of the dollar. Just wonderin’.
Please post more predictions. I need more laughs, living in post-2010 Wisconsin.
Menzie,
I realize intellectual honesty isn’t your strong suit, but you omitted a key word: “eventual.”
If you have reason to believe the Fed won’t continue debasing the dollar over the next 10, 20, or hundred years the same way it has the last 100 years, I’d love to hear it.
And if you have examples of countries growing their way out of debt/GDP levels similar to today’s without default or inflation, I would love to see them.
Professor Chinn,
With due respect, you and Professor Hamilton own this blog so will discuss what you want to discuss. Regarding global warming, due to political or religious reasons humans may eliminate themselves with nuclear weapons prior to catastrophic global warming, which would make the current global warming argument moot. I for one would like your continued expert discussion and opinion of USA and world GDP. Are we heading for deflation, and is $100 barrel oil gone “forever”? What does your econometric crystal ball see related to what seem to be serious economic risks? Respectfully, in addition to replacing Governor Walker, what are your national and international economic concerns? What do we need to tell our political leaders? What economic issues keep you awake at night?
Thanks for considering
AS: Thanks for your comments. A post on China is coming; for now I have nothing to add to my previous comments, so I’d be repeating myself — so for current tracking of macro indicators, see here. I’ll also have a post on “To log or not to log, part IV”. It’ll involve the stock market.
Professor Chinn,
Thanks. Always look forward to your expert opinions and posts. It seems that a few months ago some posters felt that China and India were about to use the entire world supply of petroleum. Now I read that supply continues greater than demand mainly due to decreased demand. The Fed. seemed poised to raise rates in September. Now one reads that rates may not be raised before the beginning of the year, due to what seems to be a world GDP slowdown. And some writers point to the possibility (again) of deflation. The stochastic world seems to be in full demonstration.
On a much more serious note, Conde Nast named Princeton as the ‘best college town for people not in college’.
http://www.cntraveler.com/galleries/2014-10-07/best-college-towns-for-people-who-aren-t-in-college/1
As readers will know, I live in Princeton and am not in college, and therefore thoroughly endorse this view.
I would add that Conde Nast also named Detroit “the best city for people not making cars.”
I cannot over-emphasize how much I like debating wild fires. But I don’t know if any of you noticed that the stock market lost 500 points yesterday and investors are now pricing in a full blown recession in Asia. I know, I know, it’s all unrelated to climate change. And yet, perhaps it might be worth discussing.
Steven, points well made!
Steven Kopits: One thing I appreciate about being a blogger is I can pick and choose, and sometimes I have nothing to add beyond what is on Reuters and Bloomberg. We all knew a correction was likely sometime, we just weren’t sure what the trigger would be. And we knew there’d be little good news out of China for a while (the Chinese devaluation, on the other hand, did surprise me in timing, but not in terms of action. But I thought I could add something in terms of quantification, so I posted on it).
Now I’ll just point out a parochial reason for concern. One of the centers of the wildfires is Eastern Washington (where the three firefighters died). One big NYT article centers on Walla Wall, close to where I grew up. So excuse me if I find it of some interest; when your hometown comes close to burning down, then I’ll give you leeway too.
I certainly wish the best for your hometown.
On the other hand, if my hometown were in danger of burning down, I doubt I would include a Venn diagram about Donald Trump in the same post.
Steven Kopits: “I cannot over-emphasize how much I like debating wild fires. But I don’t know if any of you noticed that the stock market lost 500 points yesterday and investors are now pricing in a full blown recession in Asia. I know, I know, it’s all unrelated to climate change. And yet, perhaps it might be worth discussing.”
Three firefighters lost their lives yesterday fighting those fires. Hundreds have lost their homes. I doubt they are worrying too much about the stock market.
Are you incapable of holding more than one thought in your head at one time or is your bandwidth limited to just oil? Sorry if you find other life and death topics too distracting and of little consequence. You must be great fun at cocktail parties. “I’m tired of talking about this. Let’s talk about what I’m want to talk about.”
Let me explain why this claim is probably bogus, and several issue with the NOAA temperature graph. 1) The baseline for the graph is the average for the entire dataset. It is virtually impossible to not have warming when 54% of the years are cooler than the average as we came out of the Little Ice Age. So the question is the warming rate more in the past 3 decades than that of the warming from the LIA, before the start of modern record keeping? No body knows from this data.
2) Using this baseline also seriously perturbs the data. The decade of the 1930s, arguably one of the warmest decades in the temperature records, shows as cooler than the average.
3) The scale on the right side of the graphic, where the eye is drawn because of the height and color, we have degrees Fahrenheit. an infrequently used scale in the science. Looking on the left where the scale is in degrees centigrade, more commonly used in the science, the overall warmth is less than a single degree.
I oiften describe many of the claims from climate science as exaggerated. This NOAA graphic is one of many examples of how even the basic measurements are exaggerated. Worse, we are supposed to be concerned over this minimal and beneficial warming, a difference we could not even feel.
As a finale to this point I ask can any of the Guardians of the Hypothesis provide a quick list of the successful predictions of this science?
Data shown is inconsistent with satellite measurements: https://bobtisdale.files.wordpress.com/2015/08/05-rss-tlt.png
“The July 2015 RSS lower troposphere temperature anomaly is +0.29 deg C. It dropped (a decrease of about +0.10 deg C) since June 2015.”
Ground station temperatures have been adjusted and re-adjusted upward for recent history and downward and again downward for early in the data series. This is inconsistent with the phenomenon known as the urban heat island effect which has been expanding as metropolitan areas now encompass what was once farmland and weather stations positioned on that farmland. The temperatures shown have been adjusted… in precisely the opposite way to which they were to account for the UHI expansion.
For example, the Madison, WI weather station is located here: https://www.google.com/maps/place/Dane+County+Regional+Airport/@43.1390659,-89.3364128,15z/data=!4m2!3m1!1s0x0:0x91cbeef1128b04e6
“In 1927, the City of Madison purchased 290 acres of land for $35,380. Previously a cabbage patch for a nearby sauerkraut factory, the newly acquired land would later become the present day home of the Dane County Regional Airport.” http://www.msnairport.com/about/facilities/history.aspx
I’ll bet that airport with all that concrete and all of the airplanes is a better heat sink than a cabbage patch. Just Google “temperatures lower in outlying areas”.
Rick Stryker: “As climate change guru and former Democratic Presidential Candidate Al Gore told Conan O’Brien, the temperature is several million degrees 2 kilometers or so below the surface of the earth.”
I seem to recall this howler courtesy of yourself and Steven Kopits. “So it costs us $140 bn per year to insure an incremental 3 million people. Only $35,000 per head. What a bargain!” Due to your own shortcomings for basic multiplication and division, (both the $140 billion and the 3 million numbers were the result of basic math errors) you managed to come up with a number that was off by more than an order of magnitude (not to mention that even the conclusion contains yet another arithmetic error). Not just on live TV, but sitting in front of your computer you couldn’t seem to come up with a number that passes the smell test.
Perhaps you and Al Gore have more in common that you might realize.
If you don’t think the climate is warming, then you’ll have to come up with some other theory to explain why plant zones have drifted north to the point where seed catalogs from the 1970s are about a full zone from where they are today. And you’ll have to explain why hibernation patterns have changed for wild animals. And you’ll have to explain rising sea levels…and when you explain those rising sea levels don’t forget your middle school solid geometry.
AS There’s actually a fair amount of literature on the economics of global warming. The predicted costs are all over the place, but that is due to parameter uncertainty rather than random variation. CoRev is right in one respect; there are a lot of unknowns when it comes to climate change. What CoRev does not understand is that there’s a very big difference between fat tailed distributions and thin tailed distributions. Many models that come in with relatively damage costs tend to rely upon thin tailed distributions, such as the normal. But models that assume fat tailed distributions predict much higher costs and higher temperatures. In risk analysis it is common to assume a fat tailed distribution when there is Knightian uncertainty about the first moment parameters. Also, it makes a big difference whether you want to make your predictions based on the most likely outcome or outcomes at the tail probabilities. If you’re confident about the parameter estimates, then you’d probably want to focus on expected or most likely outcomes. But if you’re radically uncertain about the parameters, then most risk analysts would concentrate on the tail probabilities. What’s strange is that CoRev (sometimes) admits that there’s a lot of uncertainty about climate change, but yet he takes away the lesson that we shouldn’t do anything until we know for certain. CoRev would be a very bad risk analyst.
2Slugs,
Although the climate seems to be getting hotter, I have no cogent argument regarding global warming. All I was saying is that with the state of world affairs, I wonder if there may be a nuclear event in the next 100 years that may alter the whole argument and weather environment. I appreciate your comments concerning the uncertainty and always appreciate summary estimates of risks and costs. It gets very difficult to sort-out the data in favor of information.
2slugs, we’ve had this discussion too many times to belabor the details. Which current wiggle in the sea level rise is important? This is a common graph that even Wiki uses: https://upload.wikimedia.org/wikipedia/commons/thumb/1/1d/Post-Glacial_Sea_Level.png/250px-Post-Glacial_Sea_Level.png
Temperatures have increased since the last revision of the agriculture zone maps., and that applies to hibernation.
What’s going on now? http://woodfortrees.org/plot/rss/plot/rss/from:1996.9/trend/plot/rss/from:2001/trend We find a pause since 1996.9 and a cooling trend since 2001. Before you make snarky comment about this tool, make your own. And for the actual long term cycle we have this: http://www.climate4you.com/images/GISP2%20TemperatureSince10700%20BP%20with%20CO2%20from%20EPICA%20DomeC.gif
Since you are concerned about risk of warming, please provide the list of actual historical events that can be irrefutably assigned to climate change. If you want I will define those from cooling, of which we have good historical references.
CoRev You forgot my admonition to remember your middle school solid geometry. The graph that you posted shows that sea levels are increasing gradually, which means that the VOLUME of sea water is increasing at an increasing rate.
2slugs, and you forgot your basic math. Tell us again how long it will take to reach a foot a meter? The sea level graphs shows a little up a little down, basically a sideways pattern. That is of course until the next Ice Age (little or not) and/or the drift into the next glaciation. Why is it there so little interest in the effects of a cooling climate? There is adequate history of how it impacts humankind and nature. It is also the almost inevitable outcome in the long term.
BTW, there is a new study out which shows the GMSL rise is closer to 1.65MM/Yr (1.33 to 1.98MM). So climate facts are always in question. Change rates always in question. But, not in question is the need for alarmists to embrace the worst of those predictions. Why? Without it there is no cause for concern.
CoRev You’re missing the point. The fact that the volume of sea water is increasing at an increasing rate means that the water is getting warmer and that icebergs are melting. I have no idea how many meters sea levels will rise. I do know that there are countries with dense populations very close to sea level, and even a modest rise in sea levels would be bad news. But what we do know without a shadow of doubt is that the volume of sea water is increasing, and that is entirely consistent with global warming and runs contrary to your nonsense about a supposed “pause.”
2slugs, its simple math. The rate is some where between 1 to 3mm/Yr, until we reach the next ice age. Strangely you do not want to discuss the numbers of them we have experienced in just this inter-glacial. Nor do you and to talk about the likelihood of having one soon or even worse being due or even overdue for the next glaciation.
If we can not explain what caused the planet to enter or exit from ice ages or the glaciations then we can not explain the major cyclical components of climate. At this time we can not, but we are really, really good at wiggle watching the trends while ignoring the overall temperature trend. http://farm5.staticflickr.com/4111/4994030265_2de8169af7_z.jpg or is simplified version for easier visibility http://jonova.s3.amazonaws.com/graphs/lappi/gisp-last-10000-new.png
CoRev writes: “… I ask can any of the Guardians of the Hypothesis provide a quick list of the successful predictions of this science?”
Well, I gave you several already upthread. Crickets on those. And of course you probably know how to use da Google- so asking others to do simple, basic, easily accessible research *for you* is really nothing more than a waste of pixels. If you were interested in the answers you would already have them. As I said upthread – those that deny the GHG theory *choose* to be ignorant.
But for those that maybe aren’t aware, here’s a listing of the why the GHG theory is accepted by any scientist worth hanging an advanced degree on:
(stolen shamelessly from Steve Easterbrook) and Spencer Weart.
1824: Fourier calculates that the Earth would be far colder if it lacked an atmosphere.”
1859: Tyndall discovers that some gases block infrared radiation. He suggests that changes in the concentration of the gases could bring climate change.”
“1896: Svante Arrhenius correctly predicts that increases in fossil fuel emissions would cause the earth to warm. At that time, much of the theory of how atmospheric heat transfer works was missing, but nevertheless, he got a lot of the process right. He was right that surface temperature is determined by the balance between incoming solar energy and outgoing infrared radiation, and that the balance that matters is the radiation budget at the top of the atmosphere. He knew that the absorption of infrared radiation was due to CO2 and water vapour, and he also knew that CO2 is a forcing while water vapour is a feedback.”
“1900: Frank Very worked out the radiation balance, and hence the temperature, of the moon. His results were confirmed by Pettit and Nicholson in 1930.”
“1902-14: Arthur Schuster and Karl Schwarzschild used a 2-layer radiative-convective model to explain the structure of the sun.”
“1907: Robert Emden realized that a similar radiative-convective model could be applied to planets, and Gerard Kuiper and others applied this to astronomical observations of planetary atmospheres. This work established the standard radiative-convective model of atmospheric heat transfer. This treats the atmosphere as two layers; in the lower layer, convection is the main heat transport, while in the upper layer, it is radiation. A planet’s outgoing radiation comes from this upper layer.”
“1938: Guy Callendar is the first to link observed rises in CO2 concentrations with observed rises in surface temperatures.”
“1956: Gilbert Plass correctly predicts a depletion of outgoing radiation in the 15 micron band, due to CO2 absorption. This depletion was eventually confirmed by satellite measurements.”
1957: Revelle and SuessShow that the oceans can absorb only 1/10 the amount of CO2 emitted by humans than what might be supposed by naive calculations.
“1959: Burt Bolin and Erik Eriksson correctly predict the exponential increase in CO2 concentrations in the atmosphere as a result of rising fossil fuel use. At that time they did not have good data for atmospheric concentrations prior to 1958, hence their hindcast back to 1900 was wrong, but despite this, their projection for changes forward to 2000 were remarkably good.”
“1961: J. Murray Mitchell, Jr. took up the question, with the help of improved data on how minuscule particles (aerosols) moved through the upper atmosphere. Studies of fallout from nuclear bomb tests had shown that fine dust injected into the stratosphere would linger for a few years, but would not cross from one hemisphere to the other. With that in mind, Mitchell pored over global temperature statistics and put them alongside the record of volcanic eruptions. In 1961, he announced that large eruptions caused a significant part of the irregular variations in average annual temperature in a given hemisphere.”
“1961-2: Carl Sagan correctly predicts very thick greenhouse gases in the atmosphere of Venus, as the only way to explain the very high observed temperatures. His calculations showed that greenhouse gasses must absorb around 99.5% of the outgoing surface radiation. The composition of Venus’s atmosphere was confirmed by NASA’s Venus probes in 1967-70.”
“1966: Emiliani’s analysis of deep-sea cores and Broecker’s analysis of ancient corals show that the timing of ice ages was set by small orbital shifts, suggesting that the climate system is sensitive to small changes.”
“1967: Suki Manabe and Dick Wetherald correctly predict that warming in the lower atmosphere would be accompanied by stratospheric cooling. They had built the first completely correct radiative-convective implementation of the standard model applied to Earth, and used it to calculate a +2 °C equilibrium warming for doubling CO2, including the water vapour feedback, assuming constant relative humidity. The stratospheric cooling was confirmed in 2011 by Gillett et al.”
“1975: Suki Manabe and Dick Wetherald correctly predict that the surface warming would be much greater in the polar regions”
“1989: Ron Stouffer et. al. correctly predict that the land surface will warm more than the ocean surface, and that the southern ocean warming would be temporarily suppressed due to the slower ocean heat uptake.”
This list is by no means presented as comprehensive. I just quoted material from the two resources listed above. Weart, in partuicular, has much more information available, but the basic idea has been know for almost two centuries. As our scientific knowledge has increased we have a *more* consistent and coherent theory. To overthrow the consensus theory of GHG warming one would need a fundamental revolution in one of the associated sciences – fluid dynamics, chemistry, radiative physics, chemistry, etc.
Kevin O’Neill, all I see is crickets for answers. A history of the scientists doesn’t come close answering the question. The science is represented by the GCMs. Provide that list of successful predictions. That should be easy with such a well understood science.
BTW, the GHE is not an issue nor is the AGW influence. What has been the center of the arguments has been how much of the warming can be assigned to human and natural factors.
You mean science is a process and sometimes one of the thousands of people engaged in that process make silly mistaken comments that later can be cherry picked out of the stack of millions of comments to discredit ….. them? , science?, something?
SHOCKING NEWS !?!?
CoRev provides a link to a woodfortrees plot. Of course he shows one satellite series for the lower troposphere. The LT temperatures are weighted from 0 to 12,500 meters. This what’s called a ‘cherry pick’ – the other satellite series (UAH) used to be the deniers’ orbiting platform of choice. But it becomes harder and harder for deniers to cherry pick. Here’s UAH plot of CoRev’s chosen dates http://woodfortrees.org/plot/uah/plot/uah/from:1996.9/trend/plot/uah/from:2001/trend
Of course the choice of using a satellite to measure surface temperature is itself a cherry pick. Satellites don’t even measure surface temperature, both RSS and UAH produce ‘lower tropospheric’ temperatures. These are products that weight the atmospheric temperatures from 0 to 12,500 meters. The weighting schemes can vary, but we’re looking at temperatures on average several thousand meters above the surface. Why? We have surface measurements, they go back far longer than satellites. They are much more accurate than satellites. Hint: cherry pick, denier, FUD.
So, when CoRev asks, “What’s going on now?” does he mention that by NOAA’s estimate we just witnessed the hottest month *ever* in terms of absolute temperature in the historical record. Of course not. Does he show actual temperature data measured at the surface? No, of course not. Does he mention that the data he provides is an outlier and disagrees with every other temperature set? No, of course not. Does he mention that his ‘trend’ is so sensitive to starting dates that you move it one way or the other and the ‘trend’ disappears? Of course not.
Now, he either doesn’t know these facts or he does and *chooses* to try and BS people. In the first case he just ignorant and deluded by whomever has shaped his scant knowledge – and should be pitied for that. In the second he’s actively working to mislead people from the truth. Perhaps I give him to much credit for intelligence, but I don’t think he’s stupid or ignorant. Which means I think he’s actively seeking to mislead. A typical denier with all the morals of a viper.
That last part may be unduly unkind to vipers and for that I apologize to all vipers everywhere.
Kevin O’Neil, your point about cherry picking is totally wrong! I will explain why. Kevin makes this point: “Here’s UAH plot of CoRev’s chosen dates…” and presumably he thinks it shows a magic difference. What Kevin doesn’t know is that the WFT data uses USH v5.6, and the latest UAH v6.0 is almost identical to TSS. The minor differences between them can mostly be explained by slight differences in baseline lengths. It is why I only showed RSS, and why I describe the satellite data as more stable (fewer unjustified adjustments) and having wider coverage.
Continuing to show your ignorance of the actual temperature datasets you continue to say satellite temps are different than … and not real temps. you actually hit on a truth: “These are products that weight the atmospheric temperatures from 0 to 12,500 meters.” Guess what else does that, the GCMs. I guess we should now ignore the model estimates also.
I guess Kevin didn’t participate in the past Global Warming is a hoax thread, if he had read and actually used critical thinking her would not make ludicrously inaccurate statements like: “We have surface measurements, they go back far longer than satellites. They are much more accurate than satellites.” Let me repeat how the current record was created and the hiatus/pause removed from the major surface datasets.
In 2015 NOAA issued a revision to the dataset. The latest major adjustment. It was based upon a re-analysis of the historical sea surface temperatures in an attempt to ?improve? them. Sea water temperature differences occur in the hundredths of a degree over decades and much smaller differences in the immediate short term. Sea surface temperature measurements have never been of the surface but of various depths below the surface. Originally they were done by drawing buckets full of sea water and then placing a thermometer in them for measurement. Just the raising of the bucket and the delay in measurement allows the water to slightly cool. As marine technology changed the measurements came from engine inlet cooling ports. These were never standardized in depth below the surface. As well you might have heard of things such as and storms which changed the depths of individual measurements. Most or the adjustments raised the temperatures in this old data. Finally, since ~2007 we have had a set of free floating and fixed buoys with calibrated equipment which measure sea temps from ~2000 meters to the actual surface. This is obviously the best data available.
What did NOAA do? They re-analyzed the older and with best guess work adjusted and standardized the old ship-based sea temperatures trying to convert them sea surface temperatures. They then applied these adjustments to the buoy data. Let me repeat again: obviously the best data available. They actually took the adjustments for the old problematic data, and applied it to the obviously the best data available. The overall effect was to raise global average temperatures. They then announced the effect of: “Data show no recent slowdown in global warming”
http://www.noaanews.noaa.gov/stories2015/noaa-analysis-journal-science-no-slowdown-in-global-warming-in-recent-years.html
The hiatus/pause has been a thorn in the side of the climatologists who believed wholly in the AGW hypothesis. So they just removed it form the surface records. Much like was attempted with the MWP.
Its only through ignorance and extreme predictions emotionalism that these ?scientists? still maintain a cadre who fail to think critically and through blind belief accept their data and pronouncements as valid. If you compare the two types of data, the satellite data show July as far from a record in even their data covering the admittedly warmest period in recent history.
When you can’t discuss the science attack the person providing it? Not only were you wrong your were ludicrously wrong.
CoRev states: “Kevin O’Neil, your point about cherry picking is totally wrong! I will explain why.” Except CoRev is *COMPLETELY SILENT* on the sensitivity to start date – the biggest cherry pick of all 🙂
He fails to explain his choice of RSS over UAH other than to say they’re similar – when in fact the UAH plot using the same dates shows an opposite trend. He fails to note that even the people who put out the satellite products have said the surface datasets are more accurate and consistent. My mother, now deceased, used to have a saying to explain certain people: “Lying liars lie.”
CoRev fails to explain the choice of satellites versus actual temperature measurements except to complain about NOAA adjustments. His complaint? Nonsense. It’s been dealt with many times in many places. The effect of all the adjustments is to *** REDUCE *** the increase in global temperature trends – not raise it. Big DUH! that deniers always fail to understand. Let me repeat, with no adjustments the increase in global temperatures trends would be even LARGER. The comparison is readily available from numerous sites. Those dastardly climate scientists have conspired to *REDUCE* the trend. Fail. Fail. Fail. Fail. FAIL.
Side note. When dealing with anomalies it makes little difference if you raise one end or lower the other. The resulting trends will be identical.
BEST? HADCRUT? Crickets. Geez, I remember a time when BEST’s results were avidly awaited by pseudo-skeptics. An actual denier/physicist was going to show those commie climate scientists what the *TRUE* numbers for global temperatures are. Oops. Pay no attention to that temperature dataset behind the curtain. It’s turtles (lies) all the way down.
CoRev also writes: “The hiatus/pause has been a thorn in the side of the climatologists who believed wholly in the AGW hypothesis.” Huh? Wait, wait, wait ….. is this the same CoRev that wrote, “BTW, the GHE is not an issue nor is the AGW influence.” Sure seems like a game of whack-a-mole. We’re not arguing the GHG theory and AGW are wrong, except when we’re arguing they’re wrong. Of course that mole (hiatus/pause) has been whacked to death a thousand times over. Foster and Rahmsdorf, Cowtan and Way, Kosaka and Xie. And as I pointed out, it’s getting harder and harder for deniers to cherry pick start dates that implies a pause and none of those selected dates are statistically significant.
Kevin, I explained why RSS. UAH is now essentially the same. Here is the official UAH site reference to v.6.0 “UAH V6.0 Global Temperature Update for July 2015: +0.18, http://www.drroyspencer.com/2015/08/uah-v6-0-global-temperature-update-for-july-2015-0-18-c/ WFT still used UAH v5.6 and has not started to download the new version. If you want to make something more than it is, OK. I’ll just chalk it up to desperation to make a meaningless point.
I also explained that satellites are more similar to model outputs than the surface data. BTW, when I explained the surface measurement issues did you note that there are very few actual surface readings At what height is the land surface measured? At what depth below the surface are the sea readings. But you can explain it to the hundredths of a degree?
When you assert something at least provide the link to the article: “Let me repeat, with no adjustments the increase in global temperatures trends would be even LARGER.” instead of just an unsupported graph.
Also in your side note I’m not sure what point you were trying to make. The Karl 15 adjustments to the NOAA, GISS, and HadCrut data, adjust all the data, and changes even the baseline. The end result of those changes is higher temps than previous versions. Remember NOAA is claiming record high temperatures setting records. You might also not know that all the surface datasets last year showed a hiatus/pause. Now none do. If yo are a cynic you might think that was the goal of the adjustment. Especailly when the PR announcement was that the hiatus/pause had disappeared.
What’s you point about BEST and HadCrut? Hadley has adopted the Karl 15 adjustments. I am not sure of JMA. BEST is unique. I don’t have any specific reason other than what I just said to talk about them. Do you? Otherwise your remaining references to typical alarmist excuses for denying the data are just as ludicrous as your main arguments have been.
Still *COMPLETE SILENCE * on the biggest cherry pick of all – the sensitivty to start date. crickets. crickets.
I did not cherry pick, I did not cherry pick, I did not cherry pick. LOL
CoRev – you’re a hoot. The adjustments performed by NOAA *REDUCE* the trend in global warming – agreed?
The choice of start dates is a cherry pick – agreed?
Surface temperature measurements go back further and are more accurate than satellite measurements – agreed?
Satellites give temperature values (they don’t actually measure temperature) at several thousand meters above the surface – agreed?
Now what was your claim again? LOL.
Oh man, you really can’t make these denier arguments up. People would just believe you’re a Poe if you tried.
@ Kevin, perhaps you need to get5 off SkS and the alarmist sites to see what the other side has to say. I do! The start date for the hiatus/pause is today then looks backward until the trend moves off zero. There can be no sensitivity to starting from today. If you think that is cherry picking then so be it. BTW, the method was peer reviewed and published. No, I will not link to it again. Look it up and learn to research.
You assert:
“The adjustments performed by NOAA *REDUCE* the trend in global warming – agreed? From what?
The choice of start dates is a cherry pick – agreed? Nope! Repeating doesn’t change facts.
Surface temperature measurements go back further and are more accurate than satellite measurements – agreed? Nope! Longer, but not more accurate.
Satellites give temperature values (they don’t actually measure temperature) at several thousand meters above the surface – agreed?”
Hit post too early to continue
“Satellites give temperature values (they don’t actually measure temperature) at several thousand meters above the surface – agreed?”
Nope! They measure light then convert to temperature using existing known and widely accepted conversion formulas. Ya’no the kind weapon systems use daily. They then report the temps in an average for the specific column at various stratifications. Another item for you to research. This is almost the same approach to reporting temperature that the models use. Another item for you to research.
So when you said the models were used to correct the data, how was it used for the surface datasets? Because that is clearly what is being done, because there is no independent validation available for them. They all use the same 90-95% stations, and now the same unjustified sea surface temps dataset.
Are you serious? Do you not already *know* that the effect of the adjustments is to REDUCE the trend? You actually need a link? Here’s where that particular version came from, Zeke Hausfather https://twitter.com/hausfath/status/564921572096348160 many others have created similar versions – Victor Venema, Nick Stokes, anyone that takes the time to look at the data can do it.
I really can’t believe you don’t already know this. You’re insane.
Do satellites measure temperature? Nope. Can CoRev even make that simple of an agreement? Nope. Even though he admits they don’t measure temperature 🙂 LOL. I tell ya, you can’t make this up.
I will not agree that they don’t measure temperature, because they measure light …. WTF?>
CoRev, sensitivity to start dates speaks directly to the *significance* of your purported pause. It’s statistically insignificant. Learn some stats man. Or are you now going to claim that plot you showed from WFT is statistically significant? It’s not.
Umm …. aren’t we interested in the temperature at the surface, ya know, where we live? Wouldn’t it make more sense to use an actual surface measurement? Don’t you agree that Satellites – whether accurate or not (which they aren’t) – can’t tell us the surface temperature? And why would we use them when we can measure it directly rather than relying upon sensors that can be obscured by clouds, water droplets, etc?
In facgt, hasn’t it been proposed that they underestimate warming by 30% when they aren’t looking at clear skies?
@Kevin, You’ve fallen into the trap of believing the alarmist propaganda.. ALL OLS trend calculation are sensitive to high/low values at the start and end dates. Your point has been cherry picking those high/low points to make a point with the trend.. How can starting from today be cherry picking? You appear to not even understand your complaint. From that I conclude you are just parroting. Think!
Yes, I read the many/several comments from Zeke and Mosher/Stokes etc re: the temp adjustments/calculations last year. Do you remember why they went on the defensive?
Your point of satellite data being proxy data is taken. Now explain how thermometer readings on the near surface are not also proxies using electric signals, changes in a fluid, or metal constrictions/contractions, etc. Either you are naive, ignorant or again just parroting the alarmist BS.
If you want to talk about statistical significance of the hiatus/pause trend then it gets much longer than just looking for a zero trend. That also was in the peer reviewed paper. Again, you appear to be just parroting without any actual knowledge of the subject.
Are we interested in the surface temps where we live? Of course we are, and they differ by over 100 degrees centigrade (or more) where we live. All the while we see alarmists obsessing over a fraction of a single degree change in well over 130 years. Even more ludicrous is the extreme claims that a ginormous 2C change would wrought.
Remember, this article was about about calling global warming a hoax. Most know that global warming is a euphemism for anthropogenic global warming (AGW), and as I just pointed out there are a lot of extreme claims for the dangers associated with
AGW. Nearly all of these claims/predictions are from climate scientists using their models. Models which you blithely admit can not represent climate science. Predictions that have not actually been fulfilled. Otherwise a list of successful predictions would have been quickly forth coming. Predictions that have been wrong since Hansen’s 1988, and which you provided the reasons why he was wrong then, and continues. I’ve also asked for some numbers associated with the quantities of warming from anthropogenic and natural factors. Crickets, especially in the science. Why? Because the hiatus/pause has shown how natural causes overwhelm anthropogenic. Accordingly, we have extreme effort to deny the existence of the hiatus/pause, and what appears to be an apparent attempt by the surface data management groups to remove/hide the hiatus/pause in their data. All the time the better and newer temperature data is from the satellites. Satellite temperature data which coincidentally is independently verified by the many decades of radiosonde data. Does that summarize your areas of counter argument?
This graph explains why alarmists so desperately need to minimize the satellite data: http://woodfortrees.org/plot/gistemp/from:1979/offset:-0.28/plot/gistemp/from:1979/offset:-0.28/trend/plot/rss/plot/rss/trend/plot/rss/from:2001/trend/plot/rss/from:1996.9/trend
There is a growing divergence between the satellite and surface data. That divergence increased after the Karl 15 unjustified adjustments. An adjustment that raises the temps in NOAA/GISS by ~4%. The graph still shows the hiatus/pause from 1996.9 and surprisingly a cooling,/b> since 2001. Notice we hardly ever see mention of that cooling trend. Moreover, we have seen that the latest surface data adjustments adjusted the newest best sea surface data with adjustments from the oldest, longest poorest sea surface data. Are those the skeptics’ arguments that you so desperately try to minimize or disprove?
Menzie using the disputed surface data has now had two articles trying to dispute that the whole GW/AGW issue is a hoax. Has he made a case? As Kevin has already said: ” 🙂 LOL. I tell ya, you can’t make this up. “
It’s really almost impossible to answer the Gish Gallop of misinformation presented by CoRev. For instance, he writes (speaking of satellites): “Nope! They measure light then convert to temperature using existing known and widely accepted conversion formulas. ” This is of course wrong. Surprise.
While it’s called “Brightness Temperature”, in scientific terminology this does not equate to bright as in light. The various satellites employ microwave sounders. They are passive devices that measure the intensity of the microwave radiation emitted from the earth in various frequency bands, up to 100 GHz. To quote RSS:
“Satellite passive microwave radiometers measure raw antenna counts from which we determine the antenna temperature and then calculate the brightness temperature of the Earth. Large antennas are used for the various channels of the radiometer, and during operation, each antenna feedhorn passes a hot and cold target in order to provide consistently calibrated raw counts. Brightness temperature (also referred to as TB) is a measure of the radiance of microwave radiation traveling upward from the top of Earth’s atmosphere.”
CoRev is like Fox News; the more you believe him the dumber you become.
CoRev writes “Accordingly, we have extreme effort to deny the existence of the hiatus/pause, and what appears to be an apparent attempt by the surface data management groups to remove/hide the hiatus/pause in their data.”
*CONSPIRACY!!!!* Jesus, just another nutter in a tinfoil hat. All of the raw data is available. All of the adjustments, their rationalization, and the methodology used is publicly available. Any halfway intelligent person can run the data with or without *any* of the adjustments. Many have. Yet here we have CoRev speculating that there’s an attempt by the UK Met Office, NOAA, GISS, BEST, and every private citizen to hide the decline. Except for the minor fact that the effect of all the adjustments is to *REDUCE* the trend. 🙂
CoRev also writes: “Your point of satellite data being proxy data is taken. Now explain how thermometer readings on the near surface are not also proxies using electric signals, changes in a fluid, or metal constrictions/contractions, etc. Either you are naive, ignorant or again just parroting the alarmist BS.”
Hmmm … funny that coming from someone that originally thought that ‘Brightness Temperature’ meant satellites were measuring light, then when pointed that was wrong claimed they measured infrared, and when that was shown to be wrong finally had to admit being wrong. So, you were wrong not once, but twice.
I, on the otherhand, have actually worked as a metrologist. I’ve not only calibrated microwave receivers and microwave generators, I’ve also calibrated numerous temperature devices – SPRTs, thermocouples, the associated electronics, and liquid-in-glass thermometers. I’ve used triple points to provide a measurement uncertainty of a few millidegrees Kelvin. Suffice to say I’m quite familiar with both the physics behind various types of temperature measuring devices and the equipment and methodology used to calibrate them.
Anyone – like you – that believes the calibration process for an SPRT, TC, or LIGT is remotely comparable to the process necessary to calibrate an orbiting sensor platform is frankly lying on the porch with the seat next to him getting cold – cuz you’re definitely off your rocker.
The UAH dataset still suffers (reputation-wise) from not just the mistakes Spencer and Christy made, but their self-righteous refusal to admit any possibility of error. It took a published paper showing how orbital decay was responsible for the large discrepancies in their UAH data versus other datasets – an effect they had not made allowances for. This is science. Mistakes are made, especially when people are doing something at the cutting edge. That they made mistakes is understandable. That they had to be pushed kicking and screaming to admit their mistakes was not.
Today we see a similar situation. The satellite measurements are not lining up with what we’d expect. A fairly simple and straightforward reason has been put forward – microwave signals being ‘corrupted’ by atmospheric scattering. Weng et al, in Uncertainty of AMSU-A derived temperature trends in relationship with clouds and precipitation over ocean show what appears to be significant differences between clear sky and non-clear sky brightness temperature measurements:
“Microwave Sounding Unit (MSU) and Advanced Microwave Sounding Unit-A (AMSU-A) observations from a series of National Oceanic and Atmospheric Administration satellites have been extensively utilized for estimating the atmospheric temperature trend. For a given atmospheric temperature condition, the emission and scattering of clouds and precipitation modulate MSU and AMSU-A brightness temperatures. In this study, the effects of the radiation from clouds and precipitation on AMSU-A derived atmospheric temperature trend are assessed using the information from AMSU-A window channels. It is shown that the global mean temperature in the low and middle troposphere has a larger warming rate (about 20–30 % higher) when the cloud-affected radiances are removed from AMSU-A data. It is also shown that the inclusion of cloud-affected radiances in the trend analysis can significantly offset the stratospheric cooling represented by AMSU-A channel 9 over the middle and high latitudes of Northern Hemisphere.”
Given the fact we’ve had significant problems with satellite temperature data in the past, given that the calibration process is inherently complicated, given that a fairly straightforward exegesis points to a 20% to 30% error – not to mention the fact the data is for several kilometers above the surface – there is no imaginable reason to prefer satellite temperatures over direct measurements.
Nutters mileage may vary.
I’ve already shown you that neither the GHG theory nor the theory of AGW depends to *any* extent on GCMs. Was Fourier using a GCM? Was Arrhenius, Very, Callendar, Keeling, or Revelle? By 1963 the basics of both theories were already well-known, such that the Conservation Foundation report Implications of Rising Carbon Dioxide Content of the Atmosphere stated:
Three of the minor components of the atmosphere – carbon dioxide, water vapor, and ozone – are very important in the heat balance of the Earth because they absorb radiation in a critical part of the spectrum. Any large change in the amounts of these in the atmosphere (even though the overall composition of the atmosphere remains nearly the same) will affect the surface temperature of the Earth. An increase in CO2 is particularly effective since the warming it causes increases as well the amount of water vapor. A doubling of the atmospheric CO2 is calculated to increase the average surface temperature by 3.8C under clear sky conditions and about 2C under conditions of average cloudiness.”
CoRev, the Conservation Foundation report was over 50 years ago. Arrhenius proposed 4 to 6C for a doubling of CO2 over 100 years ago. Both the GHG theory and the theory of AGW were well-known before the advent of GCMs. All GCMs do is aide in refining our knowledge. The fact you don’t know this history, or understand it, and somehow think either theory relies upon GCMs is ignorance on your part. The fact you can’t accept it when explained to you is stupidity. The fact you claim nearly everyone accepts it – yourself included – then continue bashing it at every other step is insanity.
But let’s look on the bright side – that’s a very stylish and shiny tinfoil hat you’re wearing 🙂
@ Kevin, It’s really almost impossible to follow the misinformation you present. I admitted I was wrong about the MSU focus on infra red. I have yet to see you admit you were wrong about anything. Who said the models were used to validate the data? You did.
The models don’t represent the climate science? Then you say they only represent some of the science. But we know the models use parameters for those science factors too complex or large too compute using today’s computer technology. Now you want us to believe those parameters are developed without using today’s latest science? The models, therefore, represent the available climate science? Apparently it is too difficult to admit your errors in these two areas.
I can’t decipher if you are using straw or Gish to make your arguments.
1) I asked this: “Now explain how thermometer readings on the near surface are not also proxies…”
You respond with 3 paragraphs about Kevin and nothing about the obvious answer. Yes, they are all proxies for temperature.
2) You then discuss the quality of the UAH data, when earlier you computed a UAH trend and didn’t know that they had upgraded to a new version, v 6.0. Anyone following the data would know this.
3) You then made accusations re: UAH making changes to their processes after they were proved to be in error. Isn’t that what science is about? Can you say the same for several of the alarmist leaders? (See my answer 4) re: the kicking and screaming. Just as they did in the early days of its processing. Once convinced they made the adjustments.
4) Further you discuss the Weng 30% difference paper and assume it is an absolute truth. let’s go see what Dr Spencer said about it: “The fact that our monthly gridpointradiosonde validation shows an extremely high level of agreement with the satellite further supports our assumption that such contamination is small.” Remember that small issue of independent validation of satellite data? http://www.drroyspencer.com/2014/10/do-satellite-temperature-trends-have-a-spurious-cooling-from-clouds/ In this case they were not convinced, could not find the same differences as Weng, used their independent validation source to verify Weng versus their processing. In the end the accepted there was a minor adjustment identified Weng and put it on the list for later adjustment/upgrades. Jsut lie the did in the early dary.
5) You further made this claim of data quality, surface versus satellite: “Given the fact we’ve had significant problems with satellite temperature data in the past, given that the calibration process is inherently complicated, given that a fairly straightforward exegesis points to a 20% to 30% error – not to mention the fact the data is for several kilometers above the surface – there is no imaginable reason to prefer satellite temperatures over direct measurements.”
How convenient it is to forget it is about the trends. The satellite data better represents the model outputs, averages for atmospheric columns versus pseudo surface. Almost none of the data used in the surface datasets are actually from the surface. In modifying/calculating/converting the raw almost surface data to actual surface values we still see major adjustments being made. The latest was just June, 2015. The fact is we’ve have significant problems and questions over that adjustment. Add to that the infamous BEST, Cowtan & Way, Foster & Rahmstorf attempts to improve the surface data processing, in just the past few years it is hard to beleive anyon familair with the data and the needed processing would imply processing the surface data to be so simple that: “Any halfway intelligent person can run the data with or without *any* of the adjustments.” Let me be clear, each of these independent attempts have had different results.
You also conveniently missed this point about the divergence and prior agreement to about 2005: http://woodfortrees.org/plot/gistemp/from:1979/offset:-0.28/plot/gistemp/from:1979/offset:-0.28/trend/plot/rss/plot/rss/trend
So with all these serious problems and multiple attempts to improve the surface data results: there is no imaginable reason to prefer surface temperatures over satellite measurements.”
6) You also said this: “I’ve already shown you that neither the GHG theory nor the theory of AGW depends to *any* extent on GCMs. ” I never said they depend on the GCMs. I said the GCMs represent the science. WMO, even you admitted they represented just some of the science while ignoring their parameterizations for the remaining science over your some that was included.
7) Your Conservation Foundation report estimate of 2 to 3.8C is one of many ranging from below 1c, and far from your 4 to 6C estimate from Arrhenius. All are interesting exercises, but all we really ?know? is that it has warmed since the LIA. How much is still an issue, unless you ignore all the comments of data quality issues.
8) That last comment is an example why you have failed to provide a list of successful predictions. Even your own examples have ranged from 2 to 6C, a factor of 3 for low to high guesses.
You often try to belittle. I try not to respond in kind, but admit I do weaken, but I do respond with facts, data and references. So I will show you this difference again:
http://woodfortrees.org/plot/gistemp/from:1979/offset:-0.28/plot/gistemp/from:1979/offset:-0.28/trend/plot/rss/plot/rss/trend/plot/rss/from:2001/trend/plot/rss/from:1996.9/trend
A note: the offset to GISS to place it on the same baseline as RSS was -0.25 before the Karl 15 adjustments. It now is -0.28.
Corev writes: “Who said the models were used to validate the data? You did.”
No. I did not. In fact, down below you serve up a quote to *prove* I did – here’s the quote: “The adjustments to SST data in the past was largely a result of model output. When there is a discrepancy between models and data one has to examine the discrepancy to see which is incorrect. ” I count two sentences. 15 words in the first, 20 words in the second. But ya know, I keep reading and rereading and I simply FAIL to find the word ‘validate’ anywhere in either sentence.
Now, *validation* and calibration are specific processes used to show that a dataset is ready for prime time. Is that what I said – or anything resembling that? *NO* I explicitly said that because models and observations differed scientists *examined* the situation. This examiination is what then led to the adjustments. In no way shape or form did I say models were used to validate the datasets. Jesus fricking christ the word isn’t even in either sentence!!!
So, apparently I should admit I’m wrong because you can’t read and because you don’t know what *validation* actually entails. Sorry, ain’t happening. You want me to admit I’m wrong. Fine, point to something in which I’m *actually* wrong. I’m not here to ease your feelings. You make a mistake in every other sentence.
CoRev – do you not realize you’re comparing apples and oranges? The satellite measurements *are not* surface temperatures. The GISTEMP LOTI *is* a surface temperature dataset. So a surface temperature dataset that has a 2m difference (that scientist *do* consider to be possibly significant) is a problem, but data that shows a possible 20% to 30% error is not. Okey dokey. Dr Roy says he can’t be in error so end of story. LOL after the shenanigans they pulled with the orbital decay you *would* just lap that up now wouldn’t you. PSEUDO-SKEPTIC. You have data you can verify from a published paper that *shows* the discrepancy. But Dr Roy says it’s all OK so you’re ceaseless, tireless investigaion …. goes on hiatus LOL BTW, I never said the error was prove, but it is fairly straight forward. I’ve yet to see anyone point a simple error they made. So, we’ll see what further investigation brings. If the next paper corroborates it, then it will be a *conspiracy* to warm the satellite data LOL. God this is neverending isn’t it. Once you enter tinfoil hat land you’re pretty much beyond rescue.
CoRev, the *CONSPIRACY!!* tinfoil hat wearing dude. A real hoot.
@ Kevin, Kevin believes the infra red wave lengths falls out side the overall light wave lengths. Here’s what NASA says: “Infrared light lies between the visible and microwave portions of the electromagnetic spectrum. Infrared light has a range of wavelengths, just like visible light has wavelengths that range from red light to violet. “Near infrared” light is closest in wavelength to visible light and “far infrared” is closer to the microwave region of the electromagnetic spectrum.” http://science.hq.nasa.gov/kids/imagers/ems/infrared.html
If you want to add infrared in front of light, be my guest. If you want more examples of infrared being part of the visible light spectrum (not just by the human eye), I would be happy to oblige, but let me point out your comment is representative or alarmists’ desperation to disprove the hiatus/pause and the depth of your knowledge.
I’ll slightly modify your weak attempt to insult: “Kevin O’Neil is like most alarmist blog sites; the more you believe them the ignorant you become.”
Next i expect you to tell us how accurate are the most recent predictions, even though the vast majority of them are from use of those not-representative of climate science.
Let’s see what Dr Roy has to say about the satellite frequencies:
“The MSU and AMSU instruments measure the thermal microwave emission from atmospheric oxygen in the 50-60 GHz oxygen absorption complex, and the resulting calibrated brightness temperatures (Tb) are nearly equivalent to thermometric temperature, specifically a vertically-weighted average of atmospheric temperature with the vertical weighting represented by “weighting functions”.
Infrared *begins* at 300 GHz. That’s just a bit above the satellite channels. Microwaves are *not* considered light. Microwave is not infrared. More FoxNews like misinformation from the CoRev. Do you see why nothing you say can be taken at face value or trusted? Simple facts that are easily checked you get wrong. If talking out of your ass was an Olympic sport CoRev would be a Gold Medalist.
Kevin, let’s see what Wiki has to say: “Measurements of infrared radiation pertaining to sea surface temperature have been collected since 1967.” But I agree my emphasis on infra red was incorrect. I was wrong.
CoRev writes:”The hiatus/pause has been a thorn in the side of the climatologists who believed wholly in the AGW hypothesis. So they just removed it form the surface records. Much like was attempted with the MWP.”
I’ve dealt elsewhere with the insanity of claiming that almost everyone – including himslef – believes in both GHG/AGW, then implying that only climatologists ‘wholly’ believe in it. I’ve also dealt elsewhere the tinfoil nuttery of the *CONSPIRACY* to hide the decline. Suffice to repeat that all the raw data is available are the adjusted data and the methodology used to make them. Anyone who desires can repeat the process for themselves. many have. The overall effect of the adjustments is to *REDUCE* the global warming trend. Nuff said on that.
What we haven’t dealt with yet is the MWP – Medieval Warm Period or Medieval Climate Optimum (MCO). CoRev just makes a quick tweet on his dog-whistle here – obviously used to dealing with nutters from WUWT, JoNova’s, Bishop Hill or similar seedy anti-science websites. This kind of dog-whistle normally attracts a nod of heads and you can almost hear the ‘Amen, brother – stick it to those commie, pinko, fraudulent klimate kidz.” Unless you have a strong stomach I *DO NOT* recommend you visit any of those places.
I am torn between just letting CoRev hang himself again or anticipating his nuttery. This is all same ol’, same ol’ after all. Let’s begin with basics: to disappear the MWP it first had to exist; CoRev, can you
1) Please point us to the global reconstruction that showed a MWP? The one climate scientists around the world have conspired to disappear.
2) Assuming you have answered 1) above, what are the uncertainties?
3) Assuming you’ve answered 1) above, is the data behind this publicly available?
4) Is there any accompanying text we should take note of?
5) Is the calibration methodology included?
6) Does this data include tree rings?
7) Is this data widely accepted by the scientific community as accurate?
Keywords: IPCC, 1990, H. Lamb, schematic, CET, Monckton, libel
CoRev’s answers to questions :
1) IPCC FAR 1990 Fig. 7.1.c (except it’s not a reconstruction – it’s a schematic)
2) I don’t know (there are no uncertainties on the schematic – hell there’s not even a temperature scale – and the date axis is all wrong)
3) No (the data from 1600’s on is basically the Central England Temperature record with a 50-year smooth with the last year on the graph sometime in the early to mid-70s, before that Lamb used his best judgement of the ‘evidence’)
4) Yes (the text notes that the scale is probably 2 degrees and that it’s not known if it was regional or global)
5) No calibration was made, hence no methodology available
6) Only H. Lamb knows
7) It wasn’t even accepted at the time (1990) – much less today. It was an early attempt to put historical temperatures into some sort of context, originating with work Lamb did in the early 1960’s. Given the lack of data resources available to H. Lamb one cannot criticize him for it. That deniers and pseudo-skeptics latched onto it as the ‘one true graph’ isn’t Lamb’s fault 🙂
The schematic in Fig. 7.1.c is probably the most abused graph in history. A couple dozen different versions of it exist on these intertubes. Lord Monckton used one in a newspaper article and claimed it was from IPCC 1990 and it wasn’t. I pointed this out and he threatened me with libel over on WUWT. He went through the charade of having AW email me asking for my real name, address, etc so his lawyers could sue me. OMG!! I was shaking in my boots (/snark). Open shut case really – the graph was clearly not the IPCC one. It was easy to spot – most of the errors had been corrected 🙂
Nutters like CoRev simply lack the education in the history of these things. They are easily swayed by charlatans like Monckton, Watts, et al. They like to call themselves skeptics, but they’re never skeptical of anything they get served up on denier sites. It usually takes a Steve Mosher or a Nick Stokes to stop in an point out the obvious fact that the emperor has no clothes. I’ve seen obvious errors of fact go unchallenged for days/weeks/months. Hence the name pseudo-skeptic.
How appropriate. Kevin has a complete discussion including rebuttal in his own head, and he shared with us. He even belittled and was sarcastic to his pseudo-self. 🙂
CoRev,
Oh, you have *different* answers – I’d love to hear/see them.
But my bet is you’re a tiresome regurgitator of anti-science denialist sites. Hey, prove me wrong. That would be far more interesting than the same ol’ tired mistakes I see day after day from the tinfoil hat crowd.
Sincerely, (really, honest to whatever god you choose) give me some *fresh* meat to chew on. The same old mistakes just get *so* boring.
KTO
I hope everyone notices that CoRev has declined to answer this particular comment. Below ConspiracyRev writes, “He then, in a laughable argument with himself, and really goes off the deep end of strawman argumentation. I didn’t follow the contorted logic he used on himself to make any point.”
CoRev made the claim scientists have conspired to disappear the MWP. For it to be disappeared it must have existed. I asked CoRev for his proof – i.e., the global reconstruction that showed a MWP. He cannot. He will not. None exist. I should also have asked him for the dates that define the MWP. My bad. In any event, it’s likely we’ll continue to hear crickets from CoRev on this subject 🙂
Dr Carl Mears, Vice-President and Senior Research Scientist at Remote Sensing Systems – the very people CoRev cites for his data, the data he maintains is more accurate that the surface temperature datasets has both spoken and written on this subject. Dr Mears says:
“As a data scientist, I am among the first to acknowledge that all climate datasets likely contain some errors. However, I have a hard time believing that both the satellite and the surface temperature datasets have errors large enough to account for the model/observation differences. For example, the global trend uncertainty (2-sigma) for the global TLT trend is around 0.03 K/decade (Mears et al. 2011). Even if 0.03 K/decade were added to the best-estimate trend value of 0.123 K/decade, it would still be at the extreme low end of the model trends. A similar, but stronger case can be made using surface temperature datasets, which I consider to be more reliable than satellite datasets (they certainly agree with each other better than the various satellite datasets do!). “
I suspect CoRev believes he knows more than Dr Mears. The Dunning-Kruger must be amplified by all that tinfoil on his head.
There are several issues with today’s science. 1) It’s not predicting future temps well at all. http://images.remss.com/figures/blogs/2014/rss_model_ts_globe_tlt_mears.png (From Kevin’s own reference above.) See how rapidly these AR5, CMIP5 model runs diverged. This graph may be a little deceiving, since it doe not define which CMIP5 scenario is used. If it is the average of all then the divergence will be lessened. If it is not the status quo scenario then the divergence will also be lessened.
2) Most GW/AGW model(s)-based predictions starting in the era since Hansen’s 1988 prediction have been wrong. Notice how Kevin was unable to cite even one.
3) Until the hiatus/pause the science emphasized and pretty much diminished or even ignored natural causes for climate change.
Also from Kevin’s we have these quotes: “The plot shows that the measured temperature rise is within the envelope of model predictions up until the late 2000’s. After that time, observed temperatures are sometimes less than any model prediction, and are clearly different than the mainstream model behavior. This slow-down in the warming, often called the “warming hiatus”, has become a major research topic over the last several years, and a source of much controversy across the blogosphere…” Highlights the overall problem
and
“(Note that the same events warmed the stratosphere. See our TLS dataset.) Remember Kevin’s claim that the stratosphere cooled due to GHGsThe year-to-year variability of the measured data is dominated by El Niño/La Niña events, with an overall warming trend (0.123K/decade) on longer timescales. Highlights the importance of natural event (other than just volcanic
and
Possible errors in the models is an important section to review n Kevin’s reference. Here is what I and many skeptics have been saying for many years, even before the recognition of the hiatus/pause:
“Internal Variability:
Part of the cause of the hiatus could simply be due to bad luck, that is, the last 15 years could have been cooler than normal simply because of random fluctuations in the climate system…” Random is not the over riding issue but the the recognized cyclical fluctuations. Solar, ENSO event, ocean oscillations, Bond and/or Dansgaard–Oeschger events, etc (others still to be discovered, clouds, polar ice, long term solar are some possible areas ) all occurring within the major cyclical event the glaciations.
Kevin’s reference concludes with this:
“Conclusion:
My view is that the subduction of heat into the ocean is very likely a significant part of the explanation for the model/observation discrepancies. What is less clear is whether or not this subduction is due to random fluctuations in the climate, or some sort of response to anthropogenic forcing. An important question is now ‘how long will the enhanced trade winds continue?’. The trade wind anomaly lessened during 2013, but we do not know whether this change will persist over the next few years and lead a positive phase of the IPO, or if the IPO will take longer to flip to its other phase.
I’ll conclude by reiterating that I do not expect that the hiatus and model/observation discrepancies are due to a single cause. It is far more likely that they are caused by a combination of factors. Publications, blog posts and media stories that try to pin all the blame on one factor should be viewed with some level of suspicion, whether they are written by climate scientists, journalists, or climate change denialists.”
So even thought apparently written by someone of Kevin’s ilk, using the term “Denialist”. Kevin’s reference more closely represents the skeptical position than the alarmist. Skeptics have said for years that the natural climate forcings are being ignored or diminished. I’ll repeat what Dr Mears said about the shift of attention in climate science: “This slow-down in the warming, often called the “warming hiatus”, has become a major research topic over the last several years, and a source of much controversy across the blogosphere. ” The finding from this shift is leaving a core of “blind believers” of AGW as the major cause of climate change, and especially those who have “blindly accepted” without any scientific skepticism that all/nearly all/most of the recent warming is from AGHGs and especially ACO2 in an awkward, scientifically less unsupported position.
Kevin and Menzie have yet to receive or accept the memo.
Let me also point out how Kevin has taken one statement out of the Mears article and exaggerated its meaning. Mears better supports the skeptics long held position than Kevin’s.
Another note: It is easy to see why providing a reference to review and research a claim is needed, and when not provided cynicism might be the best rule when evaluating them. Kevin’s comments represent the worst of the alarmist commenting arguments/style.
tl;dr
Dr Mears: “surface temperature datasets, which I consider to be more reliable than satellite datasets”
CoRev: but, but, but, satellites are more accurate.
Unable to admit he was wrong – even when the opposition is the source he’s backing. LOL ya really can’t make this up 🙂
CoRev – Every scientific discovery is in fact a prediction of how the world works – as opposed to how we thought it worked before the new discovery. Do you not understand that? Obviously I *do* give you too much credit for intelligence.
Some of the examples, especially Manabe and Weatherald, rule out other theories; i.e., “it’s the sun!” No other theory explains stratospheric cooling.
Revelle and Suess’ prediction of CO2 absorption by the oceans being 1/10 what it was thought to be otherwise is directly related to AGW and how much of it is due to the anthro- part. As Revelle said, “Human beings are now carrying out a large scale geophysical experiment of a kind that could not have happened in the past nor be reproduced in the future.” Yet, when Revelle made this statement he wasn’t even that worried about the future – because he vastly underestimated how much human CO2 emissions would actually increase in the following decades.
If you accept the GHG theory, and you accept AGW, then there’s not much left to accept. Do you deny paleo- evidence? Hansen’s famous 1988 paper that draws so much denier attention as being ‘wrong’ is pretty much evidence they don’t know what they’re talking about. If you take scenario B, which pretty well matches emissions post-1988, and remember that he used a climate sensitivity of 4.2C, you find that if he’d used 3C instead he would have been pretty much spot on. It shouldn’t be surprising then that 3C is close to the consensus estimate of climate sensitivity for a doubling of CO2.
Lower estimates of climate sensitivity, especially those that go much below 2, will have significant trouble explaining paleo data. I don’t know of any that even try.
Kevin, please thing. Just a little. Have the HANSEN predictions you cited come true? Any of them? For you to explain the Hanen 1988 graphic/estimates you have to point out why he was WRONG , Thanks . Most skeptics, me included, accept the basics of the GHE and AGW, but we almost universally reject the extreme projections/predictions from the models and the scientists using them.
You have yet to provide a list of successful predictions. We have known the stratosphere was cooler than the troposphere. The atmospheric lapse rate also predicts it and estimates temps. Both are probably correct. Although the stratosphere is also largely effected by ozone.
Keep digging, your demonstration of desperation and ignorance is quite amusing.
That was supposed to be think not thing.
CoRev writes: “The science is represented by the GCMs.”
I’m not sure which word best describes this idea; laughable, stupid, dumb, ignorant, insane?
GCMs are merely models of the interaction between physical processes that take place on earth. They are limited by both our knowledge, computer processing power, time, and money. One doesn’t need a GCM to know that GHGs warm the earth. One doesn’t need a GCM to know that CO2 is a GHG. One doesn’t need a GCM to know the Earth has warmed since pre-industrial times. One doesn’t need a GCM to calculate what percent of the atmospheric concentration today is due to anthropogenic causes. One doesn’t need a GCM to examine paleo data and make conclusions about orbital forcing, solar increases/decreases, and glaciations.
In other words, the science is represented by the science. Each individual science that contributes to our understanding of climate change is only approximated in a GCM due to the constraints I listed above. We can’t model every atom, molecule, photon over the entire surface of the Earth and the atmosphere above it – even when we understand the physics down to the quantum level putting all of that information into a computer model at planetary scales is far beyond our capabilities.
GCMs don’t represent the science, they’re merely a tool to help us better understand climate changes. As the late George Box is often quoted, “Essentially, all models are wrong, but some are useful.” GCMs are no exception.
Kevin, if you disbelieve this: “The science is represented by the GCMs.” , then you disbelieve the scientific method. I did not read anything past that most ignorant statement.
CoRev – *some* of the science is represented in GCMs. Some, and only some. I’ve gone at length on why this is. tl;dr: Science knows more on just about every subject than can be encapsulated in a computer program. To then turn around and claim the computer program represents science is basic nonsense. But, coming from you, that’s quite keeping in character.
Thanks for bringing some outstanding knowledge and expertise to this debate. CoRev is a classic denier who go to denier sites and pick from their treasure of ignorant Cherry picked BS. Engaging in his “counter-arguments” is a waste of time. But dismantling his initial postulates is very useful for those of us that do not have the time to dig into every little “orbital sunspot” theory that pops out of denier community. So thank you.
Kevin & DeDude, these are the steps of the scientific method.
1. Ask a question or define a problem that needs a solution.
2. Background research
3. Construct hypothesis
4. Test hypothesis with experiment (should be a fair test)
5. Analyze data
6. Draw conclusion (accept or reject hypothesis)
7. Communicate results
“Climate Models
Just as an architect might build a scale model of a building to understand and predict its behaviour, so too the climate scientist can build a computer-based model of the climate system to understand and predict its behaviour. Climate models incorporate the physics and chemistry of the atmosphere and the oceans and aim to answer questions such as when the next El Niño might occur, and what might happen if greenhouse gas concentrations double.”
and
“Global climate models (GCMs)
Climate models are a mathematical representation of the climate.”
http://www.wmo.int/pages/themes/climate/climate_models.php
Perhaps you think these models do not implement the latest science within them, but even the targeted models use it.
So tell me again how my statements, usually supported by references many of which are far from ?denier? sites, are wrong. Specifically tell me how my description of the science = the models is wrong.
BTW, answer my 1st question re: successful predictions, and while you are at it, explain what is being denied. It should be simple since you understanding of the literature is so much deeper than mine. Just look at Kevin’s list of scientists.
CoRev – I’ve at length already explained. GCMs *cannot* represent known science.
1) knowledge – We do not know the simultaneous exact state of every input variable.
2) Computer processing power -even if we knew the exact state, we don’t have the processing power to resolve down to scales of 1km, much less quantum scales
3) Time – Even if we had the processing power, the time required to input and run the simulations would make the task unfeasible
4) Money – Assuming we cleared all the other hurdles the cost would make the task unfeasible
We *know* many areas where GCMs are deficient. For instance, the loss of arctic sea ice in the past decade has been stunning. At the ice minimum in 2012 nearly 80% of the ice volume present *at minimum* during the 1990s had been lost. This was accompanied by large decreases in both sea ice area and extent. The GCMs did not foresee such losses until the 2040s or 2050s. Scientists that studied the arctic were telling a different story. The science was ahead of the GCMs. In this particular area it still is. To claim that GCMs represent ‘the science’ in respect to the arctic is nonsensical. Any area where we know GCMs are deficient is because ‘the science’ tells us they are. But that would be impossible if GCMs were ‘the science.’ It’s a simple logical fallacy – but of course you bought it. Color me surprised (/snark).
GCMs are the best tool we have, but no one should believe they represent our knowledge of the science. They represent the amount of knowledge that we can reasonably pack into a computer program. It’s time you accepted that and moved on.
Kevin, now you want to explain the GCM weaknesses as you explained why Hansen was wrong? We both agree the models do not predict/project well due to their limits. But those limits are parametrized using the latest science. Or are you now claiming the parameters are just more guesswork and not based upon science?
All the rest is cover your backside junk.
CoRev – Do you have difficulty reading? “They represent the amount of knowledge that we can reasonably pack into a computer program. It’s time you accepted that and moved on.”
*You’re* the one claiming they represent science. That’s a laughable idea.
*I’m* the one saying they are irrelevant to the theories of GHG and AGW. They are merely tools to help us understand the system.
I’ve already quoted George Box upthread, “Essentially, all models are wrong. Some are useful.” I said GCMs are no exception.
But somewhere in the dusty recesses of what passes for your brain you make an illogical leap and claim they represent science. No, they don’t. They can’t. It’s a logical fallacy that you can’t get out of. It was a stupid/ill-thought statement on your part. No one is arguing climate models are perfect. No one is arguing they have all the relevant science within them – at best they’re approximations. Instead we have *you* claiming they represent science. I don’t make that claim. GCMs don’t make that claim. The people who wrote them don’t make that claim. The scientists who use them don’t make that claim. *You* do. I’m beginning to think you’re too dumb to understand you need to ask yourself why *you* make the claim when no one else does.
GCMs are flawed? So what. Every model is a map of the territory – it’s *NOT* the territory. You’ve gone and conflated the map with the actual territory.
Kevin, we agree the models suck! If they do not represent the science then they are representative of guess work approaching AGW/
GHE hypotheses. BTW, where did those parameter definitions come from? Guesses? Thin air guesses? Scientific guesses? They models must by definition also useless as tools. Then we can agree.
The rest is again your back side covering comments.
No, we agree you’re talking out of your ass. Was there a better prediction than Hansen’s 1988 model? The naive estimate using the tenets of those that *denied* global warming would be for temperatures the last 30 years would be the same. Many deniers predicted (and still predict) a general cooling trend in the coming decades.
As I stated. One of the assumptions the model was given was a climate sensitivity of 4.2C for a doubling of CO2. A better estimate (in *hindsight*) would have been 3C. If that had been used the model results would have been spot on. This is *not* model failure. It’s failure on the part of Hansen (in *hindsight*) to put in a better value for sensitivity.
From that you apparently ‘learn’ that ‘models suck’? Fail isn’t even strong enough. You’re not even wrong.
Where did the parameter come from? I’ve already told you. Do you not read or do you suffer from short-term memory loss and can’t keep an idea in mind from one post to another? Hansen based his value of 4.2C on the best estimates available at the time – paleo studies. Again, ‘not even wrong’ is the best way to sum up your thoughts.
One of the CoRevs writes: ” If they do not represent the science then they are representative of guess work approaching AGW/
GHE hypotheses.”
Once again you’re attacking the theory, but you’ve already said you accept it. Schizophrenia? Are there two different people using the same account? Which CoRev are we dealing with? Perhaps you could preface your posts:
1) This is the slightly stupid and ignorant CoRev
2) This is the totally batshit insane CoRev
It’s hard to keep the different versions of Corev straight.
CoRev *originally* wrote: “Menzie et al who blindly believe in the GW/AGW hypothesis, can you give us brief list of the correct irrefutable predictions made by climate science? ”
When presented with a list of a couple dozen successful predictions did you notice how the goalposts shifted? Whack-a-mole, whack-a-mole.
Fourier, Arrhenius, Callendar, Revelle, Manabe, Sagan, et al have all made successful predictions based on what we today call the GHG theory and the AGW theory. But CoRev can’t accept that. Instead that’s just ‘science’ – to CoRev climate science is and only is GCMs. First it was a request for successful predictions from ‘climate science’ – now it’s GCMs. This tiresome game of ClimateBall is repeated everyday on the web with pseudo-skeptics and deniers using the same losing arguments.
But it’s worse than that. GCMs don’t even claim to make predictions. In fact the modellers behind them go to great lengths to explain that the model realizations are limited by many factors. They run the model hundreds, sometimes thousands, of times to create a spread (ensemble) of likelihoods. Even then they are subject to our inability to predict the value of certain variables that can have a large impact – CO2 emissions, sulfate emissions, volcanic eruptions, and natural variability. GCMs have not yet reached a stage where they can be expected to accurately project decadal scale results. Expecting them to is just flat out wrong. CoRev is part of this latter group – expecting something from GCMs that they are not designed to do.
That said, models can often tell us when *data* is bad. The stratospheric temperature cooling mentioned above took almost a half-century to confirm. More recently the tropical tropspheric ‘warm spot’ only know seems to have confirming data coming in (the RSS satellite data is the outlier here – CoRev’s new favorite orbital sensing platform). The adjustments to SST data in the past was largely a result of model output. When there is a discrepancy between models and data one has to examine the discrepancy to see which is incorrect. Most of the time it’s the model – showing modellers where they need to improve. Sometimes it’s the *data* that’s incorrect. Deniers rarely if ever point out when the models were correct and the observations were wrong.
In the end, the obsession on GCMs is just that, an obsession. Neither the GHG theory nor the theory of AGW rests on model output. Of course CoRev doesn’t disagree with either theory (snark).
CoRev and those of hus ilk have a strategy that basically boils down to throwing a whole bunch of shit on the wall and hoping that some of it sticks. The sad thing is many of these same ClimateBall players on the pseudo-skeptic team *know* they’re making losing arguments. It doesn’t deter them. It just reveals their internal moral fabric.
Kevin as i said the GFE and AGW are not the issue. What is constantly argued is the predictions (or projections because the models are too poor to predict) the are no where near reality in just short periods after being made. Many of the worst are from groups using those very same models, which you admit: “GCMs have not yet reached a stage where they can be expected to accurately project decadal scale results. Expecting them to is just flat out wrong. ” Time after time we see alarmist projections from those very same inaccurate models. You want us to believe the models being wrong or incapable on the short scales they are capable at the larger? Iterations of short term errors are corrected by more iterations? I bet you are one of those folks who never balanced their checkbooks because they could never figure out how.
Only in your dreams has the tropospheric ‘warm spot’ been discovered. If its not evident in the satellite data, and not ever been evident in the radiosonde data, then how is it derived from the surface data? BTW that last comment is important as it explains the satellite data has a source for independently validating the lower troposphere readings. While you assert that the surface data is validated by the models. Those very same models you assure can not do short term projections. That’s the same poor logic you used on the models defense.
You have failed to provide any successful AGW/GW predictions, which is IIRC was my request. Listing the founders and major contributors to the hypothesis are not predictions. Cite something specific they predicted not their contributions to the hypothesis.
BTW, most skeptics have no strategy. They just rely on logic and data with references. You are woefully short in those so far.
CoRev writes: “While you assert that the surface data is validated by the models.” Huh? Where, when? I think you need new reading glasses.
And, “You have failed to provide any successful AGW/GW predictions” Have you already forgotten your admission that Manabe and Weatherwald predicted the stratospheric cooling 50 years before it was confirmed? That Very predicted the temperature of the moon a couple decades before it was confirmed? That Sagan predicted that GHG would be responsible for the high temperatures on Venus?
Just keep repeating to yourself there were no successful predictions. Don’t let the facts get in your way.. They haven’t up til now 🙂
CoRev writes, “You have failed to provide any successful AGW/GW predictions, which is IIRC was my request.” No (and this is the 2nd time I’ve quoted your own words back at you on this matter) you *originally* wrote: “Menzie et al who blindly believe in the GW/AGW hypothesis, can you give us brief list of the correct irrefutable predictions made by climate science? ”
“irrefutable predictions made by CLIMATE SCIENCE.” You then try moving the goalposts so that it doesn’t include any of the scientists who actually contribute to climate science! What a crock. Revelle wasn’t working on climate? Sagan wasn’t working on climate? Manabe wasn’t working on climate? Fourier wasn’t working on climate? Apparently in your little denier-fantasy world the only people working on climate are GCM programmers. Good luck with *that* theory.
Kevin asks: “….surface data is validated by the models….Huh? Where, when? I think you need new reading glasses.”
Scanning his own comments we find:
Kevin O’Neill
August 23, 2015 at 12:20 pm
“The adjustments to SST data in the past was largely a result of model output. When there is a discrepancy between models and data one has to examine the discrepancy to see which is incorrect. ” I think e can safely say the sea surface is ~70% of the overall surface. I also think my point that they are used in the surface datasets. Moreover, my point that unjustified adjusting upward is critical to raising the temperature, but more importantly disappearing the hiatus/pause.
CoRev, the adjustments were due to discrepancies between model output and observations. As I mentioned before, when this happens scientists examine to see, why? They don’t use GCMs to *validate* or *calibrate* the datasets. These are terms that have specific meanings. Nothing I said can be used to imply GCMs are used to *validate* temperature datasets. That’s not how validation works. Look it up. The calibration and validation processes are always written up.
Once again, CoRev talks out of his nether regions.
Our planet is roughly 4.5 billion years old. I think the last 150 years of (sparse) thermometer data is a cherry picked data set
Hooray for Dave! A light of logic in the forest of no logic. Just remember you just shot down the “long term data” argument.
I like this article: http://www.slate.com/blogs/bad_astronomy/2015/08/17/july_2015_hottest_july_on_record.html
“Both NASA and the Japan Meteorological Agency are reporting that July 2015 was the hottest July on record—and those records go back to before 1900.”
There’s a great picture of Republican candidates showing off their positions on global warning, too.
And, indeed, there’s even some links, but you will have to go there to get them. Can’t copy them here for some reason, probably too hot to handle.
The author says:
“Of course, the Republicans didn’t even bother discussing climate in their candidate debate. And in the meantime:
Hottest temperature records fall left and right.
Global warming is causing more wildfires, with more acres burned.
We’re losing glaciers, and at an accelerated rate.
We’re losing 13 million square kilometers of Arctic sea ice per decade.
We’re losing 450 billion tons of Antarctic and Greenland land ice every year.
We’re dumping 40 billion tons of CO2 into the air every year.
And temperatures keep going up.
When will the GOP start taking this national and global threat seriously? They’re fiddling while the world burns.”
The amazing number 40 billion tons of CO2 dumped into the air every year really catches my attention.
But what do I know?
What do you know? Is 40 billion tons big compared to what? how long for CO2 to double in the atmosphere. How much warming since the start of records.
More importantly how much of that warming can be assigned to GHGs, AGHGs, ACO2? Natural causes?
The emotion do not answer those questions.
Well, here’s what I do know:
1. I am not a climate scientist and so I cannot claim deep knowledge of the science. (I suspect you are also not a climate scientist.)
2. Every time I research a claim that seeks to prove AGW is a hoax or whatever, every time, the argument put forth by the deniers disappears like the dew in the morning sunshine. (Just like Dave citing the gigatons of CO2 cycled by the world every year. You can just start to research that fact and learn right away that that cycle is taken into account by the climate scientists.)
3. It seems the only remaining question is how serious the consequences will be.
4. It seems to me the sooner we start to develop alternative sources of energy the better off we will be, if only to resolve national security issues (military and economic) relating to the availability of oil.
5. I seem to remember something called acid rain. It was caused by coal plant emissions. Fixed those emissions. Fixed the acid rain.
A friend of mine, who is a denier, will tell you it’s all a hoax. He says, even if it’s not a hoax, he doesn’t care because he won’t be around to see it.
@anon2, all mostly good points, but irrelevant to the actual discussion.
you said: “1. I am not a climate scientist and so I cannot claim deep knowledge of the science. (I suspect you are also not a climate scientist.) Suspicion confirmed. Just a knowledgeable amateur.
2. Every time I research a claim that seeks to prove AGW is a hoax or whatever, every time, the argument put forth by the deniers disappears like the dew in the morning sunshine. (Just like Dave citing the gigatons of CO2 cycled by the world every year. You can just start to research that fact and learn right away that that cycle is taken into account by the climate scientists.) Irrelevant. 40 billions tons was an emotional response without consideration of the CO2 cycle(s).
3. It seems the only remaining question is how serious the consequences will be. And that is the crux of the issue(s). Notice Kevin’s comments re: the GCMs and failure to list the recent alarming predictions that have come to fruition.
4. It seems to me the sooner we start to develop alternative sources of energy the better off we will be, if only to resolve national security issues (military and economic) relating to the availability of oil. irrelevant and a non-issue. We probably all agree with this and that there is some anthropogenic warming
5. I seem to remember something called acid rain. It was caused by coal plant emissions. Fixed those emissions. Fixed the acid rain.
Irrelevant. Living on the E coast I know the impacts of western sources of air pollution.
Now what?
Oh man, it only gets worse for poor CoRev. Out of his depth with no adoring likeminded deniers to support him. All the flaws, faults, and logical insanities laid bare.
CoRev writes (in bold no less !!!! this must be important!!!): “And that is the crux of the issue(s). Notice Kevin’s comments re: the GCMs and failure to list the recent alarming predictions that have come to fruition.
Huh, where did “failure to list the recent alarming predictions” come from? Have you been two-timing on me and holding a second conversation with another Kevin? You asked for predictions from ‘climate science’ — I gave you a couple dozen. I even included a couple specifically from GCMs. Now, not even in response to one of my comments you bring up something completely different?
BTW – have you ever admitted you were *WRONG* when said I failed to provide predictions. In one comment you even admitted to the Manabe/Weatherwald prediction, then continued on in another post to claim I’d failed to provide any (though I had provided many).
CoRev – wrong on brightness temperature being a measure of light
CoRev – wrong on brightness temperature being a measure of infrared light
CoRev – wrong on GCMs represent the science
CoRev – wrong on satellites are more accurate than surface temperature datasets
CoRev – wrong that there’s a conspiracy to hide any pause or hiatus *CONSPIRACY* flag immediately thrown, tinfoil hat awarded
CoRev – wrong that there was a conspiracy to hide the MWP (2nd Oak Leaf cluster affixed to tinfoil hat)
CoRev – wrong that I said models were used to validate surface temperature datasets
CoRev – wrong in claiming he asked for predictions from GHE/AGW (though they were provided anyways)
CoRev – wrong in claiming he asked for successful predictions from GCMs (though they were provided anyways)
CoRev – wrong in claiming I failed to provide any successful predictions (they were provided)
CoRev – wrong in claiming GCMs are used in the surface datasets.
CoRev – wrong in believing his WFT post has any statisitical significance
CoRev – wrong in citing Hansen 1988 as model failure
CoRev – wrong in characterizing model parameterizations as ‘guesses’ (typically they are approximations due to resolution limits)
CoRev – wrong in believing that the Karl 15 adjustments affect anomalies. All major surface temperature datasets measure anomalies. What these datasets are used for is change over time. If they had lowered the old data, the trends would remain the same. And the sum total of all the adjustments is to REDUCE the trend. Calculation of *absolute* temperature is not their intended use. Absolute temperatures can still be calculated and compared using this data, but more care must be taken in making the conversion.
CoRev – wrong in failing to understand GCMs are just an analytical tool
CoRev – wrong in failing to account for D-O type events, especially regarding sea level rise (perhaps he should read Hansen’s latest and pay attention to any mention of MIS 5e since we are approaching Eemian temperature changes)
CoRev – wrong in failing to account for the collapse of the WAIS in future sea level rise
CoRev CORRECT!!! in admitting he was WRONG regarding brightness temperature
Hey, he got one right.
Excellent point. Let’s stop funding the researchers studying stress and movement along faults in the continental plates. It is kind of silly to pretend there is significance to centimeters of movement when continents have journeyed thousands of miles across the globe.
Speaking of globes, I’m throwing my globe out. It presents a cherry-picked position of the Earth’s features.
Anon
There is a natural carbon cycle. The earth naturally emits roughly 750 gigatons of CO2 per year
Anon
It’s interesting how those pesky CO2 molecules know how to cause drought in some areas and floods in others
Anon
We were promised tornadoes and hurricanes on an epic scale. We’re are the tornadoes and hurricanes?
Anon wrote: “Global warming is causing more wildfires, with more acres burned.”
How do you know this to be fact?
That description belongs to the ” Donald”himself !
Kevin O’Neill,
Just saw your comments to CoRev. I believe CoRev is saying (he can confirm) that the alarmist climate change predictions mainly come from GCMs. That’s my understanding as well. Are you denying that?
Rick, you are close to my meaning: ” I believe CoRev is saying (he can confirm) that the alarmist climate change predictions mainly come from GCMs.” I would add “and few have been confirmed in observations.” (That’s a nice way of saying they suck.) That’s why we see no list of successful alarmist predictions.
Just remember – the ‘Co’ in CoRev stands for *CONSPIRACY* — a tinfoil hat wearing nutter all the way.
“alarmist climate change predictions mainly come from GCMs”
Please, elucidate a few of them. Where are these ‘alarmist’ predictions? The earth has gone through numerous glaciations. We know what the typical change in solar insolation is based on the orbital changes. If the earth saw such big changes with relatively small changes in solar insolation – doesn’t that mean that it must be sensitive to *small* changes? So, based on paleo evidence, what is the likely ECS? If the earth is insensitive to small changes, then how did these glacial episodes keep occurring in sequence with orbital changes? Pure coincidence? Hmm …… deniers never want to talk about paleo data. That’s where the scary bogeymen live. And throws all thoughts of really low ECS right out the window.
Rick – I have no idea what he’s claiming half the time. His *original* request was for predictions from “climate science” – that morphed two or three times. He’s never presented any alarmist predictions from anywhere – in fact the word ‘alarmist’ has been mostly absent in our discussion. So until he presents some of these nefarious alarmist predictions I really don’t know what he’s talking about.
Under even moderate forcing GCMs produce some *very* alarming projections. But just because they’re ‘alarming’ doesn’t make them ‘alarmist’ – there’s a pretty big difference in the two words. I find it alarming that scientists believe the WAIS is now beyond saving. Saying that is merely repeating the best science we have today. Doesn’t make it alarmist.
The same goes for the higher end of GCM temperature projections. Yes, they are alarming. No, they’re not alarmist. It’s just science and model output. If one were to pretend that only the high-end results are possible, that would be alarmist. Just as those that believe we’ll somehow magically stop CO2 emissions without actually doing anything *to* stop them are being Pollyannas.
The arctic ocean has probably not been ice free in 45 million years. When I started paying attention to it 25 years ago it was believed by some scientists that it could disappear sometime in the 22nd century. Then 2100. Then 2070. Then 2050. And now you have serious scientists that believe it could be ice-free by 2030 and ‘virtually ice-free’ in the next few years. In hindsight *every* arctic scientist was a Pollyanna 25 years ago. We needed a few alarmists. Because the situation has quickly become alarming.
While the arctic doesn’t get the attention the global temperature datasets do, the arctic, due to polar amplification – one of those GHG theory predictions CoRev ignores – is the canary in the coal mine. Science is inherently conservative. Generally that has served the scientific method quite well. But we’ve never – the earth has never – seen change at this pace in many respects. With events happening so quickly we may rue the fact that scientific reticence prevents many scientists from stating clearly and openly what many of them believe privately.
My recommendation for more than a decade now is tell your kids and grandkids to buy land in Canada, close to a Great Lake and away from the coasts 🙂
Dear Menzie,
It would be difficult to draw the diagram, but you may want to put in a circle for China bashers also. I don’t follow Trump – RG 3 is more than enough soap opera for me – but is he applauding the recent anti-dumping tariffs imposed on Chinese specialty steel?
Julian
We have seen in one comment string Kevin McNeil epitomizing the Gish Gallop
BTW – have you ever admitted you were *WRONG* when said I failed to provide predictions. In one comment you even admitted to the Manabe/Weatherwald prediction, then continued on in another post to claim I’d failed to provide any (though I had provided many). — Kevin to his credit provided a list of scientists and their findings/predictions which supported and expanded the GHE/AGW science hypothesis. None were contested, as I had said the the hypothesis was not an issue: ” ” As for Manabe’s stratospheric finding, it was written in 1967, but Kevin insists: “That said, models can often tell us when *data* is bad. The stratospheric temperature cooling mentioned above took almost a half-century to confirm.” 2015 minus 1967 is 48 years. Stratospheric cooling was confirmed by the satellites much, much earlier. In Kevin speak it was confirmed two years from now.
But alarmists like to argue strawmen: “To overthrow the consensus theory of GHG warming one would need a fundamental revolution in one of the associated sciences – fluid dynamics, chemistry, radiative physics, chemistry, etc. How much straw does it take to make a strawman? Oh and don’t forget the inevitable exaggeration(s)
CoRev – wrong on brightness temperature being a measure of light — Not my term introduced by Kevin Strawman
CoRev – wrong on brightness temperature being a measure of infrared light — Not my term introduced by Kevin Strawman
CoRev – wrong on GCMs represent the science — Kevin admits GCMs use/represent/consist of some of the science. ”
Kevin O’Neill August 23, 2015 at 1:22 pm CoRev –
Kevin O’Neill
August 23, 2015 at 1:22 pm
CoRev – *some* of the science is represented in GCMs. Some, and only some. Some, and only some” I even agreed and defined the expanded models use parameters developed by the science. So again in Kevin speak “*some* of the science is represented” is equal to ALL or NONE depending upon which side of the mouth her is speaking. Another strawman argument
CoRev – wrong on satellites are more accurate than surface temperature datasets — Kevin believes one paper which was accepted and tested by the data managers with a conclusion that some MINOR future update was appropriate. In Kevin speak the paper is 100% accurate. Another exaggeration.
CoRev – wrong that there’s a conspiracy to hide any pause or hiatus *CONSPIRACY* flag immediately thrown, tinfoil hat awarded — Explain why it not a valid concern.
CoRev – wrong that there was a conspiracy to hide the MWP (2nd Oak Leaf cluster affixed to tinfoil hat) — Kevin want us to believe there is/was not controversy over the Hockeystick’s removal of the MWP. He then, in a laughable argument with himself, and really goes off the deep end of strawman argumentation. I didn’t follow the contorted logic he used on himself to make any point.
CoRev – wrong that I said models were used to validate surface temperature datasets — I actually quoted his comment. He adds straw to the argument by insisting he did not use the term “validate”. Another strawman argument.
CoRev – wrong in claiming he asked for predictions from GHE/AGW (though they were provided anyways) — Conceded. Kevin did provide some predictions. The only one I verified was another exaggeration. Kevin claimed 50 years to confirm when the referenced paper isn’t yet that old? Huge exaggeration.
CoRev – wrong in claiming he asked for successful predictions from GCMs (though they were provided anyways) — Never provided. Huge exaggeration.
CoRev – wrong in claiming I failed to provide any successful predictions (they were provided) — Repeating the same issue doesn’t change the original. 50 years to confirm when the referenced paper isn’t yet that old? Huge exaggeration.
CoRev – wrong in claiming GCMs are used in the surface datasets. — Wrong. I even provided his own quote: ” “The adjustments to SST data in the past was largely a result of model output. ” So in Kevin speak adjusting from model output, is not validating using the models, or rewrite his own statement in the context of his claim: “GCMs are (not) used in the surface datasets” Huge exaggerations and strawman argument all in one.
CoRev – wrong in believing his WFT post has any statisitical significance — Not my term introduced by Kevin Strawman
CoRev – wrong in citing Hansen 1988 as model failure — Strangely Kevin explained why and how the Hansen predictions were wrong. Not my term introduced by Kevin Strawman.
CoRev – wrong in characterizing model parameterizations as ‘guesses’ (typically they are approximations due to resolution limits) — Kevin was desperate not to show creation of the approximations used the available science. Another strawman argument and Not my term introduced by Kevin Strawman.
CoRev – wrong in believing that the Karl 15 adjustments affect anomalies. All major surface temperature datasets measure anomalies. What these datasets are used for is change over time. If they had lowered the old data, the trends would remain the same. And the sum total of all the adjustments is to REDUCE the trend. Calculation of *absolute* temperature is not their intended use. Absolute temperatures can still be calculated and compared using this data, but more care must be taken in making the conversion. I never said the adjustments changed the anomalies. Can anyone figure out how: “All major surface temperature datasets measure anomalies.” I always thought they were calculated. (Bet we do not see admittance of an error.) Not my term introduced by Kevin Strawman.
CoRev – wrong in failing to understand GCMs are just an analytical tool — Not my term introduced by Kevin Strawman.
CoRev – wrong in failing to account for D-O type events, especially regarding sea level rise (perhaps he should read Hansen’s latest and pay attention to any mention of MIS 5e since we are approaching Eemian temperature changes) — Not my term introduced by Kevin Strawman.
CoRev – wrong in failing to account for the collapse of the WAIS in future sea level rise — Not my term introduced by Kevin Strawman.
There is a trend in Kevin’s argumentation that is obvious in the last few claims. He introduces his own terms into the argument and then wishes to continue arguing on those new terms. — That’s classical strawman argumentation. Add to the strawman argument the Gish Gallop of burying the reader with useless trivia. There is another more subtle trend, which is to exaggerate claims. This is a common argument type used by alarmists. They hope their comment will not be researched due to laziness or intimidation. Intimidation is the third argument type used. His ad hominem attacks use snark, name calling, sarcasm, and they are also quite common from the alarmist set.
There is always a clue as to the strength of someone’s scientific arguments. Check how many specific references are provided to research and confirm their claims. Kevin provides precious few. Without references it is just personal opinion. Not science. And should always be treated with cynicism and not just skepticism.
Was there an meat in the many words of scientific sounding rubbish we got from Kevin? Yes. A brief listing:
1) the models represent *some* of the science. But because they can not implement *all* the science they can not be used to predict.
2) His only almost contemporary prediction, Hansen’s 1988, is wrong and he provided the reasons why.
3) Those very same incomplete and inaccurate models have been used adjust the sea surface data in the surface datasets.
4) These very same surface dataset, requiring immense efforts to create and undergoing nearly monthly adjustments are some how better than the satellite dataset that require adjusting far less frequently.
5) These very same surface datasets do not show the hiatus/pause so it does/can not exist. But it is in the satellite dataset and was in the surface datasets until the latest major adjustment in June. I’m getting tired so I will quite now.
Let’s wait on Kevin’s next response to this comment, and see if we can find any new alarmist commenting tricks or just doubles down on his previous examples..
I think you should read this article: http://link.springer.com/article/10.1007/s00704-015-1597-5
Here’s the abstract:
“Among papers stating a position on anthropogenic global warming (AGW), 97 % endorse AGW. What is happening with the 2 % of papers that reject AGW? We examine a selection of papers rejecting AGW. An analytical tool has been developed to replicate and test the results and methods used in these studies; our replication reveals a number of methodological flaws, and a pattern of common mistakes emerges that is not visible when looking at single isolated cases. Thus, real-life scientific disputes in some cases can be resolved, and we can learn from mistakes. A common denominator seems to be missing contextual information or ignoring information that does not fit the conclusions, be it other relevant work or related geophysical data. In many cases, shortcomings are due to insufficient model evaluation, leading to results that are not universally valid but rather are an artifact of a particular experimental setup. Other typical weaknesses include false dichotomies, inappropriate statistical methods, or basing conclusions on misconceived or incomplete physics. We also argue that science is never settled and that both mainstream and contrarian papers must be subject to sustained scrutiny. The merit of replication is highlighted and we discuss how the quality of the scientific literature may benefit from replication.”
Anon2, again, where do I say AGW is not real? This strawman argument arises almost every time a skeptic comments. What is and has been the core of the arguments almost from the beginning, is how much warming is natural and how much from anthropogenic causes? Of course the fundamental issues surrounding how can warming be bad when we’ve experienced it for the past 135-150 years with a history of its effects.
BTW, if phrased correctly I would be surprised to find even 2% who did not believe in AGW. If you read the RC article on it you would find this paper was rejected multiple times in multiple journals until they found one that would accept it.
There are other issues with this paper if you insist on discussing it. I really don’t care to.
I’m glad we agree.
CoRev – if you like I’ll take apart your whole list- cuz it’s nonsense. But let’s do this one at a time.
So let’s start with one of the cherries; you wrote above, “CoRev – wrong in claiming he asked for successful predictions from GCMs (though they were provided anyways) — Never provided. Huge exaggeration.”
Your point was no successful predictions. First you wanted one from climate science. I gave you two dozen from climate science. Then you wanted one from GHG/AGW theory. I’ve given you those as well. And then you changed it to GCMs.
Manabe and Weatherald 1967. Stratospheric cooling prediction. This prediction came from …. their GCM. It was confirmed in 2011. 44 years later. Excuse me for rounding, but I don’t think my ‘exaggeration’ negates the fact that I gave you Manabe and Weatherald and it actually met all your morphing, moving the goalpost criteria.
But you say ‘never provided, huge exaggeration’ LOL
Are you claiming I*didn’t* provide Manabe and Weatherald? Are you claiming M&W didn’t contain the stratospheric cooling prediction? Or is it (my bet) that your knowledge of the subject only comes from denier sites and that you’ve never read Manabe & Weatherald? Knowledge so superfical that you didn’t even know that Manabe and Weatherwald was a GCM paper — the paper cited by many as *the* most important paper in climate science. LOL
Whatever the reason, were any of your many claims upthread correct when you said I didn’t provide any successful predictions? And after all that you still include the claim in your summary. Ignorance is one thing. Persisting in being wrong after you’ve been informed is stupidity. You are the poster-child for Dunning-Kruger.
Oh, and rounding 44 years to 50 is a ‘huge’ exaggeration. LOL
After you’ve admitted all your claims about predictions are wrong I’ll tear apart the next pointless point.
KTO
Kevin, climate alarmism relies on exaggerated claims. Refer to my long list in the response to Kevin earlier. Kevin’s latest example is after being caught exaggerating the M&W paper, he doubled down and picked one of the latest papers as his benchmark for confirming M&W and calculating how long it took to confirm their findings.
Kevin conveniently ignores all the Ozone studies in the 70s on and the earlier papers discussing GHGs’ effects in the stratosphere in the 90s and early 00s. Exaggeration is needed to convince themselves (and any others not so convinced) that climate is controlled by a single molecule. Climate change is that simple?
To prop up his own inadequacies to calls others names, and describes them with “The Dunning–Kruger effect is a cognitive bias wherein relatively unskilled individuals suffer from illusory superiority, mistakenly assessing their ability to be much higher than is accurate. This bias is attributed to a metacognitive inability of the unskilled to accurately evaluate their own ability level.” https://en.wikipedia.org/wiki/Dunning%E2%80%93Kruger_effect
Often they claim others are using the very same methods they rely upon, cherry picking, ignoring evidence presented, sarcasm or just plain ignorance. By doing this they hope to intimidate or wear their target out. But, there are always tip offs. I Mentioned one earlier, the failure to provide a reference.
I was waiting for Kevin’s response to see if he tried some new method, but alas, his bag of tricks may be empty.
CoRev – your claim was that no predictions were provided.
Is that claim true – or were you wrong?
Kevin, my first comment re: predictions asked this: “Menzie et al who blindly believe in the GW/AGW hypothesis, can you give us brief list of the correct irrefutable predictions made by climate science? ” So in that context I do believe you provided *some* out of the several you provided.
I did learn a lesson from you. Be more precise in my wording of requests. My intent was clearly focused on modern era predictions with all the dialog about models.
CoRev – you then later asked for successful predictions from GHE/AGW – did you not receive those?
CoRev – you then later asked for a success prediction from GCMs – was it provided?
This is why I consider you insane. You cannot admit the reality that is in front of you. Look at your claims for prediction in this thread. You kept harping on about successful predictions, yet they were there all along. Your requests were met in the first series of predictions I posted. Whether it be ‘climate science,’ whether it be from GHG/AGW theory, or whether it be from GCMs – all were included in that batch of science history I posted. But even now you simply cannot admit you were wrong.
Yet even two days ago you still said, “CoRev – wrong in claiming he asked for successful predictions from GCMs (though they were provided anyways) — Never provided. Huge exaggeration.” Yep, just two days ago you were still saying NEVER PROVIDED – yet Manabe and Weatherald was a GCM specific prediction and was included in the very first set of predictions I offered you.
Your request keeps morphing. Everytime it’s met you go one step further. First it was climate science, then it was GHG/AGW theory, then it was GCMs, now it’s ‘contemporary’ predictions. Do you see a pattern here? Everytime you’re shown to be wrong you change the subject to something else.
BTW – what exactly is a contemporary prediction? A prediction is a statement about the future. If the statement is contemporary, then we would have to wait until the future arrives to see if the statement was true. I.e., no ‘contemporary’ prediction can ever be proved true until the future arrives. The only predictions we can verify *today* are those statements that were made in the past. This is especially true of climate where 30 years is the *minimum* accepted timeframe to define trends, baselines, etc. And statistical significance doesn’t even kick in until 17 – 20 years.
In other words, you have embarked down a road of nonsense. In effect you are saying predictions made in the past that have come true don’t count.
You want a ‘contemporary’ prediction – and another case of models being right and observations being wrong? From the headlines earlier this year: “IPCC climate modelling proves right as scientists find a glitch in satellite led to inaccurate records in 1990s suggesting rate of sea level rise was slowing” or as another article on it said, “The analysis found and corrected small inaccuracies in the existing satellite data, with results published today in Nature Climate Change.” Full paper: ‘Unabated global mean sea-level rise over the satellite altimeter era’
May of 2015. Contemporary enuf for ya? Oh, and another error in satellite data to boot.
So should we count this as you being wrong 4 times?
1) climate science predicitions
2) GHG/AGW theory predictions
3) GCM predictions
4) ‘contemporary’ predictions
Or lump all your morphed prediction claims and count it just as one?
CoRev – wrong on brightness temperature being a measure of light — Not my term introduced by Kevin Strawman
CoRev – wrong on brightness temperature being a measure of infrared light — Not my term introduced by Kevin Strawman
Ahem …. I had to introduce ‘brightness temperature’ because you didn’t know what satellites actually measure when they produce a temperature dataset. You thought they were measuring light. Then you claimed they were measuring infrared. ‘Brightness temperature’ is the term scientists use to describe what they’re measuring. To show you that you were WRONG I had to introduce the correct term – as opposed to “light” or “infrared”
So, CoRev makes an incorrect claim (satellite temperatures are based on measuring light). He then doubles down by making a 2nd incorrect claim (satellite temperatures are based on measuring infrared light). To correct him I inform him of the correct measurement – brightness temperature, which is microwave radiation intensity as measure with a passive antenna on an orbiting platform in space. Now, where’s the strawman? A strawman is arguing against a position the opponent never made. In this case CoRev made two clearly incorrect claims. Brightness temperature isn’t a strawman – it’s the correct answer (as opposed to CoRev’s TWO incorrect answers!!!
Another logical fail from our Conspiracy Reverend. In fact, I believe he’s used the term ‘strawman’ incorrectly in every usage on this thread. Color me surprised 🙂
Kevin, still nothing new out of the bag? I was wrong and admitted it. That’s what critical thinkers do. Others do/can/will not because their ego is too involved.
You know how many times I’ve seen some one constantly using strawman arguments say that’s not a man of straw argument. Its usually because I didn’t bite an follow the bait. As you so clearly point out with “brightness temperature”.
I do admit I think you have now added a new approach — diversion to the tool bag.
CoRev – do you not understand that when you said satellite temperature measurements are measuring light, you were saying brightness temperature is a measure of light? I don’t deny I introduced the term because it is the *correct* term. Since when is using the correct scientific terminology a diversion?
Satellite temperature measurements (RSS or UAH) are brightness temperature measurements. In this context he two terms – satellite temperature measurement and brightness temperature measurement – are equivalent. Since they are equivalent, they can be freely substituted without changing the meaning, but since you DID NOT know what satellites actually measured I supplied the term for you.
How is this a diversion? How is this a strawman argument? It directly addressed you’re incorrect claim that they measured light. So when I said,
CoRev – wrong on brightness temperature being a measure of light
CoRev – wrong on brightness temperature being a measure of infrared light
Why did you respond with, ” — Not my term introduced by Kevin Strawman” ???
My claim was a direct statement of the facts. You were wrong that brightness temperature (satellite temperature) is a measure of light.. Your response was the only diversionary tactic.. Obviously you felt a need to respond, but since you were admittedly wrong, all you could do was divert by implying it was a strawman argument when it was directly addressing your earlier claim.
CoRev wrote: “CoRev – wrong that I said models were used to validate surface temperature datasets — I actually quoted his comment. He adds straw to the argument by insisting he did not use the term “validate”. Another strawman argument.”
Do you actually think? I did not use the word “validate” and *NOTHING* in the quote you supplied could be construed to mean validate. So you built an argument around *validation* – a term and a process I never used or hinted at. That *IS* a strawman argument. It’s practically the dictionary definition of one. You simply cannot comprehend reality.
The sea level articles above are cite an almost exact parallel to the argument I made. Models and observations differed.. Scientists examined the situation and found an error in the satellite data. They then adjust the satellite data to correct for the error. Now – is that model *validation*? Is that satellite *validation*? No. It’s correcting an error. *Validation* is a specific process and GCMs are not used to perform *validation* on surface temperature datasets.
In the case of brightness temperature I introduced the term so that you could look it up and see what satellite temperature measurements are really all about. Brightness temperature is the correct scientific term for the measurement. In this case you’ve introduced *validation* – but are using it completely incorrectly and then claiming *I* used it when I never did. I’m smarter than that. I know what calibration and validation actually entail. You, by your own admission, need to learn to use words properly.
CoRev wrote:”CoRev – wrong in claiming GCMs are used in the surface datasets. — Wrong. I even provided his own quote: ” “The adjustments to SST data in the past was largely a result of model output. ” So in Kevin speak adjusting from model output, is not validating using the models, or rewrite his own statement in the context of his claim: “GCMs are (not) used in the surface datasets” Huge exaggerations and strawman argument all in one.”
Again, you don’t even know what a strawman argument is.
I’ve already addressed the first part of your quote. But let’s look at this second rehash (talk about repeating yourself).
You say, “So in Kevin speak adjusting from model output ….” ‘result of’ does not equal ‘from’, nor does it equal ‘validation’.
Again, this *IS* a strawman argument you are making. You leave out the next sentence where I even clarify, “When there is a discrepancy between models and data one has to examine the discrepancy to see which is incorrect.” I even added that most of the time it’s the model that’s incorrect. But I never said anything about how the adjustments were made or what the scientific basis was. So you built an argument, a strawman argument, by putting words in my mouth saying the surface temperature datasets were adjusted *from* model output. They are not. And the words I used were ‘as a result of’ – not ‘from’.
I would never claim they were because I’ve read the papers that describe the process behind every adjustment made to the datasets. I know how homogenization works. I know why TOBS is important. I’ve seen the slight adjustments due to UHI. I’ve read all the papers. These adjustments are not *from* model output. Model output was just the clue that told them they maybe should take a look. Yet you built a strawman argument around it and (apparently) don’t even realize it.
So we have here again another *actual* strawman argument. Are you seeing a pattern? You claim that I’m making strawman arguments when in reality it is you. I apologize if English isn’t your native language – but you really need to learn the language better.
My latest observation of Kevin’s approach was and continues to be diversion. Notice all the commentary about straw in his latest set?
Also remember his insistence that he did not claim that models are used to *validate* (just some synonyms) “attest, confirm, corroborate, document, substantiate, test, proof, witness) the datasets? I even provided his own quote. Now, he provides three references claiming the satellite sea level rise was adjusted proving the model outputs superior: “You want a ‘contemporary’ prediction – and another case of models being right and observations being wrong? From the headlines earlier this year…” What followed was 3 references, two from journalists articles and the final to the scientific paper’s abstract, but all referenced that one scientific paper. Even when denying his own claim, he verifies his opinion, models are superior, and ?NOT? used to validate the surface datasets.
So let’s look at his 1st reference. From it we have this: “Records from tide gauges and satellites have shown sea level rise slowing slightly over the past 20 years. But as the ice sheets of West Antarctica and Greenland shed ever more water into the ocean, climate models show it should be doing the opposite…”
and
“Professor Jonathan Gregory from the University of Reading and a lead author of the IPCC’s most recent climate report said the study was “interesting and useful” and shored up the predictions of the models.”
and
“In 2013, Gregory’s report to the IPCC predicted that sea level could rise between 28cm and 98cm by 2100 depending on how much carbon human industry emits this century.”
To recap Kevin’s positions on models, he claims they do not represent the science, because they are incomplete implementations of (list of weaknesses), and they do not predict nor validate. But when he is pushed to provide references they discredit/disprove his own claims. They are used (as he insists) as a tool to compare/*not validate*/verify/etc. the satellite data used in the surface datasets. And, the latest IPCC Report used them to predict</b.
In context, Menzie wanted us to believe because "the Donald" said it, Global Warming was not a hoax. He has yet to support his contention — not a hoax. Nearly everyone knows most recent climate predictions have been erroneous. I could provide a long list here, but asked for those believing in Global Warming to do so. Admittedly my phrasing could have been tighter as Kevin has so prolifically shown.
Which brings me to Kevin’s participation. He has been all over the place as I showed above with both the science and the models. He also has failed to support the claim of hoax or not.
In three articles in the past few days Menzies claim “not a hoax” is not supported.
Diversion.
Notice the point was: Did Kevin use the word ‘validate’ or imply that models are used to *validate* surface temperature datasets?
No, so CoRev MADE UP an argument that was never being presented. This is what is called a strawman argument.
*Validation* is a specific type of test used in climate science. Just as *calibration* is a specific type of test. CoRev obviously doesn’t realize this – if he did he would know that GCMs are NOT used to perform validation on surface temperature datasets.
Kevin, your arguments are getting weaker. All that test in my comment and you returned to your specific meaning of *validate/not validate*? Why all the diversion and straw? Why all the angst over your methods being outed? So let’s be clear. I used the term *validated* in its plain english sense. You introduced the Kevin speak definition, and then argued about it. Classic strawman, exaggeration over its impact, and diversion all in one example.
CoRev – we’re talking about *science* – and anyone familiar with GCMs and surface temperature datasets knows that these are *validated*.
Now you claim a ‘plain English’ meaning. Sorry, that might have been true except you are bringing that excuse very late to the party. Not to mention you said the data was adjusted *from* GCMs.
Now, if you want to admit that surface temperature data is NOT validated by GCMs – which were the words you tried to put in my mouth – then go ahead and admit it. For instance, Cowtan & Way have an entire section on *Validation*. It’s section four in their paper, “Coverage bias in the HadCRUT4 temperature series and its impact on recent temperature trends.” Perhaps you can point out where they adjusted the data from GCMs. Hint: ain’t nuthin in there about GCMs.
corev, still waiting for you to justify the hiatus in light of observed sea level rise and increasing ocean heat content. they do not appear to be consistent phenomena, at least according to the arguments you present.
Well, look who revives an old argument. Nope! Not gonna bite. Since you so strongly believe in the value of the models, here’s what they say for OHC.
http://wattsupwiththat.com/2015/08/26/climate-models-fail-global-ocean-heat-content-based-on-toa-energy-imbalance/
This is the range from those models you find so helpful https://bobtisdale.files.wordpress.com/2015/08/figure-62.png
The article goes on to say this:
“The models with the high positive imbalances and with the negative imbalances are obvious outliers. They create incredible (but not in a good way) ocean heat content curves that should probably be considered implausible. See Figure 7. Yet they are among the models used by the IPCC for their 5th Assessment Report. Then again, if we were to eliminate models because they didn’t simulate some metric properly, there would be no climate models left in the CMIP archives.”
Figure 7 referenced above
https://bobtisdale.files.wordpress.com/2015/08/figure-73.png?w=720
This is an example of why CoRev is bonkers. Seems his citations usually come from other nutters. WUWT and Bob Tisdale two of his favorites. Here he gives us a two-fer, Tisdale writing a guest post at WUWT. What do you expect when you go to anti-science sites? You get skewed anti-science information. Duh? More important, the nutter sites attract other nutters – so the echo chamber of applause usually lacks any skeptical criticism. If you like sheer nonsense, read the comment section of the WUWT article CoRev cites. (Climate Models Fail: Global Ocean Heat Content (Based on TOA Energy Imbalance, by Bob Tisdale, at WUWT)). At the time of my reading there were 153 comments. And by my count only two intelligent comments – both written by NicLewis.
Tisdale is not a scientist. Tisdale makes simple beginner mistakes. Tisdale confuses data products as often as other people change their socks.
This is why CoRev makes so many simple mistakes – he gets his source material from nutters. Has CoRev analyzed and verified Tisdale’s article? No. Does he accept it as ‘truth’ ? Yes. So much for skepticism. LOL
There are dozens of articles on the web laughing at Tisdale’s ‘analysis’ – it’s like shooting fish in a barrel. Tisdale is so far off his rocker that scientifically literate people just ignore him – they don’t even bother to read his latest nonsense, unless they just want to have a little sport making fun of the latest denier nonsense. He’s always an easy target.
Man, Kevin, will/can you not learn? All the snark and name calling without one itty bitty reference. This is especially telling: “There are dozens of articles on the web laughing at Tisdale’s ‘analysis’ – it’s like shooting fish in a barrel.” To save the inevitable google find, I’m looking for the dozens citing and laughing at the specific reference I provided.
Y’ano, you can’t stifle debate by exaggerations. Without those dozens of references, then we have another clear example of even more exaggerations.
” To exaggerate:
verb (used with object), exaggerated, exaggerating.
1. to magnify beyond the limits of truth; overstate; represent disproportionately:
to exaggerate the difficulties of a situation.
2. to increase or enlarge abnormally:”
http://dictionary.reference.com/browse/exaggerate
I might add, when done repeatedly, it might take on another connotation. One I have yet to use.
Its alwasy interesting to see the responses re: a WUWT reference from a subset of the commenters. That subset clearly is familiar with the site, and in me usually elicits this thought: Wonder when he/she was banned for trolling there?
CoRev – Sou at Whopper says it short and succinctly:”Perennially puzzled Bob Tisdale is a bit of a nutter. He doesn’t accept that carbon dioxide, water vapour and other gases like methane absorb long wave radiation and prevent earth from turning into a block of ice. ”
Bob Tisdale rejects the greenhouse effect (again)
This is the nutter you want to use as a reference. A man who denies the GHG effect. I.e., basic physics, something I can demonstrate in a lab any day of the week. He’s also employed sock puppets. But there’s more – much, much more. I won’t even cite the articles where he gets brought up and ridiculed in the comment section – just the articles that mention him. Most of them centered on his insanity.
The Bob
Obviously – What? Bob Tisdale on Global Mean Surface Temperature Trends
Try to Argue With This, Warmists
Bob Tisdale’s Latest Conspiracy Theory on Ocean Heat
Fundamental Differences Between Bob Tisdale and Reality
Bob Tisdale is Wrong
Elegant Terns move house when it gets too hot, and Bob Tisdale tries to cover it up @wattsupwiththat
Bob Tisdale goes AMO-ing to a big chill – not!
The Joke’s on Bob Tisdale! His papal mockery falls flat in a sea of solar panels in The Vatican, World’s Greenest State.
CO2 is at 400 ppm and rising – and Bob Tisdale thinks we can reduce it easily!
A short pause: Bob Tisdale thinks climate models are weather forecasts of the Northern Hemisphere
Bob Tisdale sez “I knew that” ‘cept he didn’t
Bob Tisdale Pisees On Leg, Claims It’s Raining
Biased Bob Tisdale Is All At Sea
New GISS Data
Ship of Fools
Open Letter to Jon Stewart – The Daily Show
Pielke Sr. Misinforms High School Students
He Knows Not What He’s Doing
Watt Is Bob Doing?
Favorite Denier Tricks, or How to Hide the Incline
Five Years
Are Gulf Of Mexico Sea Surface Temperature Anomalies Near To Record Levels?
Plus ca change
<a href="https://tamino.wordpress.com/2011/01/30/amo/"AMO
Tisdale Fumbles, Pielke Cheers
Sea Level Rises … Tisdale Falls
A Couple of Basic Questions for Bob Tisdale
A Challenge From Bob
A blatant fiddle in the D’Aleo/Watts SPPI report
Global warming and step functions
OK, that’s enuf for now.
CoRev – I said there are dozens of articles laughing at Tisdale.
You then change this to ‘the dozens citing and laughing at the specific reference I provided”
“The straw man fallacy occurs in the following pattern of argument:
Person 1 asserts proposition X.
Person 2 argues against a false but superficially similar proposition Y, as if an argument against Y were an argument against X.”
You have now made a strawman argument because you are now arguing against a position I never took. In fact, you have used the term ‘strawman’ over 30 times in this thread. I don’t believe you’ve used it even once correctly.
You claim exaggeration. Below I have listed 31 articles making fun of Tisdale. That’s by no means comprehensive. Now, was it an exaggeration – or are you WRONG again?
What do you call people – like yourself – that are constantly wrong?
Wow! Even though I cautioned Kevin that unless his references actually referenced the specific article, they would be consider more exaggerations, and I might add an indication of how weak and desperate are his arguments He did exactly that. Moreover his first reference is to exactly one of those banned for trolling WUWT. Kevin when were you banned?
You went back to the validation question? Nope! Not going to follow you. G’day, Kevin.
CoRev – I claimed that there were dozens of articles making fun of Tisdale. I have listed over 30.
You said I was exaggerating.
Did I not provide over 30 articles making fun of Tisdale? Was I exaggerating?
Your request for dozens of articles making fun of the specific reference was not my claim. I.e., you created a straw man.
Now, what does being banned from a website have to do with anything? It’s a DIVERSION. Am I banned at WUWT? I wasn’t last time I checked – but being banned on a nutter site is hardly going to cause me to lose sleep and is more a badge of honor than something to be ashamed of. WUWT promotes anti-science nonsense (Tisdale) . But your DIVERSION doesn’t even work to your advantage.
Go look at past articles on the USS Skate ‘surfacing at the North Pole” in 1958/59. Lunatics like Steve Goddard and Anthony Watts actually *believed* that the USS Skate surfaced in open water at the North Pole in 1958/9. I have pointed out to them many times that this is incorrect. To this day they have only half-assed admitted they were wrong. They have in most instances kept an inaccurately dated photo from a non-official source with their articles. In most instances they are unwilling to go back and correct their stupid articles that got the whole Skate at the North Pole story WRONG! In fact, deniers went to great lengths to try and prove their 1958 photo of the Skate at Ice Station Zebra was legitimately of the Skate at the North Pole in 1959. They even claimed *CONSPIRACY* (surprise) when the non-official source corrected the inaccurate date.
I’m not going to go to great lengths to dredge up all the times they have repeated these incorrect claims vis a vis the Skate, but here’s a few:
Ice at the North Pole in 1958 and 1959 – not so thick
Submarines In the Winter Twilight
Sea Ice News Volume 3, #2
Now, I have pointed out to AW and SG that these articles on the Skate are incorrect. I have a copy of “Surface At The Pole: The Extraordinary Voyages of the USS Skate,” by Vice Admiral James Calvert, USN (McGraw-Hill, 1960). I have quoted at length the accounts of the Skate per her captain in his 1960 book. I have also directed both AW and SG to the *actual* photos from the book. Yet, many of their incorrect claims stand without being updated. Why? Because they prefer their version of reality. Kind of like you 🙂
I even took the time to write this up as a blog post: Zombie Lies – the USS Skate
Now, if stating the truth and asking others to correct wrong information gets me banned from WUWT, I’m surely not apologizing for it.
corev, not gonna bit, eh. it is not a fishing expedition. observed sea level has continued to rise. through many depths, the ocean temperature has continued to rise-that is rising heat content. these are from the measurables. so again, we have 2 measurable phenomena contradicting your hiatus theory. and your response is, not going to discuss the question. i know your ideology rests on the hiatus, but why are you not open to how this sea level and heat content data fit into the picture? they indicate a global hiatus does not exist.
Sorry, in my earlier post I incorrectly stated, Ice Station Zebra” – meant Drift Station Alpha. I watch too many old movies 🙂
Oh wait – I just found out that I ‘exaggerated’ CoRev’s use of ‘strawman’ — he only used ‘straw’ or ‘strawman’ 27 times. I inadvertently doubled counted some of his words when they appeared in *my* quotations of him. So his use of the phrase appears in the thread over 30 times, but some of those are due to my quoting his words.
Meanwhile, still crickets on the MWP. Ya know, the one climate scientists around the world have conspired to disappear. Still waiting on that global reconstruction that shows a MWP. It can’t be that none existed – cuz that would mean CONSPIRACY REVEREND was all full of hot air. And what would be the odds of that? LOL