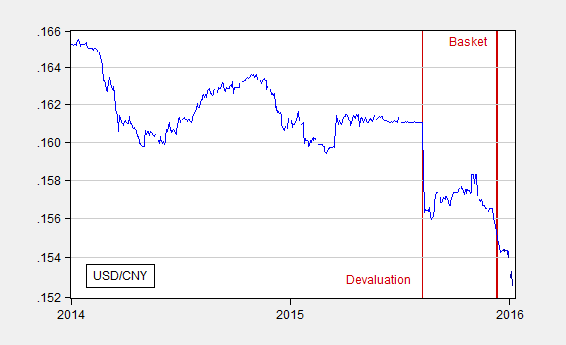
As the CNY depreciates, just a quick note for perspective.
Figure 1: USD/CNY, log scale (blue). Source: FRED through 12/31, Pacific Exchange Services.
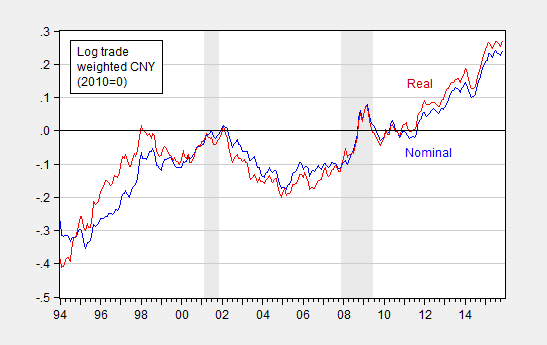
As the Chinese economy continues to slow (at least apparently), a lot of attention has centered on the Yuan’s course; the depreciation against the dollar shouldn’t obscure the fact that the CNY remains fairly strong on a trade-weighted basis.
Figure 2: Log nominal trade weighted CNY (blue), real (blue), 2010=0. NBER defined recession dates shaded gray. Source: BIS, NBER, author’s calculations.
Since the series is plotted in log terms, one can read off the difference in values at two times as a percentage change. Over the past year, the real CNY has risen from 0.13 to 0.27, implying a 14% appreciation against China’s trading partners’ currencies.


It’s actually a continuation of the great rollback of the developed market buildup of foreign reserves:
http://tinyurl.com/z3nhy52
At the moment, this is the most important chart in the world and explains a lot.
Note that the great commodity price debacle of 2014 (including especially crude oil) began in mid-to-late summer, shortly after China’s Forex Reserves peaked and rolled over with outflows. I think that there are a lot of theorists who believe that the stock of Quantitative Easing and stock of Foreign Reserves matter more than the flows, but to me – and more importantly to global markets – flows are what matter.
It’s not surprising a slowing economy can result in capital outflows and less demand for oil.
My take on this, over at CNBC.
http://www.cnbc.com/2016/01/08/china-might-be-succeeding-in-fixing-its-economy-commentary.html