Today we are fortunate to present a guest contribution written by Yin-Wong Cheung (City University of Hong Kong), Sven Steinkamp (Universität Osnabrück) and Frank Westermann (Universität Osnabrück).
After 7 years of highly expansionary monetary policy, the Federal Reserve Bank is expected to pursue a new policy stance, which was signaled by its first increase in interest rates in last December. Side effects of this new policy are a reason of concern for policymakers worldwide, in particular in emerging markets with free movement of capital. In this column, we argue that also economies with managed or closed financial accounts may be affected. Focusing on the case of China, we show in a new research article (Cheung, Steinkamp and Westermann, 2016) that illicit capital flows, which at times are as large as the official ones, have been responding to the US monetary policy since the beginning of the 2007/8 global financial crisis.
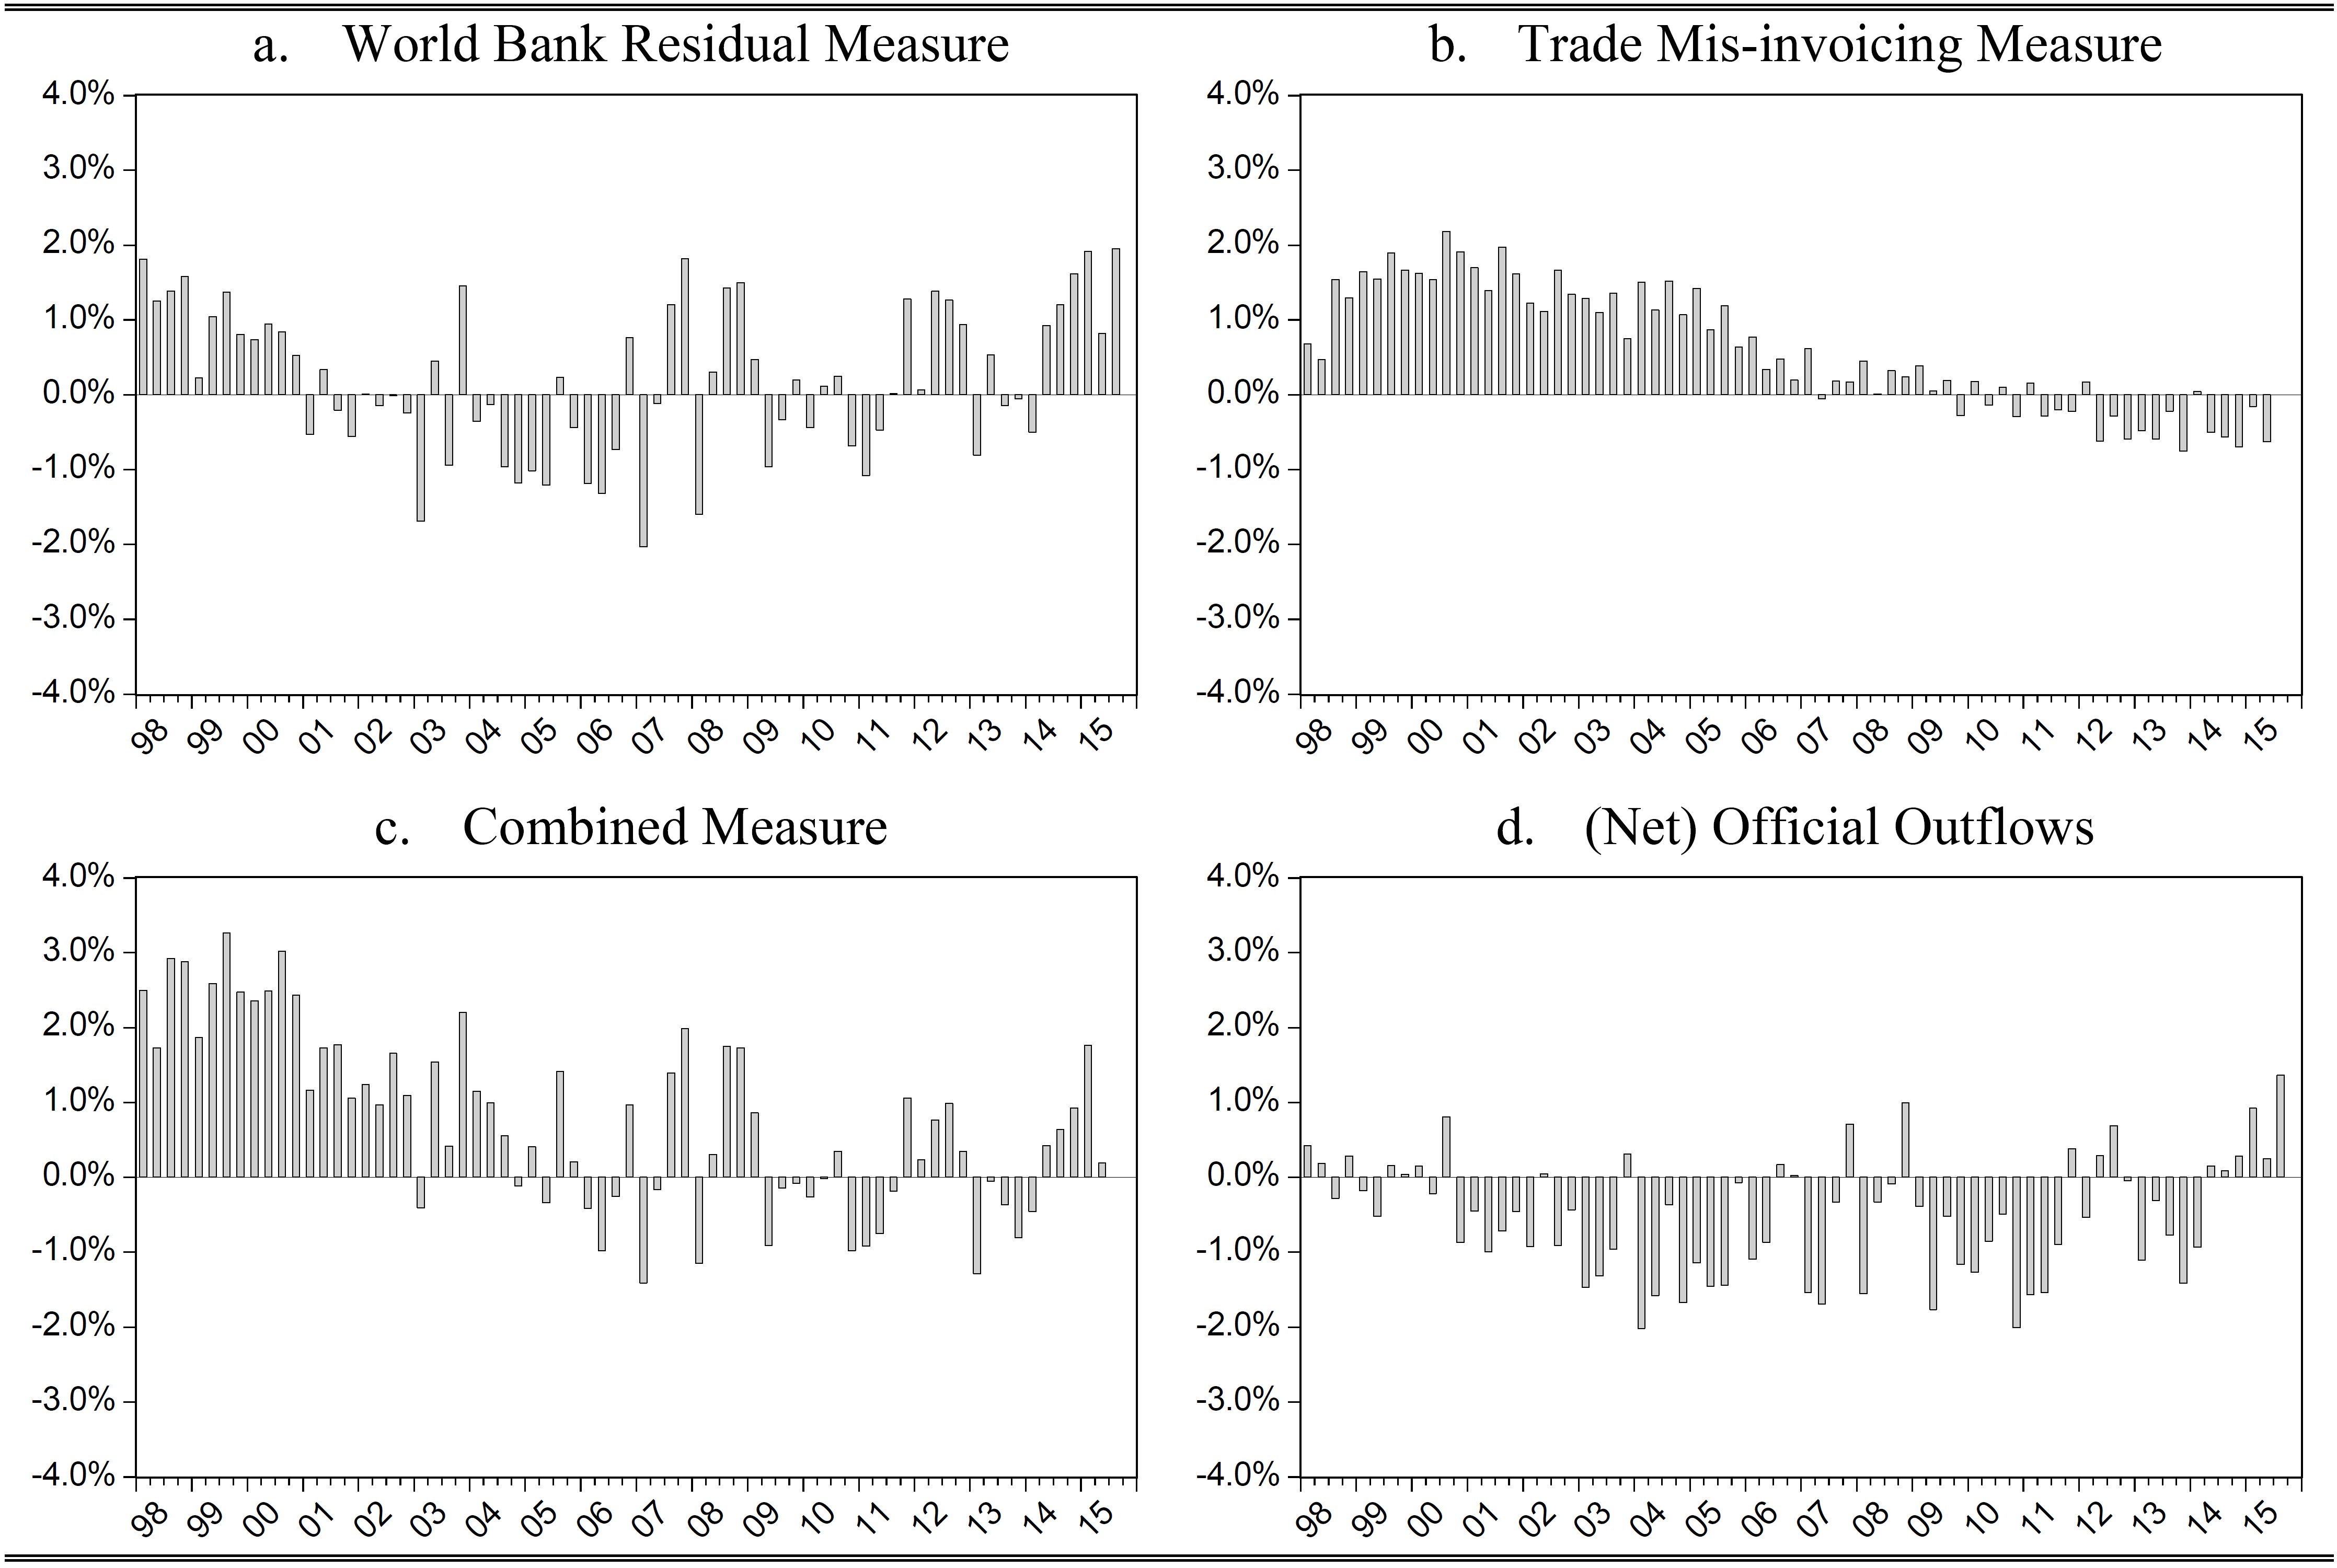
Figure 1: Capital flight and official flows. Data sources: National Bureau of Statistics of China, China State Administration of Foreign Exchange, Directions of Trade Statistics (IMF), International Financial Statistics (IMF), own calculations.
The starting point of our analysis is the creation of proxies for capital flight. While ultimately an unobservable variable, it has been approximated primarily by two measures in the literature: (i) The World Bank Residual Method, which compares the sources to the uses of funds in the balance of payments statistics and (ii) the measure of Trade Mis-invoicing. The latter is based on the idea that illicit flows can occur when bills of exports and imports are over (or under-) invoiced. For instance an export worth US$1000 may display only a value of US$500 on the bill, while another US$500 are placed into a US bank account. The independent recording of this shipment by two different agencies, the US and the Chinese statistical offices, helps us to uncover this type of capital flight. The graph above shows that the magnitude of capital flight is quite substantial. Although the dynamics differ for different measures of capital flight, they have in common that in net terms they are comparable to the official flows that are recording in the countries financial account.
In our research paper, we empirically analyze the determinants of these proxies for capital flight. Our main finding is that the standard explanatory variable, the deviations from covered interest rate parity – which follows from a standard portfolio balance model – has lost significance in the post 2007/8 period. Instead, we find three new factors that started to become empirically relevant around the same time. First the US money supply, relative to the money supply in China. The substantial expansion of the Fed’s balance sheet and other monetary aggregates help to explain the decline in capital flight out of China that is visible after 2007 in Figure 1.
The second factor is China’s gradual process of financial liberalization. This process is apparently taken as steps towards building up confidence by the markets, as it is also a factor that dampened capital flight over the past years. The increased realized volatility of financial markets, on the other hand, is a factor that appears to drive capital out of China. These factors are robust to a variety of control variables, including both China specific factors, such as political stability and risk measures, as well as other factors, such as the exchange rate regime.
Although outside of our sample period, the three factors – the US monetary policy, China’s financial liberalization, and market stability – identified in our study appear to be relevant also for China’s most recent capital flight/outflow experience after the summer 2015. Specifically, investors’ confidence about China’s commitment to financial liberalization and ability to stem market volatility has been eroded in light of the turmoil in the Chinese stock and the RMB markets and the policymaker’s erratic, if not clumsy, responses. These coupled with the US interest rate increase have been noted as reasons for significant capital flight from China.
A caveat must be made, however, when discussing the trade mis-invoicing measure of capital flight. While the Chinese authorities report the export data free on board, the US statistical offices report them including the transport and insurance costs. Thus a gap between the two is to be expected even in the absence of capital flight. In the literature – following the IMF’s example – this problem is typically approached by taking a constant 10% assumption on trade cost. While adopting this approach in the beginning of our paper, we do not consider it to be satisfactory, as trade cost can vary both across countries and over time. In one of our robustness test, we therefore use the time-varying and country specific trade-cost data of the CEPII Institute. Our main results, discussed above, were unaffected by this change.
Our empirical analysis has implications both for policy makers and practitioners in financial markets. From a Chinese policy perspective, it is important to be aware of illicit flows – as well as its determinants – when aiming to manage the financial account. Apparently these determinants are not stable over time and have changed in particular after the financial crisis.
Our results also highlight the potential side effects of tapering off the expansionary policies that have been implemented in response to the financial crisis. These side effects may not be limited to open economies where capital can be withdrawn freely, without capital controls. But it may also affect countries like China, who manage their financial account with various control instruments. A resurgence of illicit flight in these countries would follow from the recent market turbulence as well as the US and other central banks new tightening of monetary policy.
References
Cheung, Y-W, S Steinkamp and F Westermann (2016) “China’s capital flight: Pre- and post-crisis experiences”, Journal of International Money and Finance, doi:10.1016/j.jimonfin.2015.12.009.
This post written by Yin-Wong Cheung, Sven Steinkamp and Frank Westermann.
Goldman’s Top of Mind Global Macro Research (Feb. 9, 2016) has a very nice two page interview with Menzie, for those with access to the publication.
Steven,
Are you still anticipating an oil price rebound in 2016?
Some of my recent thoughts:
A Tale of Two Oil Price Declines
If we define the duration of the 2008 oil price decline as the number of months below $100, until we saw a sustained oil price recovery, the slump only lasted four months in 2008 (last $100 month was 8/08, for monthly Brent crude oil prices).
Annual OPEC (crude only) production fell from 31.1 million bpd in 2008 to 28.6 million bpd in 2009, a decline of 2.5 million bpd. US Crude + Condensate (C+C) production increased by 0.4 million bpd over same time period.
In contrast, annual OPEC (crude only) production increased from 30.8 million bpd in 2014 to 31.8 million bpd in 2015, an increase of 1.0 million bpd. US C+C production increased by 0.7 million bpd over same time period.
Using the same metric as above (number of months below $100, until a sustained price recovery), we are currently at 17 months and counting (last $100 month was 8/14).
On the demand side, global total liquids consumption fell from 87 million bpd in 2007 to 86 million bpd in 2008 and fell again to 85 million bpd in 2009.
Regarding the current decline, global total liquids consumption rose from 91 million bpd in 2013 to 92 million bpd in 2014 (BP consumption data), and to 94 million bpd in 2015 (EIA data).
So, global consumption fell by 2 million bpd from 2007 to 2009 (87 to 85 million bpd), but global consumption rose by 3 million bpd from 2013 to 2015 (91 to 94 million bpd).
US total liquids consumption hit a seven year high in 2015 (the highest since 2008), and recent data indicate that the US is becoming increasingly dependent on net crude oil and total liquids imports:
http://peakoilbarrel.com/oil-production-is-going-to-drop/#comment-558945
Based on most recent four week running average data (week ending 2/5), US net total liquids imports were running at 5.5 million bpd, versus an average annual level of 4.7 million bpd for 2015.
Some more crude versus condensate analysis:
http://peakoilbarrel.com/collapse-of-shale-gas-production-has-begun/#comment-558339
Yes, I think we’ll see a price rebound in 2016, although I would not be surprised to see oil prices pushed down to $20 WTI (shut in) in the interim.
Most forecasts, however, see the market clearing around mid year. I would add, however, that China is really a massive wildcard right now. I should have a piece on the topic next week on CNBC.
IMO, the global oversupply is a house of cards built on an unstable foundation of actual global crude oil production* that requires massive capital investments to keep crude oil production from crashing.
Qatar is basically the poster child for post-2005 production. OPEC 12 data show that Qatar’s reported crude oil production, despite billions of dollars spent on enhanced oil recovery, fell from 0.8 million bpd in 2005 to 0.7 million bpd in 2014 (OPEC crude only data), while EIA data show that Qatar’s C+C production increased from 1.0 million bpd in 2005 to 1.5 million bpd in 2014.
Production of condensates rising in Qatar
http://www.oxfordbusinessgroup.com/analysis/production-condensates-rising-qatar
A recent missive I put together, pursuant to a request from the folks at Oilpro.com:
Estimates of US, OPEC and Global Condensate Production Versus Actual Crude Oil Production
http://oilpro.com/post/22276/estimates-post-2005-us-opec-global-condensate-production-vs-actua
*45 API Gravity and lower crude oil