Employment growth is downgraded, according to several measures, and manufacturing employment is particularly hard hit.
Not only was net employment growth very low, at 38,000, the previous months’ estimates were revised downward. Even after accounting for the 37,000 subtraction due to the Verizon strike [CR], May’s number was not good.
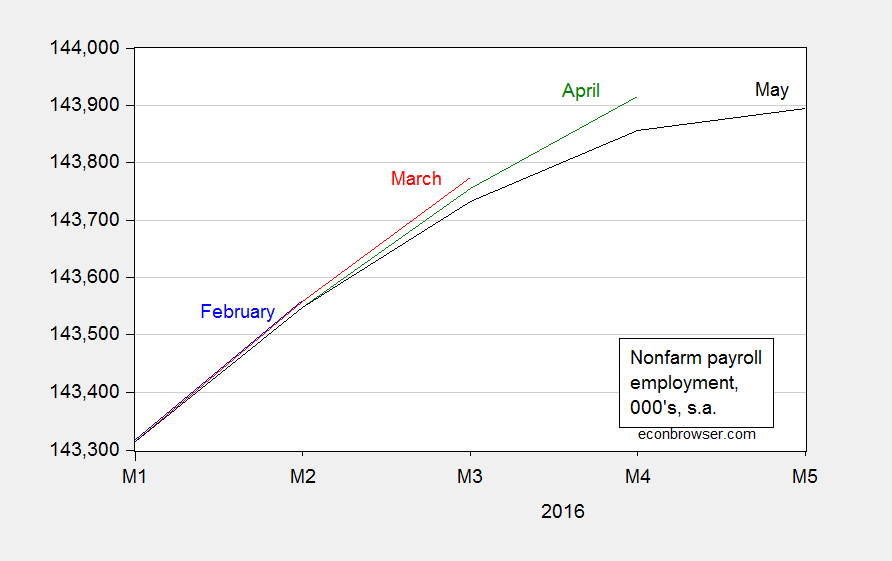
Figure 1: Nonfarm payroll employment, February release (blue), March release (red), April release (green), and May release (black). Log scale. Source: BLS.
A longer span of data puts growth in perspective. The household series adjusted to the NFP concept also shows a slowdown.
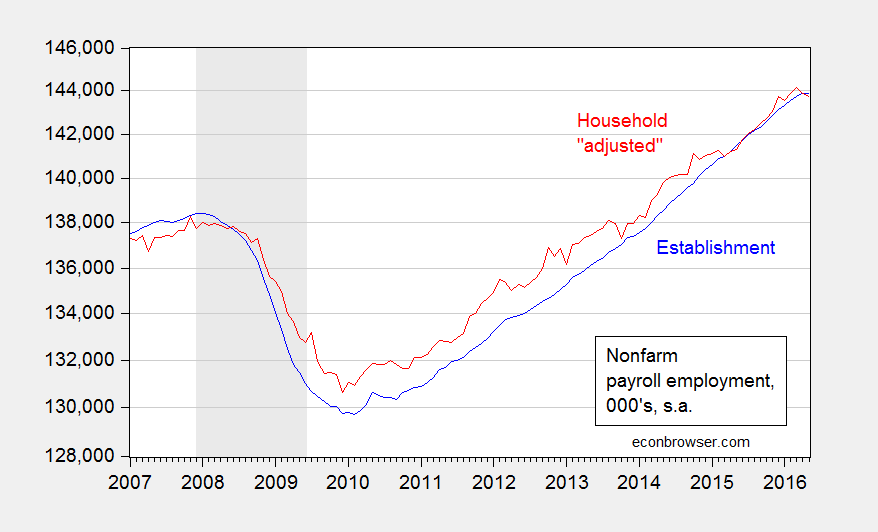
Figure 2: Nonfarm payroll employment, May release (blue), and household series adjusted to NFP concept (red). Log scale. Source: BLS.
Of particular concern is the slowdown due to external conditions, including the dollar’s value.
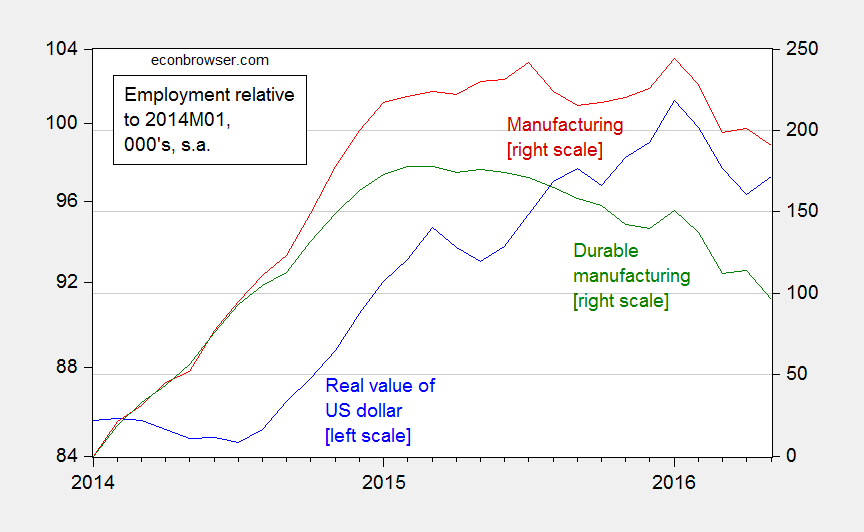
Figure 3: Real value of the US dollar, broad index (blue, left scale), manufacturing employment (red, right scale), and durable manufacturing employment (green, right scale), both relative to 2014M01, 000’s. All log scales. Source: Federal Reserve Board and BLS.
Since January 2014, manufacturing has accounted for less than 200,000 of the 6.3 million cumulative net NFP employment gain. The already strong dollar is yet one more reason to refrain from further monetary tightening.
Update, 6/7: Reader Neil argues:
The focus on the manufacturing payroll figures may be overstating things. After all, the workweek in the manufacturing sector rose. That helped push aggregate hours worked up 0.2% for the second month in a row. …
I will just say looking at the trend (as opposed to one or two months’ worth of data) is a good idea. Figure 4 presents both manufacturing employment and aggregate hours, normalized to 2014M01=0.
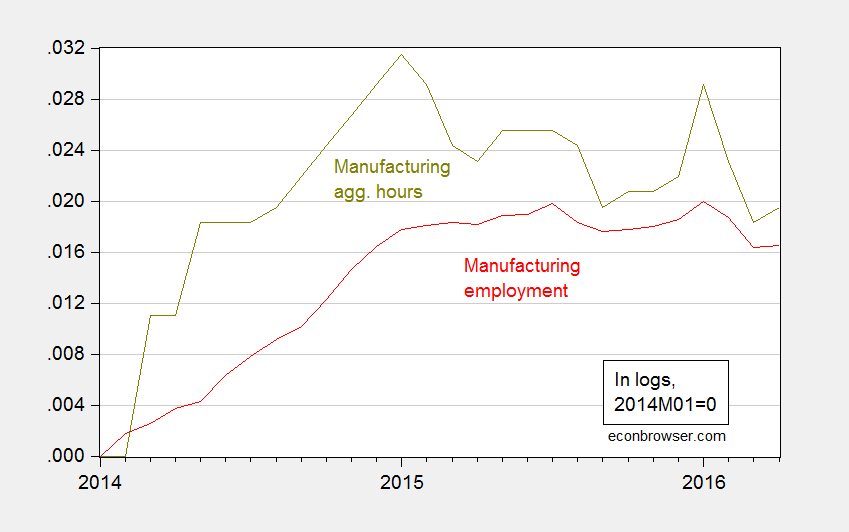
Figure 4: Manufacturing employment (red), and manufacturing aggregate weekly hours (chartreuse), both relative to 2014M01. Source: Federal Reserve Board and BLS.
As is clear in the graph, aggregate hours is trending downward from January 2015 onward. In other words, this graph strengthens the case that the tradables sector is undergoing greater stress.
The “value” of the dollar is irrelevant. A big chunk of manufactures “gain” was based around the oil boom. when it busted late in 2014, it lead 2015 employment lower, well duh. That said, the BLS will lag there and overestimate on the downside for to long. My guess this leads toward a surprise jump in manufacturing employment in the 3rd quarter.
The ‘value’ of the dollar may not yet be significant. I agree about the importance of the oil boom. An unexpected increase in manufacturing employment later in the year is a real possibility.
Though part of me cannot help but wonder if the success of the Trump candidacy is dampening the confidence of some investors and producers.
Near term: does the US federal reserve look beyond the volatility and increase overnight rates another 25 basis points or does it continue to fixate on short-term data?
I would like to think that a federal rate hike will be overall positive and that any further increase in the value of the US dollar will be quickly attenuated by increased capital outflows driven by renewed confidence in non-US economic growth.
It’s uncertain how much of an influence the stronger dollar had on U.S. manufacturing employment.
U.S. manufacturing employment decreased from roughly 17 million in 2000 to roughly 14 million in 2005. We offshored production, e.g. to China and Mexico. It fell to slightly under 12 million in 2010 and rose to slightly over 12 million today. There was some recovery after the severe recession.
Weak domestic and global demand, above average productivity, and more firms being destroyed than created, since the recession, may had bigger influences on U.S. manufacturing employment than a stronger dollar.
The focus on the manufacturing payroll figures may be overstating things. After all, the workweek in the manufacturing sector rose. That helped push aggregate hours worked up 0.2% for the second month in a row. This implies manufacturing production likely rose over the month even if manufacturing payrolls did not. When you say “refrain from further monetary tightening,” what specifically does that mean? Do you think the Fed should hike once this year? Not at all? Twice? Focusing on manufacturing employment to build a case to go slowly seems pretty weak considering the small share of employment that it is.
Neil: (1) FRED series “Indexes of Aggregate Weekly Hours of Production and Nonsupervisory Employees: Manufacturing (CES3000000034)” has only risen one month. It’s now below March levels. (2) I think the trend is more important; see the Update and newly added Figure 4. The (mfg) hours series presents an even more worrisome picture than the employment series. (3) Manufacturing is not important in and of itself, numerically, but is important because (a) average wages are higher in manufacturing implying significant multiplier effects, and more importantly (b) manufacturing proxies for the tradables sector.
Menzie, I think when forming its tally for manufacturing production, the FRB uses aggregate hours worked of all employees, not just nonsupervisory workers. That series has risen for the last two months. Nonsupervisory workers represent just 70% of the total. You mention wages in manufacturing. They are running 3.3% over the last year for all employees and 2.8% for nonsupervisory workers in the sector. With productivity barely moving, I would take that to be an inflationary sign.
https://research.stlouisfed.org/fred2/series/CES3000000016
https://research.stlouisfed.org/fred2/series/CES3000000003
1. We need to keep messaging that this is the fault of Kansas or Scott Walker. I don’t see that in this post.
2. If we can’t raise rates with sub 5% unemployment and the stock market near all time highs… when can we raise rates?
regarding point 2, if inflation is very low, what need is there to raise rates? this push to normalize seems to be an artificial need from dogma, not based on the empirical evidence. look, i would also like to make more money on my savings. but i would also like stocks to be higher, my home value to be higher or my rent to be lower. just because it is a want that puts me in a better position, does not mean it necessarily must happen. if the economy is not growing in an overheated way, why force interest rates to artificially high levels? do you believe higher interest rates will produce higher growth rates?