Today, we are pleased to present a guest contribution written by Alex Nikolsko-Rzhevskyy, Associate Professor of Economics at Lehigh University, David Papell and Ruxandra Prodan, respectively Professor and Clinical Associate Professor of Economics at the University of Houston.
A legislated monetary policy rule was first proposed by John Taylor (2011). By the end of 2015, legislation along the originally proposed lines had passed the House Financial Services Committee, the Senate Banking Committee and, as the Fed Oversight Reform and Modernization Act, the House of Representatives. The proposed legislation would require the Fed to specify a numerical rule which relates the federal funds rate to inflation and a measure of real economic activity, and to report to Congress if it deviates from the rule. The results of the Presidential election have increased the likelihood that some variant of the legislation will be enacted.
An important aspect of the legislation is that, in accord with central bank independence, the Fed, and not the Congress, would choose the rule. Suppose that the Fed were to adopt a policy rule. Which rule should it adopt? In a new paper, The Yellen Rules, we propose three criteria for adoption of a policy rule. First, the rule should be consistent with good economic performance over a long historical period. Second, the rule should be consistent with Fed policy following the Great Recession. Third, the rule should be consistent with current and projected Fed policy. The first criterion is normative, while the second and third criteria are pragmatic. Adoption of a policy rule does not commit the Fed to mechanically follow the rule, it just commits the Fed to announce the rule and report deviations. The rule does not have to be legislated, as the Fed could adopt a policy rule on its own at any time.
Taylor (1993) proposed the following monetary policy rule,
it = πt + α(πt – π*) + γ yt + R*t
where it is the target level of the short-term nominal interest rate, πt is the inflation rate, π* is the target level of inflation, (πt – π*) is the inflation gap, the percent deviation of inflation from its target level, yt is the output gap, the percent deviation of actual real GDP from an estimate of its potential level, and R*t is the equilibrium level of the real interest rate. We define policy rule deviations as the absolute value of the difference between the actual federal funds rate and the interest rate target implied by various policy rules.
We consider 12 variants of Taylor rules delineated by the coefficient on the inflation gap, the coefficient on the output gap, and the definition of the equilibrium real interest rate. Balanced rules have α = 0.5 and γ = 0.5 so that the coefficients on the inflation and output gaps are equal. The Taylor (1993) and Yellen (2015) rules are examples of balanced rules. Output gap tilting rules have α= 0.5 and & γ = 1.0 so that the coefficient on the output gap is greater than the coefficient on the inflation gap. The Yellen (2012) rule is an example of an output gap tilting rule. Inflation gap tilting rules have α = 1.0 and & γ = 0.5 so that the coefficient on the inflation gap is greater than the coefficient on the output gap.
In Taylor (1993) and Yellen (2012), the equilibrium real interest rate R* equals 2.0. We also use three time-varying equilibrium real interest rates. First, we calculate trend growth rates as the 10 year average growth rate of real GDP. Second, we use Laubach and Williams (LW) (2003) equilibrium real interest rates as in Yellen (2015). Third, we use Holston, Laubach, and Williams (HLW) (2016) equilibrium real interest rates. The 12 rules are balanced, output gap tilting, and inflation gap tilting times four measures of the equilibrium real interest rate. The target level of inflation is 2.0 for all 12 rules.
We proceed to discuss the three criteria.
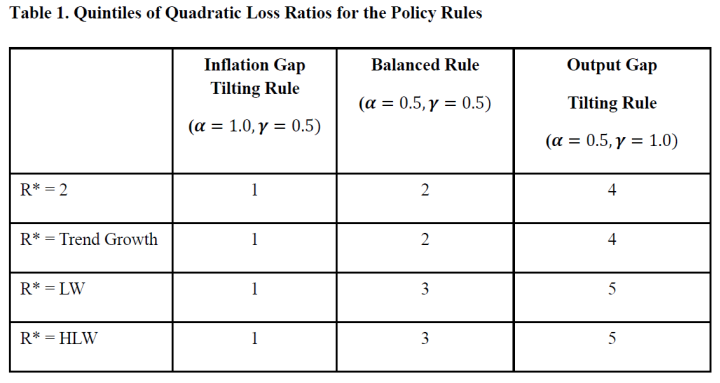
Criterion 1: Economic Performance over a Long Historical Period. In another new paper, Policy Rules and Economic Performance, we calculate quadratic loss ratios, the (inflation plus unemployment) loss in high deviations periods divided by the loss in low deviations periods, where a good policy rule will have a large loss ratio, from 1965 to 2015 for the 100 policy rules with α and γ between 0.1 and 1.0 in increments of 0.1. The results for the 12 rules are shown in Table 1. The inflation gap tilting rules are in the first (best performing) quintile, the balanced rules are in the second and third quintiles, and the output gap tilting rules are in the fourth and fifth quintiles with the worst performance. The preference for inflation gap tilting rules is in accord with Laubach and Williams (2015), who discuss the implications of uncertainty in real-time measures of the equilibrium real interest rate which are relevant for policy and advocate a strong response to inflation in order to reduce the importance of accurately measuring the equilibrium real interest rate.
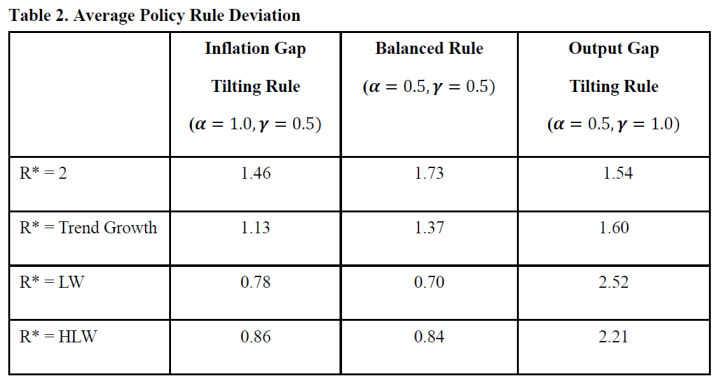
Criterion 2: Fed Policy Following the Great Recession. If the Fed were to adopt a rule, it seems self-evident that it would want to choose a rule which was in accord with recent, current, and projected policy. Between 2009 and 2015, we use the shadow federal funds rate from Wu and Xia (2016) as a measure of Fed policy which incorporates quantitative easing and forward guidance. Table 2 reports the average of the policy rule deviations between the prescribed and shadow federal funds rate. The four lowest deviations are for the balanced and inflation gap tilting rules with LW and HLW equilibrium real interest rates, with the smallest deviation being for the Yellen (2015) rule. The Taylor (1993) and Yellen (2012) rules have larger deviations.
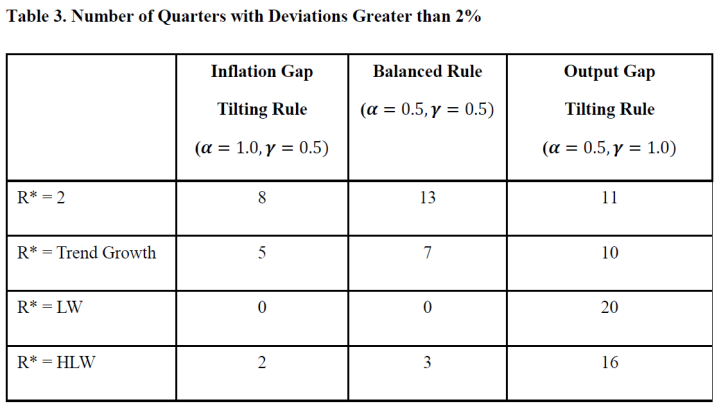
These results relate to the proposed policy rule legislation. In an earlier paper, Policy Rule Legislation in Practice, we use a threshold of two percentage points to define a deviation from a legislated rule. Table 3 reports the number of quarters between 2009:Q1 and 2016:Q3 where the absolute value of the difference between the prescribed and shadow federal funds rate was greater than two percent. The most striking result is that there are no periods since the Great Recession with deviations greater than two percent for either the balanced or the inflation gap tilting versions of a policy rule with LW equilibrium real interest rates. Under this criterion, if the Fed had adopted the Yellen (2015) rule in 2009, there would have been no subsequent periods with deviations large enough to trigger Congressional testimony.
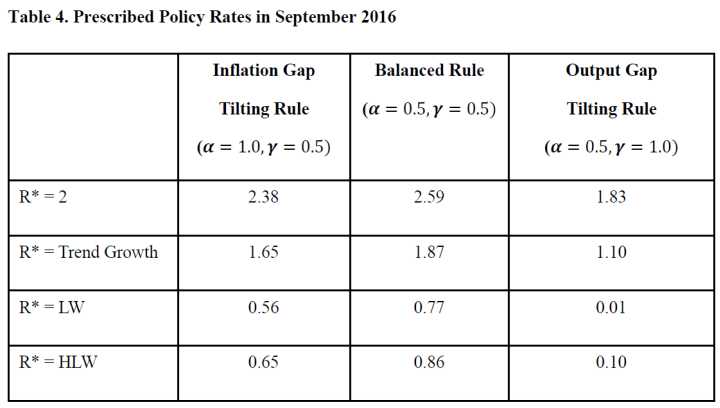
Criterion 3: Current and Projected Fed Policy. At the September 2016 FOMC meeting, the members voted to keep the target range for the federal funds rate at between 0.25 to 0.50 percent, although three regional bank presidents dissented in favor of raising rates. Table 4 reports the prescribed federal funds rate at the time of the meeting for the 12 rules. The closest to the Fed’s target is the inflation gap tilting rule with LW equilibrium real interest rates, although the other three balanced and inflation gap tilting rules with LW and HLW rates are also close to the target. Both the Taylor (1993) and Yellen (2012) rules prescribe a much higher policy rate. The paper also presents evidence that the balanced and inflation gap tilting versions of the Yellen (2015) rule are consistent with the Fed’s Summary of Economic Projections going forward.
The next meeting of the Federal Open Market Committee (FOMC) is scheduled for December 13-14 and it is widely expected that the FOMC will raise the target range for the federal funds rate to between 0.50 and 0.75 percent. At this time, core PCE inflation is 1.7 percent, the output gap projected by the Congressional Budget Office for the end of 2016 is -1.34 percent, and the LW equilibrium real interest rate is 0.18 percent. Using these numbers, the prescribed federal funds rate is 1.06 with the balanced and 0.91 with the inflation gap tilting versions of the Yellen (2015) rule. If the FOMC had raised the rate in September, it would have been exactly on target with another rate increase in December. Since the rate wasn’t raised in September, a December rate increase will leave the Fed only one 0.25 percent increase in the federal funds rate behind the prescriptions.
We propose that the Fed adopt an inflation gap tilting version of the Yellen (2015) rule as its policy rule. This rule is consistent with good economic performance over the past 50 years, Fed policy following the Great Recession, and current and projected Fed policy. It incorporates a time-varying equilibrium real interest rate and, as advocated by Laubach and Williams (2015), a strong response to inflation. It does not commit the Fed to a fixed path for rate increases. If inflation stays below target and/or the equilibrium real interest rate stays low, the rule would continue to prescribe accommodative policy. If inflation and/or the equilibrium real interest rate start to rise, the rule would prescribe faster removal of accommodation.
This post written by Alex Nikolsko-Rzhevskyy, David Papell and Ruxandra Prodan.


Should r* be related to trend real growth, or trend real growth per capita? Euler equation logic would seem to imply the latter, no?
Jordan: Yes, it should be. But the data are not cooperating with theory; see this post by Jim Hamilton.
Let’s just say this outright. If you are proposing a rule that says that interest rates currently should be 1%, when inflation is below 2% and wages have been stagnant for almost a decade, then your rule is garbage.
It seems that the Fed considers wage suppression as job number one.
It seems, it would be difficult to estimate potential output. The economy seems to be underproducing by a large margin. There’s idle capital (e.g. cash on corporate balance sheets) and labor (along with low-paying and part-time jobs). Policy rules will likely continue to be used as benchmarks. In practice, monetary policy operates “(flying) by the seat of the pants.”
Yet, the Fed has done an excellent job making policy adjustments, although without mistakes, e.g. the Bernanke Fed leaving the Fed Funds Rate too high at 5 1/4% for too long before the recession. Of course, oil was rising to $150 a barrel at the time. The Fed is often in a tough position.
Inferences drawn from data reflect the mindset of the thinker.
Thinking about a recent Fed Summary on Industrial Production suggests weak capacity utilization is an ongoing drag on economic momentum — an instrumentation of the tension between labor and capital, currently disfavoring labor. Consumers can’t spend enough to keep the facilities open. Sears.
Capacity utilization for the industrial sector edged down 0.1 percentage point in October to 75.3 percent, a rate that is 4.7 percentage points below its long-run (1972–2015) average.
Consolidation of overabundant industrial capacity, a seemingly permanent side effect of globalization, will likely continue to weigh against core inflation unless aggregate demand somehow trajects upward and saturates excess capacity.
Let’s see… stronger dollar, higher trade barriers, restricted movement of labor and capital… yeah that should be inflationary! Not!
The Fed, in its independence, might just make a policy change, if for no other reason than to demonstrate control… Or, they may feel patience is a virtue in light of ongoing structural slack during this period of elevated uncertainty.
Alternatively, presidential policy tweets may yet become a thing… [How can the Fed raise interest rates when so many jobs have been lost to… fill in the blank…] Political agendas conflate correlation and causation, just like a ten year time horizon can morph subprime into triple A. Longer memory, more data points, great. Let us see how well our predictions hold while resolving new unknowns. Especially under a tribal form of governance.
New, improved, data-driven rule-based policy decisions… we quibble over basis points while you all struggle under debt usury. A day late?! Don’t worry, we’ll charge you 33% FROM NOW ON…