Tax reform (DBCFT) will not pay for the wall. A remittances tax will not yield sufficient revenues, except perhaps over many years. What about a tariff?
That’ll do the trick (back-of-the-envelope calculations!). But it won’t necessarily be the Mexicans paying…
First consider the canonical analysis, where the US is considered a small country (in the context of US-Mexican trade):
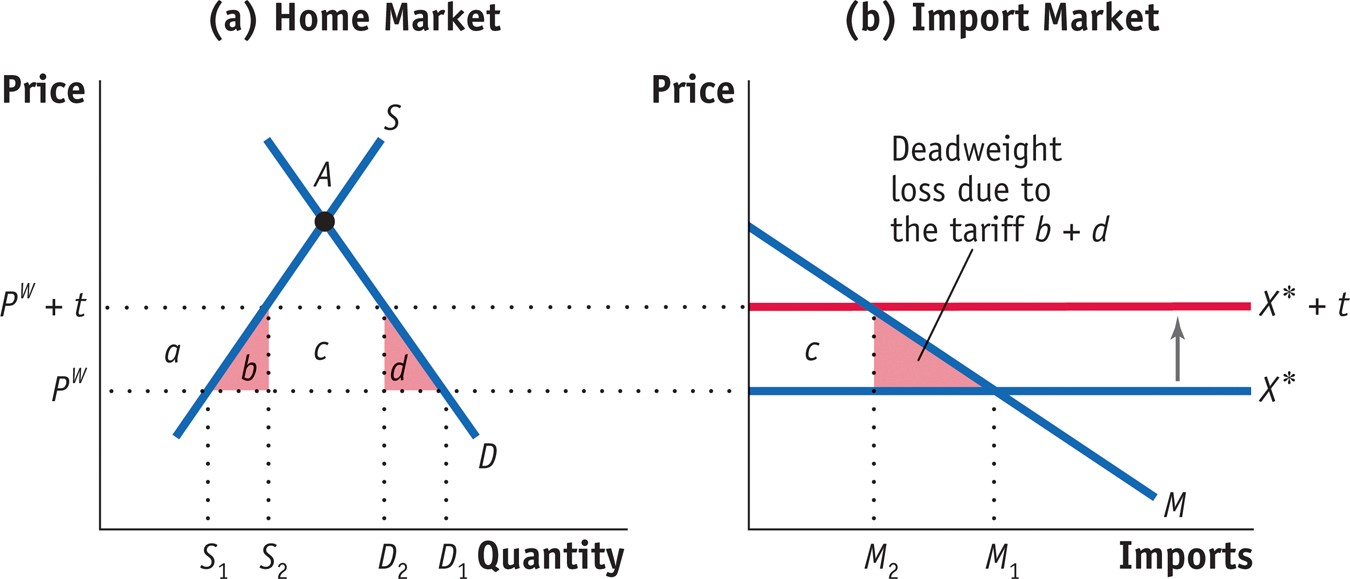
Figure 1
The tariff t raises the price faced by US consumers, producers, by the entire 4% of the tax. The resulting deadweight (efficiency) loss is the pink area in panel (b). Let’s put some numbers to the graph.
US imports of goods and services from Mexico was $316.4 billion in 2015. If the US exits Nafta, the tariff rate reverts to MFN/NTR rates of about 4%, and the price elasticity of imports is 3.8% (Spearot, 2015, Table 2), then imports fall by $44.6 billion. Consumption side and producer side deadweight loss is about $0.9 billion, while tariff revenues equal $10.9 billion. In this depiction, the entire tax burden is borne by US consumers.
A more realistic interpretation is to assume the US and Mexico are roughly equal size (in trade, not GDP, terms). This is depicted in Figure 2.
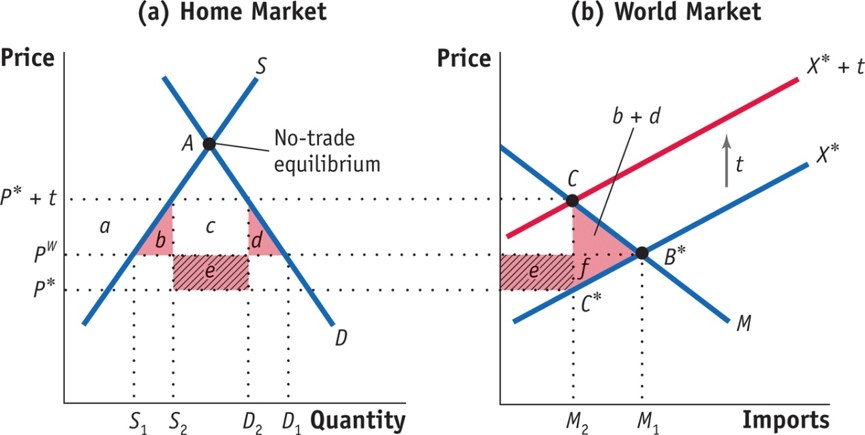
Figure 2
For simplicity, assume supply and demand elasticities are the same, so half the incidence of the tax falls on the US, half on Mexico. Then import prices rise by 2%.
Imports fall from $316.4 billion to $294.1 billion. Tariff revenues are $11.8 billion; $5.9 billion of the tariff revenue is borne by US consumers. There is a terms of trade gain to the US, since we force Mexico to sell its goods to the US at a lower price.
“So-called President” Trump has suggested at various instances a 35% tariff. This would drive down imports to $163.2 billion. Total tariff revenues are $57.1 billion — more than enough to pay for building the wall (at $12-$40 billion). Of this amount, $28.6 billion is from American consumers.
All of this is mostly an illustrative exercise. It’s also important to recall that it’s a partial equilibrium exercise. GDP effects are not incorporated (both Keynesian and supply side). Nor are financial side implications, such as the impact on capital flows and exchange rates. And obviously, retaliation is not accounted for…
One important subtlety: the analysis presumes final goods; but possibly 40% of US imports from Mexico are intermediate goods.[1](p.6). Then it’s important to remember negative ERPs.
Thus, a tariff would manifest itself, at least in part, as a consumer tax.
Can you imagine a Tea Party member voting for it? Well, they can do it once.
Caught up to the ERP analysis in early January — thanks Menzie.
The math shares similarities with the Alchian–Allen Shipping the Good Apples out theorem and the way high excise taxes stabilize domestic gasoline and diesel prices.
I am being to see far too many similarities between Team Trump and Neo-marxist populist governments in the developing world, e.g., President Salvador Allende of Chile in the early 1970s. Low popular vote, weak democratic mandate, utter disrespect for free markets, radical populist policies.
And when you read that President Trump has trouble reading through policy briefs….. Wow. It does not inspire confidence.
The confusion over sales taxes, value-added taxes and how VATs affect trade is alarming to say the least. 160 countries have VATs but not the USA. Curious, eh? I bet many of the other countries consult the works of American economists and tax experts to motivate, set up and fine-tune their own VATs.
Where are all the Ayn Rand and Murray Rothbard fans explaining how Trump will be “heightening the contradictions” for the “free market Nirvanna.” One thing I do appreciate about Trump is that he is revealing that the Libertarian and Conservative Movement are both fundamentally insane and exist on lies and denial of realities. As dystopia unfolds over the next 4, or8, or 56 years (Donald I (2017-2025; David II, 2025-2033, Donald II, 2033-2041, Barron I (sorry Ivanka, I think Salic law will be applied and only male successors will be allowed), 2041-2049, about which time there will be civil war amongst the grandsons for the spoils (unfortunately Mars a Lago will not be one, it by then being covered by the sea. https://www.theguardian.com/us-news/2016/jul/06/donald-trump-climate-change-florida-resort)
menzie,
you say: the tariff rate reverts to MFN/NTR rates of about 4%, and the price elasticity of imports is 3.8% (Spearot, 2015, Table 2), then imports fall by $44.6 billion.
I was a bit confused at first because the elasticity seems low and the delta in imports is high
implicitly when you compute the fall in imports, I understand that for a 4% increase in price, there is a 4*3.8% log decrease in imports
so the elasticity in the sense of delta ln Q/delta ln p is 3.8.
Am I right ?
nice analysis by the way !
rafaminos: ln(316.4)-(0.04×3.8) = 5.605
exp(5.605) = 271.8
316.4-271.8 = 44.6
thanks
Partial equilibrium trade models can be misleading. They invariably show large consumer losses in the short term as a result of supply side constraints. They should not be used for assessing the longer term consequences of tariffs or quotas. Below is a full equilibrium model that describes a trade scenario commonly faced by the developed economies. It is a sophisticated computer driven model that includes trade gains from monopolistic competition. Trade is between two regions (R1, R2). Four sectors are modeled (S1, S2, S3, S4). There are no trade frictions – resources are always fully employed, restructuring is assumed costless.
Consumer preferences are assumed indifferent between sectors, identical between regions and homothetic.
Capital / Labor ratios:
R1: 1000.00 / 100.00
R2: 200.00 / 200.00
Cobb Douglas PFs for R1:
S1: 1.00 K^0.45 L^0.60
S2: 1.00 K^0.15 L^0.90
S3: 1.00 K^0.45 L^0.60
S4: 1.25 K^0.15 L^0.90
Cobb Douglas PFs for R2:
S1: 1.00 K^0.45 L^0.60
S2: 1.00 K^0.15 L^0.90
S3: 1.00 K^0.45 L^0.60
S4: 1.00 K^0.15 L^0.90
Pre-Trade
Output Vectors
R1: 0086.88 0044.05 0086.88 0055.06
R2: 0063.83 0064.57 0063.83 0064.57
R3: 0150.71 0108.62 0150.71 0119.63
Price Vectors
R1: 0011.51 0022.70 0011.51 0018.16
R2: 0015.40 0015.22 0015.40 0015.22
R3: 0013.16 0018.26 0013.16 0016.58
GDP / Value of Sector Output
R1: 4000.00 1000.00 1000.00 1000.00 1000.00
R2: 3932.10 0983.02 0983.02 0983.02 0983.02
R3: 7932.10 1983.02 1983.02 1983.02 1983.02
Rents and Wages
R1: 0001.14 0028.57
R2: 0005.62 0014.04
Rental Income and Labour Income
R1: 1142.86 2857.14
R2: 1123.46 2808.64
Rentier Share and Labor share
R1: 0028.57 0071.43
R2: 0028.57 0071.43
**************************************
Post-Trade
GDP / Value of Sector Output
R1: 4431.32 1925.32 0000.03 2200.36 0305.61
R2: 4377.98 0257.53 2231.89 0000.03 1888.53
R3: 8809.30 2182.85 2231.92 2200.40 2194.13
Rents and Wages
R1: 0001.81 0026.19
R2: 0003.50 0018.39
Rental Income and Labour Income
R1: 1811.80 2619.51
R2: 0699.01 3678.97
Rentier Share and Labour share
R1: 0040.89 0059.11
R2: 0015.97 0084.03
***************************************
Post-Trade
Quota/tariff prevents R1 importing goods from S4 in R2
GDP / Value of Sector Output
R1: 4413.23 1323.96 0000.03 1731.33 1357.91
R2: 4341.90 0821.44 2190.50 0469.40 0860.56
R3: 8755.13 2145.40 2190.54 2200.73 2218.46
Rents and Wages
R1: 0001.50 0029.10
R2: 0004.95 0016.76
Rental Income and Labour Income
R1: 1503.39 2909.83
R2: 0989.08 3352.82
Rentier Share and Labour share
R1: 0034.07 0065.93
R2: 0022.78 0077.22
***************************************
We can see from the model there is a real distributional problem for R1. Despite R1 being a more efficient producer in S4 than R2, capital abundant R1 shifts production away from S4 as it now favors the relatively capital intensive sectors. This induces a large fall in the labor share. The result is a significant (8%) fall in real wages. As most inhabitants of R1 earn the bulk of their income from wages, most lose from trade. Redistribution could resolve that issue, but how? Sorting out winners and losers in a real world scenario would be next to impossible.
Instead, R1 decides to defend labor intensive S4 with a quota/tariff designed to eliminate imports of S4 goods from R2 (in general equilibrium models, tariffs and quotas have similar outcomes). The result, as you can see, is not so bad. Now, wage earners in both regions are winners and the rentiers (owners of capital) in R2 lose less than in the free trade scenario. The big winners are still the rentiers in R1. Moreover, the bulk of the trade gain still applies (R1 barely sees any net welfare loss).
Most economists will still prefer free trade as this clearly maximizes global income. However, simply ignoring the distributional effects of trade and making false claims for its benefits can lead to unnecessary and unpleasant consequences (Brexit, Trump?).
“However, simply ignoring the distributional effects of trade and making false claims for its benefits can lead to unnecessary and unpleasant consequences (Brexit, Trump?).”
this is the argument krugman and others have been making over the past year. globalization can have an overall positive effect. but if the gains are not realized by those hurt by globalization, inequality will rise. factory workers in the us lose with globalization. if the gains our country see from globalization cannot be returned in some way to help those workers adjust going forward, it creates a problem. those that are stuck with the free market ideology and the winner take all mentality, cannot bring themselves to address this weakness in their approach. there is a “redistribution”, or some other term if you are not comfortable with this word, that needs to occur for globalization to work well in an advanced economy such as the usa. otherwise you get trump and brexit-and the real problems still are not solved.