State agencies have released data on July employment. Below is Wisconsin, compared to Minnesota and the Nation.
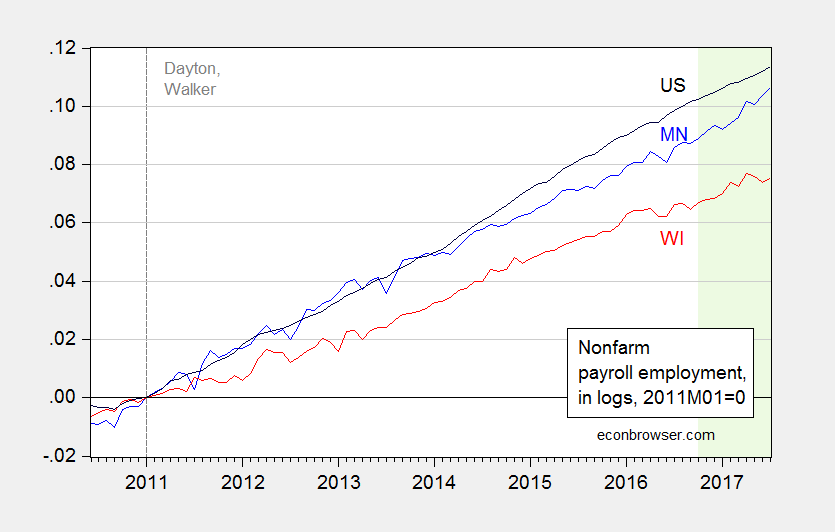
Figure 1: Nonfarm payroll employment in Minnesota (blue), Wisconsin (red), and US (black), all in logs normalized to 2011M01=0. The light green shaded period pertains to data that has not yet been benchmarked using QCEW data. Source: WI DWD, MN DEED, BLS and author’s calculations.
The difference in trajectories for MN and WI employment has become ever more prominent in recent months.
While the preliminary estimate for July WI NFP indicated an increase, it’s interesting to note that private NFP is essentially flat from May onward (and also below April peak). This is shown in Figure 2.
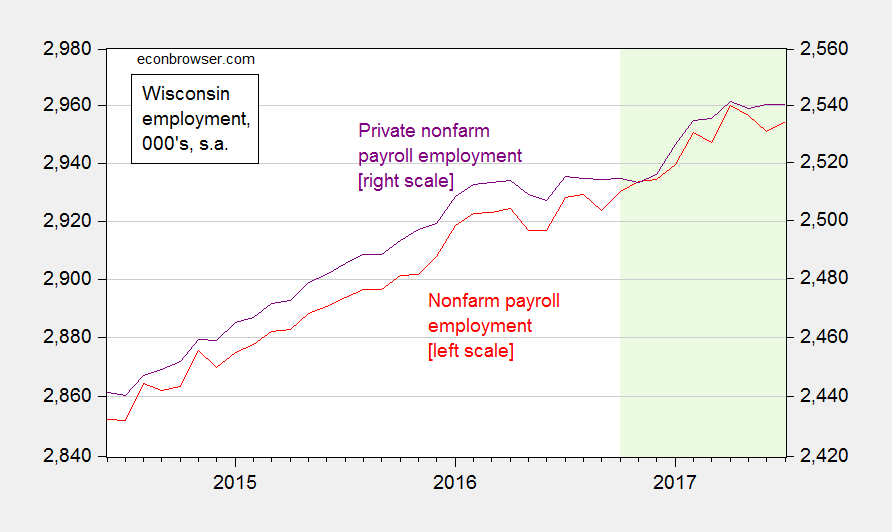
Figure 2: Nonfarm payroll employment in Wisconsin (red, left log scale), and private NFP (purple, right log scale), both on log scale. The light green shaded period pertains to data that has not yet been benchmarked using QCEW data. Source: WI DWD and BLS.
April through June figures for NFP and private NFP have all been revised downward, according to today’s press release.
The release also observes:
Based on preliminary data, the state added 26,500 total non-farm jobs and 25,000 private-sector jobs from July 2016 to July 2017, with a significant year-over-year gain of 9,600 manufacturing jobs. The state added 3,600 total non-farm and 100 private sector jobs over the month.
Whither art thou Foxconn?
Unemployment rates:
U.S. – 4.3 (-0.1 from prior month)
Wisconsin – 3.2 (+0.1 from prior month)
Historical variance – 0.9
California 4.8 (+0.1 from prior month)
New York 4.7 (+0.2 from prior month)
Illinois 4.8 (+0.1 from prior month)
Kansas 3.7 (no change)
Minnesota 3.7 (no change)
Yup, Wisconsin sucks.
Bruce Hall: I know we have had this discussion before, but let me reiterate (1) state-level fixed effects make the Wisconsin number look mediocre; (2) state-level figures are from a survey with pretty small sample size for small states; (3) the unemployment rate is the ratio of two poorly measured figures at the state level for small states.
Menzie, you might not have noticed the fourth line of my comment. I recognize what you’re saying about the Wisconsin numbers versus US total. However, on the state by state comparison I don’t understand your issue.
Bruce Hall: For instance, California has a higher UE rate than the Nation, but on average this is true, by 0.9 percentage points over the 1976M01-2010M12 period. Hence, California at 0.5 ppts higher than national average is actually doing better than it usually does.
That’s what I mean by fixed effects.
Menzie,
Yes, I understand that part, but your insistence on comparing states to states using these data as being valid in one argument and then saying the same data are “poorly measured figures” in another instance seems a little disingenuous. Either the state data are acceptable for comparison or they are not.
On an absolute basis, comparing states to states, Wisconsin is not doing all that badly. https://www.bls.gov/lau/stalt.htm
I would guess that even adjusted for “fixed effects” Wisconsin would compare fairly decently with Michigan, Minnesota, Illinois and Indiana.
Bruce Hall: Actually, you will notice that I don’t typically bring up the household level series at the state level — focusing on establishment series — exactly for this reason. I respond to your point about (point estimates) of unemployment rates at the state level talking about fixed effects because that is a separate issue. You will find that in my assessments even at the National level, I stress establishment survey data over household.
Would you want to be Kansas (over 10,000 jobs lost in last 12 months) or Wisconsin vs Minnesota or California or Washington these days? Me neither.
Low unemployment can also reflect a lot of people leaving for places with better wages and better quality of life. That is what’s happening here.
Wisconsin has the 4th highest tax burden behind New York, New Jersey and .Connecticut.
Jesse Livermore: By what criterion? What is the source? ALEC Rich State Poor States 2017 indicates otherwise.
Low unemployment also can mean there are a bunch of people unemployed for so long they fall out of the unemployment pool.
This was exactly the case years into the U.S.’s great recession. U6 was incredibly high and not declining while U3 was declining.
Menzie, I was referring to individual tax burden for Wisconsin. While I am impressed that you would use a study by Steven Moore and Arthur Laffer, I don’t find where they specifically address a total for individuals.
I’ve found the Tax Foundation useful. Their latest study on the individual state taxes is from 2012. The recent surge in Illinois taxes has probably changed the top 5 rankings.
https://taxfoundation.org/publications/state-local-tax-burden-rankings
What is interesting is four of the top 5 states in the Tax Foundation study are the four states with the highest outbound moves in 2016 for Allied Van Lines and United Van Lines.
https://www.illinoispolicy.org/moving-out-illinois-has-countrys-worst-outbound-rate-in-2016/