Here are GDP series for Wisconsin, as compared to Minnesota and the Nation, normalized to 2011Q1 when Governor Walker took office. I’ve indicated the implementation of the Manufacturing and Agriculture Credit, and percentages, as well.
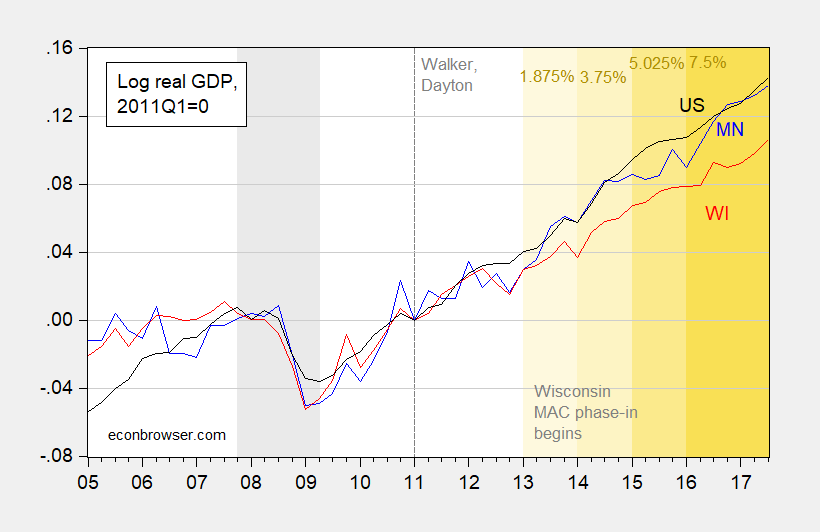
Figure 1: Log real GDP for Minnesota (blue), for Wisconsin (red) and US (black), all normalized to 2011Q1=0. Implementation of Wisconsin Manufacturing and Agriculture Credit (MAC) shown in orange shading, with size of credit indicated by darkness (percentage of credit in brown text). NBER defined recession dates shaded gray. Source: BEA, NBER, and author’s calculations.
Menzie
Look at the graph and the years 2005 – 09 Wisconsin performance, it demonstrates the Walker did not continue the no growth policies of those years but allowed Wisconsin to grow. The same can be said for Minn. Can very much explain the reelection of both governors.
Ed
You mean Walker was responsible for the end of the Great Recession? No wonder he got re-elected six years later!
ithy
2005 was not recession but Wisconsin was essentially no growth. It was not a surprise that the state voters threw out the old and brought in the new in 2011. The reelection was confirmation of policy that help turn the state around.
Ed
the same can be said for obama. but wisconsin has not been able to keep up with the performance of minnesota, or the us overall. that would be due to walker policies?
Wisconsin isn’t a high-tech economy – it’s in old growth industries. Moreover, it has too little involvement in the global economy. Milwaukee has to compete for new businesses with Chicago and St Paul-Minneapolis, which are the high-tech hubs regionally. There’s likely a brain drain from Wisconsin to other metro areas besides Milwaukee, unless someone likes milk, cheese, beer, paper, and printing.
PeakTrader: I think you have little conception of Wisconsin. Ask yourself where a big chunk of the software for digitizing medical records is.
Menzie Chinn, I’m sure, Wisconsin is not without some high-tech industries, but how big are they?:
http://archive.jsonline.com/business/wisconsin-economy-stuck-in-old-growth-industries-b9934100z1-211923141.html
PeakTrader: See Figure 6-1 in the Wisconsin Economic Future Study (2013).
Menzie Chinn, it says Wisconsin leads in low tech intensity industries, and lags in high and moderate tech intensity industries.
Folks – do not take Peaky’s account of what this document says. Go to pages 6-14 and 6-15 and read the actual details.
Pgl, it’s not my account – see pages 165-68 and the summary in the article I posted above.
PeakTrader: But if you refer to Figure 6-1, you’ll see that Wisconsin lags only minimally against peer states.
Menzie Chinn, have you seen 6-15, none of Wisconsin’s 14 largest exports are high tech or new industries. Also, figure 6-4 doesn’t show much “very high tech intensity.”
Admittedly and obviously I know less about Wisconsin than Menzie. Either way, it’s hard for me to imagine there aren’t some good technological ideas coming out of the Madison area.
Ranked 16th in the ENTIRE nation is not to “shabby”. One might even argue it would be a great place to put Amazon’s 2nd HQ.
https://www.jsonline.com/story/money/business/2017/04/08/wisconsin-gains-national-attention-start-up-technology-hub/99997634/
But then Jeff Bezos hasn’t consulted me on any of these decisions since our last trip together to the Aspen slopes. Bezos probably assumed I would be in Davos sharing a kosher meal with Soros or in Hollywood consoling Jessica Chastain for the Oscars snub by eating whip cream off her chest. Or perhaps Bezos just consigned me to oblivion. That’s life in the big city kids.
Manufacturing is 12% of U.S. GDP. In Wisconsin, it’s 19% of GSP. However, in Wisconsin, much of its manufacturing base is in old industries rather than new industries. Tax cuts may slow the decline in old industries, but will it attract new industries?
And, 8.5% of U.S. non-farm workers work in manufacturing. In Wisconsin, it’s 16.0%. Over time, Wisconsin will need to replace its old-line manufacturing jobs with new jobs.
“Tax cuts may slow the decline in old industries, but will it attract new industries?”
Again – data sine any insightful analysis of how a tax cut would allegedly do anything. We all await your publication in the American Economic Review where you carefully model this out and provide empirical analysis to support your model.
2 things amaze me about Menzie’s chart in this article. 1) Comparing a small subset of a larger average GDP (WI to US) doesn’t tell us much about the details of what caused the differences for either.
2) By citing Walker, Menzie implies that the explanation for details causing the differences is policies/politics.
The chart also shows there is a shift from when WI GDP was higher than the US average. A better discussion would have been to describe the differences in policies (National vs WI) which caused this shift.
Comparing WI with MN also begs the question what policy differences exist between the states? But, since this is supposed to be an economics blog, perhaps a more expansive discussion of economic policy differences.
Another issue, is when baselines are used to show growth, they should also include the differences in potential. If differences exist in potential then how much of the change is due to reducing slack in it, and what is expected after potential is normalized between the major and sub-components? This comment is getting too much into the weeds, but it is that level (log REAL) where economic policies affect change.
“when baselines are used to show growth, they should also include the differences in potential.”
CBO publishes its estimate for potential GDP for the nation. I do not know anyone who does that on the Gross State Product level. Now if you have such estimates – please share.
Pgl, locking in on the tertiary level point? Can’t you be any more impactful?
If those state level data are not developed don’t you think there may be a hole in a State University’s program? Without knowing the state’s potential, how can anyone do a real comparison?
If anyone is trying to show a state’s results is different from another, how would a discussion of effective change be made? Without including “potential” then there can be little discussion of policy differences effecting results. Otherwise the discussion must start with: “all things being equal”. Perhaps Menzie’s citing of Walker is his version of “all things being equal”, when the whole issue is trying to show they are not!
Why did you ignore the first 2 points of my comment?
Pgl, I guess when you said: ” I do not know anyone who does that on the Gross State Product level. Now if you have such estimates – please share.” you forgot the title (Wisconsin GDP since Walker) and the chart of this very same article. Are you calling Menzie out here?
Or are you just showing your penchant for knee jerk reaction to a conservative commenter?
CoRev: I believe pgl was arguing that estimates of potential GDP at the state level are not typically made. On this point, I concur with pgl — so if there is an estimate of potential GDP for Wisconsin, or any state, I would welcome seeing the estimate, and the documentation of how that estimate was arrived at.
Menzie, I know to what pgl was referring. If you folks actually do not estimate “potential”, then don’t you think there may be a hole in a State University’s or state Government’s program? You are making a case that WI is less efficient than … by just assuming “all things being equal”. My problem with these analyses is there is no actual discussion of the differences between the comparables.
Peak has been showing some of the differences, while you and pgl have trying to dispute or minimize them. The differences are especially important to defining comparison and more so for baselines. If all you are saying is the political leaders and their policies are the cause of the differences then define them. Otherwise your definition of “why” the differences exist is more than their political leaders and their policies as Peak and I believe. If you continue to insist it is Walker and his policies you are weakening your argument.
Pgl, I did not mock Menzie, I was mocking you, and other economists who think “potential” is unimportant at the state level.
@Menzie
I have not done an “exhaustive” internet hunt yet. But I have done a surface/initial internet hunt for GDP predictions for Wisconsin (and more general covering ALL individual states if it happens to pop up). This “CROWE” outfit seems to be a respectable source. I am going to assume Menzie is VERY familiar with “CROWE”.
https://www.minneapolisfed.org/~/media/files/news_events/events/regional-econ-2017/wi-outlook-mnfed-oct-2017.pdf?la=en
And this (I THINK it is the same thing, appears to break down in more detailed fashion HOW they tabulated the numbers. It appears to have come out late October of 2017: https://crowe.wisc.edu/an-outlook-for-the-wisconsin-economy-in-2018/
I don’t know how “scientific” or “empirical” it would be (two characteristics I think are important, as I am sure Menzie does as well), but it seems like you could “superimpose” or imply a FUTURE GDP number that fits this FRED line in the link pretty closely.
https://fred.stlouisfed.org/series/WINGSP
You mocked Menzie for not factoring in the state’s potential GDP. Of course neither you nor anyone else has such an estimate. If I were Menzie, I would be expecting an apology for your comment.
CoRev wrote:
2 things amaze me about Menzie’s chart in this article.
…2) By citing Walker, Menzie implies that the explanation for details causing the differences is policies/politics.
Your feigned amazement is going to fool anyone.
You’ve been reading this blog long enough to know that Menzie has been testing Walker’s claims that certain policies will produce certain outcomes. It is Walker that owes an explanation for the outcomes.
2 things amaze me about Menzie’s chart in this article.
1) Comparing a small subset of a larger average GDP (WI to US) doesn’t tell us much about the details of what caused the differences for either.
Comparing WI to a neighboring state with differing policies and to the US as a whole is a quick way to check to see if the results in WI show some delta that could have a WI-specific explanation. I’m “amaaazed” you don’t see that.
“Pgl, it’s not my account – see pages 165-68 and the summary in the article I posted above.”
Those were the same pages I was referring to. Yes I read them. Peak’s summary is highly misleading. But hey – what’s new there?
Peak Trader:
“Menzie Chinn, have you seen 6-15, none of Wisconsin’s 14 largest exports are high tech or new industries.”
I wonder if Peaky has read page 6-15 which does make Menzie’s point (see its table 6-19) but does not talk about exports. Does Peaky have a clue what he is even reading?
Now page 6-9 does says:
“Menzie Chinn, have you seen 6-15, none of Wisconsin’s 14 largest exports are high tech or new industries.”
Its table 6-15 does show $ exports by sector but this notion that none of these represent sectors with low level technology. Peaky is just embellishing what is written with his own “expert” opinion.
I guess I need to brush up on my economics again, I was thinking “potential” GDP was the same as future GDP, but apparently it is more of a theoretical concept.
My rhetorical question is, why would anyone believe ANY GDP number if we need a “pie in the sky” number to justify that GDP number?? I can tell you this much—if Trump’s GDP numbers came in above expectations and looking good, the “CoRevs” of the world wouldn’t be forcing potential GDP into the conversation. The “CoRevs” of the world would be infuriated anyone had even brought the topic up.
It is indeed an estimate of what current output would be at full employment – not some forecast of the future. CoRev seems to be mad at Menzie for not magically having produced such a figure at the state output level. But of course no one is doing this. If Menzie did attempt the provide such an estimate, bet the ranch that the CoRev’s of the world would be criticizing his estimates.
Which is fine as we have invited CoRev to do the hard work. His response? To misrepresent what we said.
Moses, my “theoretical” response is, if we are comparing “expectations” for comparables why are we not comparing efficiencies for them? Are they reaching their “potential” at the same rates? Is one closer to their”potential” than the other, why? ” Why” is the important question and answer, if you do not consider the various reasons for why, claiming/implying: Walker’s policies the cause is a woefully weak argument. There are many components to calculating GSP, and without defining the impacts to them, policy is only one.
Although there are many components to calculating GSP, developing “potential” GSP is moderately simple. Especially for rough estimates. this paper http://www.nber.org/papers/w20423.pdf defines “potential” GDP as: “Indeed, potential real GDP is a hypothetical concept, defined as the rate of real GDP growth consistent with an unemployment rate equal to its “ normal ” level….It is easy to do a back-of-the-envelope calculation of the implications for potential real GDP growth. ” I was quite surprised when pgl and Menzie insisted it was not done at the state level: “CoRev: I believe pgl was arguing that estimates of potential GDP at the state level are not typically made.”
We have been talking around the actual point: differences in economic results, for both the state and national levels. My earlier reference has this comment: “Forecasters universally predict that actual real GDP growth will increase from the 2.1 percent average of the past five years to between 3.0 and 3.5 percent per year over the next two to three years.(3)” This paper was written in mid-2014, so 2-3 years would have been mid-2016 to 2017. It didn’t happen in 2016 nor 2017, when even with som better quarterly numbers annual total stayed low.
The paper also made this claim: ” For output to grow that much faster than the 2.1 percentage point average of the last five years, something radical has to happen.” Late in 2016 something “radical:” did happen, and at least at the national level differences in economic results, did happen.
Too many here want to ignore this truth.
@CoRev
It sounds like to me, you have concocted a largely contrived argument, disguised by semi-technical jargon, that can be reduced to “How dare you criticize my butt buddy Republican Governor Walker, for having much worse economic results than his neighboring state of Minnesota!!!”. Which is a political argument YOU can make if you think it doesn’t sound rather absurd. Why not just state it as such, instead of making a fabricated argument, whose true intentions are rather transparent to those versed in basic or intermediate economics??
Moses, as I’ve already noted: ” I was quite surprised when pgl and Menzie insisted it was not done at the state level…” Then he and pgl made it sound complex, when it is relatively easy. Both after all are just estimates.
It’s easy to tell when a liberal has no real response to a comment. They revert ot personal attack while ignoring the comment’s issue. As a reminder it was: “why? ” Why” is the important question and answer, if you do not consider the various reasons for why, claiming/implying: Walker’s policies the cause is a woefully weak argument. There are many components to calculating GSP, and without defining the impacts to them, policy is only one. “
CoRev: Potential GDP is usually defined Y = ΦF(K,N) where K, N are capital stock and labor force owned by residents of country; and it can be assumed that K, N don’t change too much proportionally due to FDI, immigration, due to barriers to movement. Φ is total factor productivity. Now ask yourself if similar assumptions could be plauibly made about a state — and/or how one would estimate such a thing.
Menzie, are Φ, K and N unknown for WI? Couldn’t estimates/approximations be used for each? It would seem WI Φ could be derived from the BLS data, K & N are possible to derive even from your prior reference https://www.wmep.org/wp-content/uploads/2015/02/Wisconsin-Economic-Future-Study-FINAL-REPORTJune-2013-1.pdf
Since we are looking at potential changes/differences within/between states to determine if there is a significant difference to estimate efficiency for improvement and/or change.
Or if you did not want to calculate potential GSP, then compare the sub-factors’ changes between your target states. The point is to get a feel for where the target states are on the output curve, in trying to determine the efficiency of policies for each.
Your chart selected a single policy changing law, and actually shows that change might have not been the best one, but without “potential” (knowing where they are on the output curve) it is hard to tell if that or any other policy change could have done better.
CoRev: I think you have no idea how difficult it is to calculate potential GDP in the fashion CBO does it. You’d have to adjust labor force for demographics, education/skill levels, capital stock for vintages, as well as depreciation, and estimate total factor productivity (which differs from labor productivity).
Menzie, I’ve just been trying to add detail to your analysis. As I previously noted you are doing an “all things being equal” comparison by using a state-to-state GSP comparison, but then point out two differences for WI, Walker and the Wisconsin Manufacturing and Agriculture Credit. Since you Identified ed the WI differences Peak and I are trying to show other differences, including my question of are they at similar points on the output curve to explain their GSP growth rates. Your argument is weakened when you highlight one state’s differences without including a comparison with the other state,
There’s more, but this horse is already dead.
CoRev: I’m not sure I understand what you mean by your comments about “output curve”? In any case, there are several posts I have done that show that Wisconsin should have done better in terms of economic activity or employment, using historical correlations between Wisconsin and the Nation. Use the search command using terms “error correction model” and “Wisconsin”.
CoRev:
“Pgl, I did not mock Menzie, I was mocking you, and other economists who think “potential” is unimportant at the state level.”
Could he misrepresent what i said even more? Of course having estimates of potential output would be nice. My point is that no one has ever done this at the gross state product level. We have invited him to contribute such an estimate. His reply? That’s Menzie’s job? OK!
Pgl, I take your point: ” that no one has ever done this at the gross state product level. “, but do you accept mine that not doing so is a failure of economists? I doubt it, because doings something so obviously needed for state-to-state comparisons takes away from the “political” point.
Doing the hard work of analyzing the policy differences to identify those which are more successful than others is too dangerous when all you want to do is blame politics.
Beware of that position, as we are involved in a live experiment showing those policy differences including their economic results. At this stage it looks dubious for your party’s politics and policies. BTW, if you find it difficult to identify those differences, then it can only be blamed on your TDS driven bias(es). That also goes for the several obvious TDS sufferers commenting here.
CoRev: Yes, well did try to control. We know some things that do not correlate are the things that have been pushed by Governor Walker. See this post.
Menzie, which things do not correlate and being pushed by Walker? I saw in your reference only 2 policies, but saw no specific call out for which state and their impacts. Lack of policy identification and their impact(s) has has been my basic concern with many economic studies for many years.
CoRev: The components that go into the ALEC rankings can be found in the RSPS document. The are multiple links to the 2015 version in the post had you wished to know. Here are the components:
Highest Marginal Personal Income Tax Rate
Highest Marginal Corporate Income Tax Rate
Personal Income Tax Progressivity
Property Tax Burden
Sales Tax Burden
Tax Burden from All Remaining Taxes
Estate/Inheritance Tax (yes or no)
Recently Legislated Tax Policy Changes (over the past two years)
Debt Service as a Share of Tax Revenue
Public Employees per 10,000 Residents
Quality of State Legal System
Workers’ Compensation Costs
State Minimum Wage
Right-to-Work State (yes or no)
Tax or Expenditure Limits