Measuring the level of global economic activity is of key interest. But the measures we have on variables like industrial production don’t cover all countries and are only available with a significant lag. Michigan Professor Lutz Kilian suggested in an influential paper published in 2009 that we could get a useful timely indicator by looking at average shipping costs. I recently had a chance to look into the details of how that series is constructed and have some suggested improvements.
Kilian’s basic idea is that changes in world economic activity are the primary driver of the demand for shipping, and that this higher demand shows up in the short run as an increase in the real cost of shipping. Kilian calculated a nominal index of shipping costs (which I’ll denote by x) by starting with a value for 1968:M1 of x = 1 and adding an average of the monthly change in the log of different shipping costs each month to get a new value for xt for each month t up to 2007:M12. Since 2008, Kilian has simply added the monthly change in the log of the Baltic Dry Index (BDI) of shipping costs to the previous month’s value of x. That procedure implies that for data since 2008,
The value of c0 turns out to depend on the value of x and of the BDI in 2008:M1. Kilian has never reported the values for x itself or the value of c0, but it is possible to uncover both exactly from data he has made public, as I describe in this note. The value of c0 turns out to be -5.236.
Kilian’s next step was to take the log of x, subtract off the log of the CPI, and regress the difference on a time trend:
The residuals from this second regression are Kilian’s index of real economic activity, which he regularly updates on his website and which have been used in dozens of economic studies.
One can see the consequences of this procedure by substituting the first equation into the second:
Readers of this blog know that I am a big fan of using logarithms in economics. But applying the log operator twice– taking the log of the log– is rarely something we would want to do. One implication of the procedure in the current setting is that the resulting index of real economic activity is a function of the arbitrary value at which the series for x was initialized. When we initialize x for 1968:1 equal to 1 as Kilian did, the value of c0 would be -5.236. If we instead set x for 1973:1 equal to 1, the value of c0 would be -5.694. The next graph shows how different the resulting series would be if we chose one or the other of these seemingly harmless normalizations.
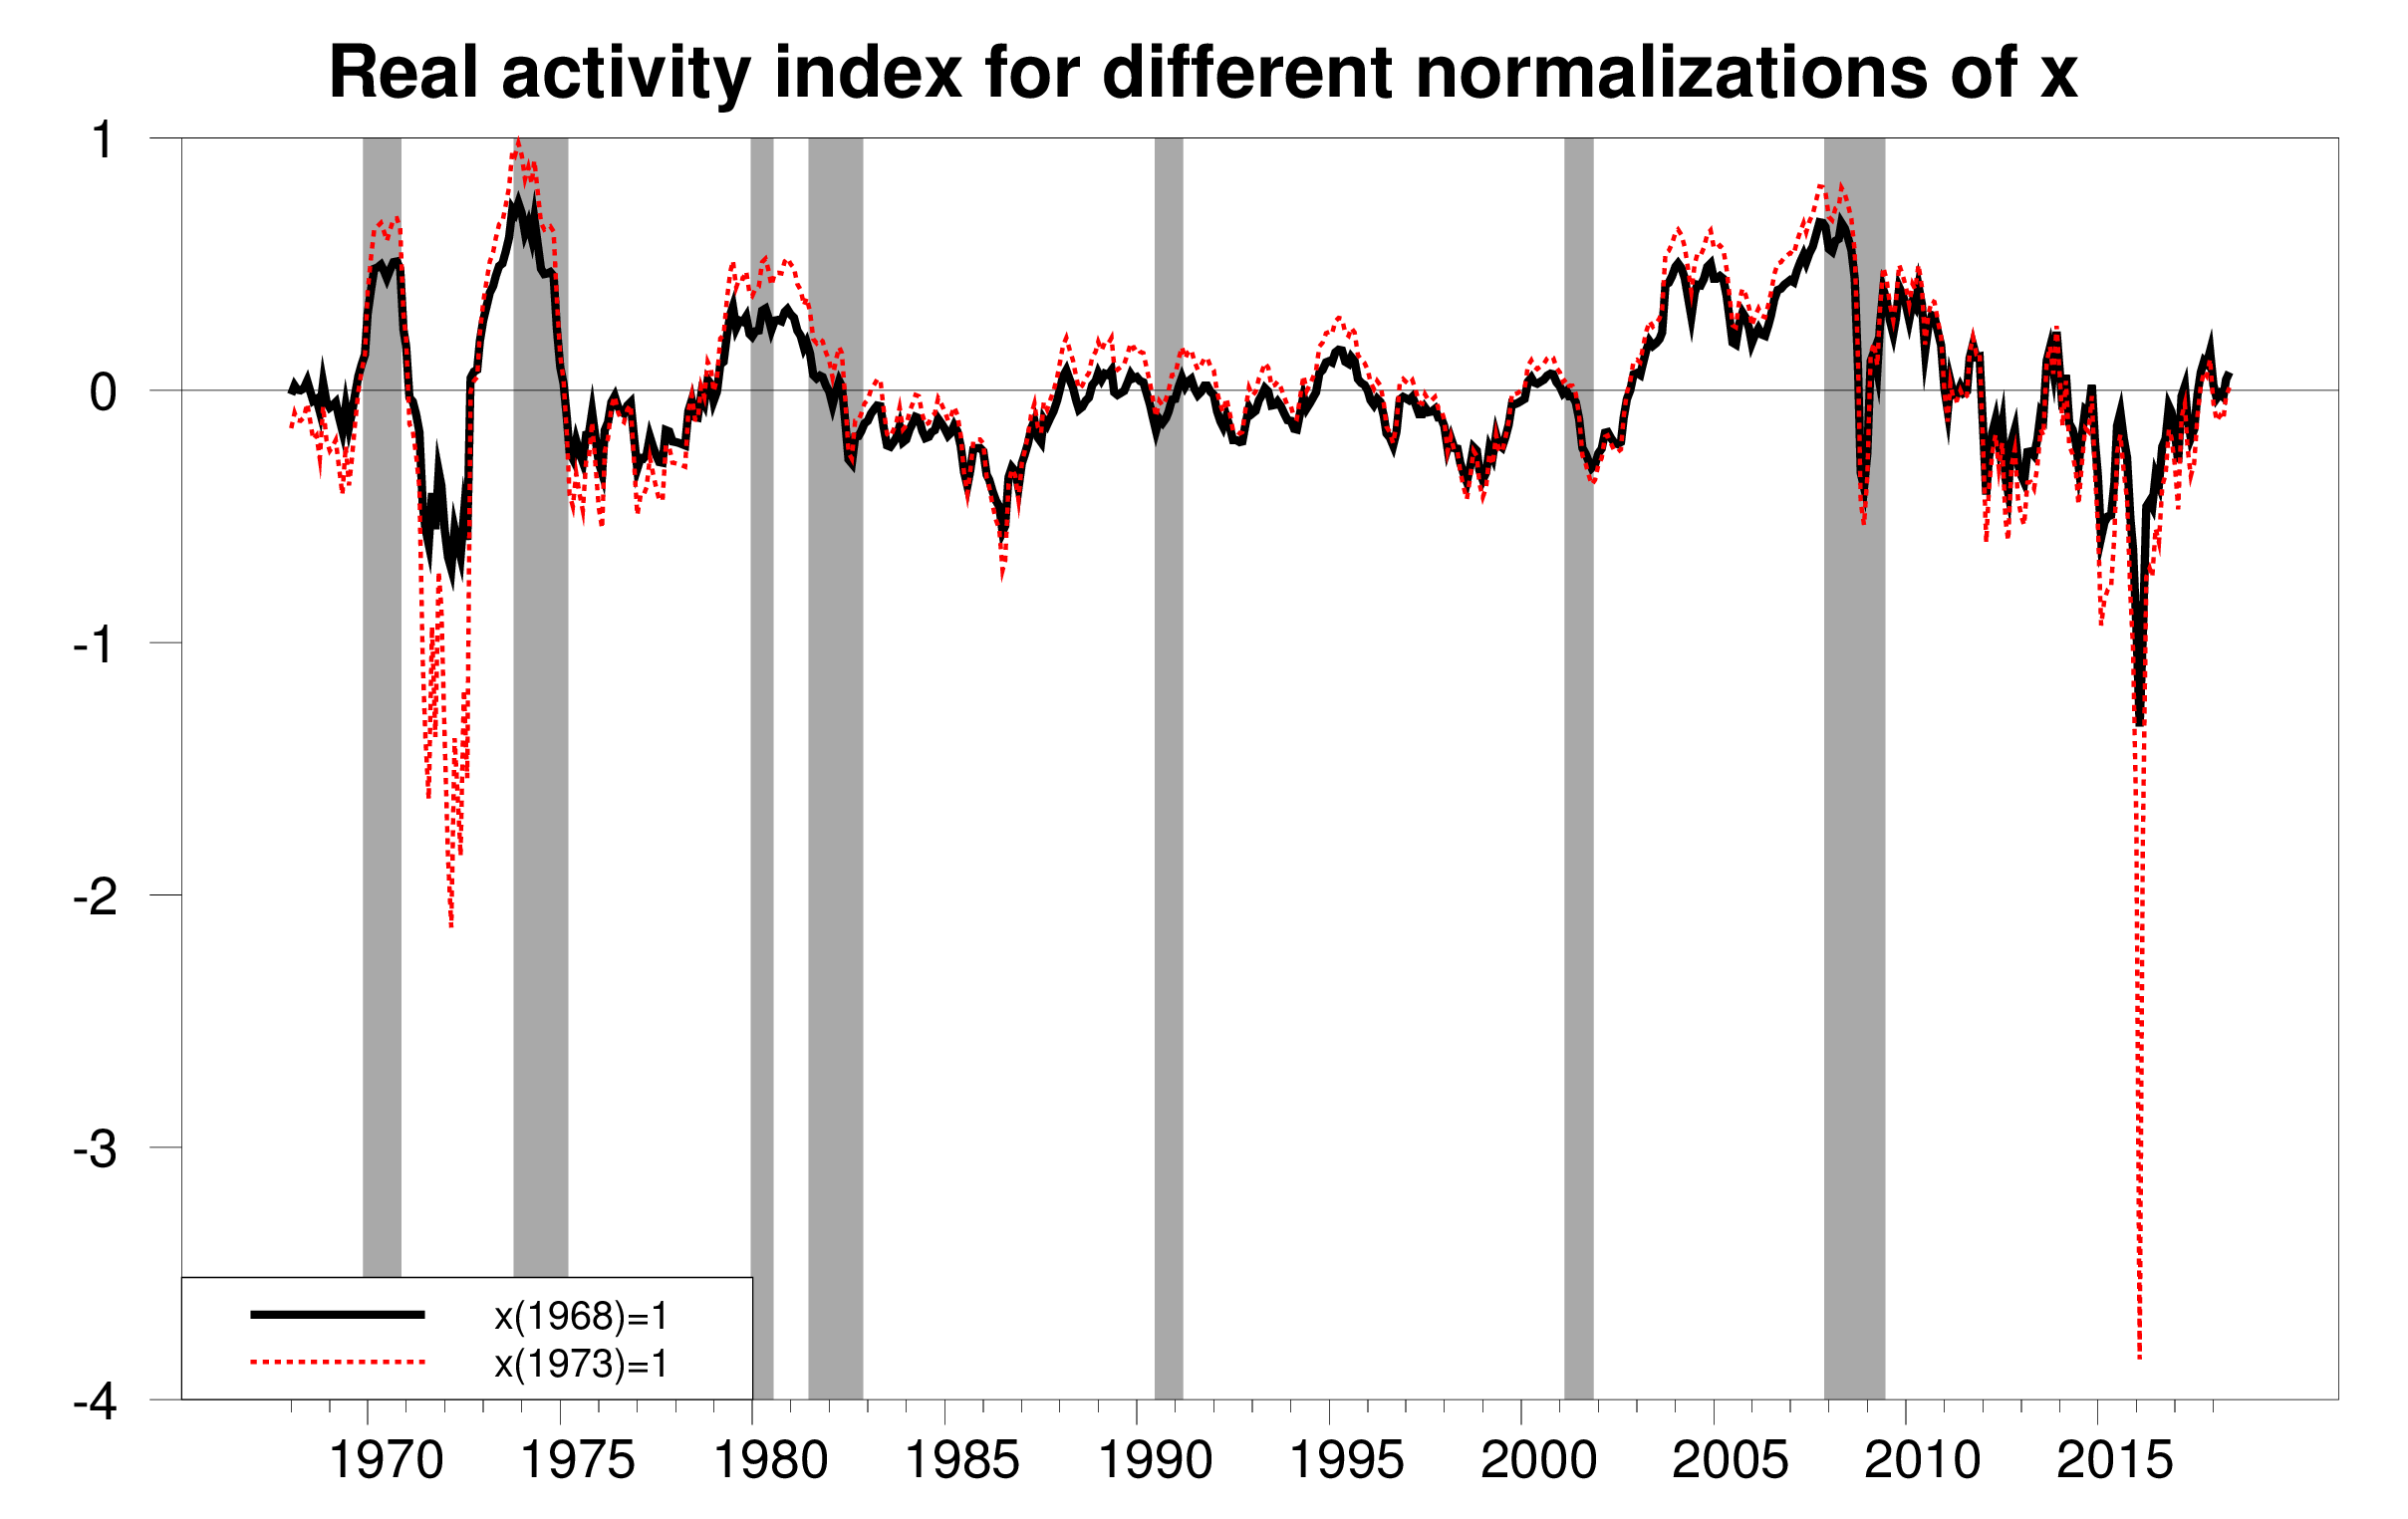
Real activity index resulting from two different starting values for x. Source: Hamilton (2018).
Does the index resulting from Kilian’s choice of c0 correspond to other things we know about global business conditions? The Kilian real activity index is reproduced in the top panel of the next figure. This series suggests that there was a drop in world economic activity in 2015 that was far more severe than that in either the financial crisis of 2008-2009 or the 1974-75 global recession. This conclusion seems hard to justify on the basis of output data we have for any major country.
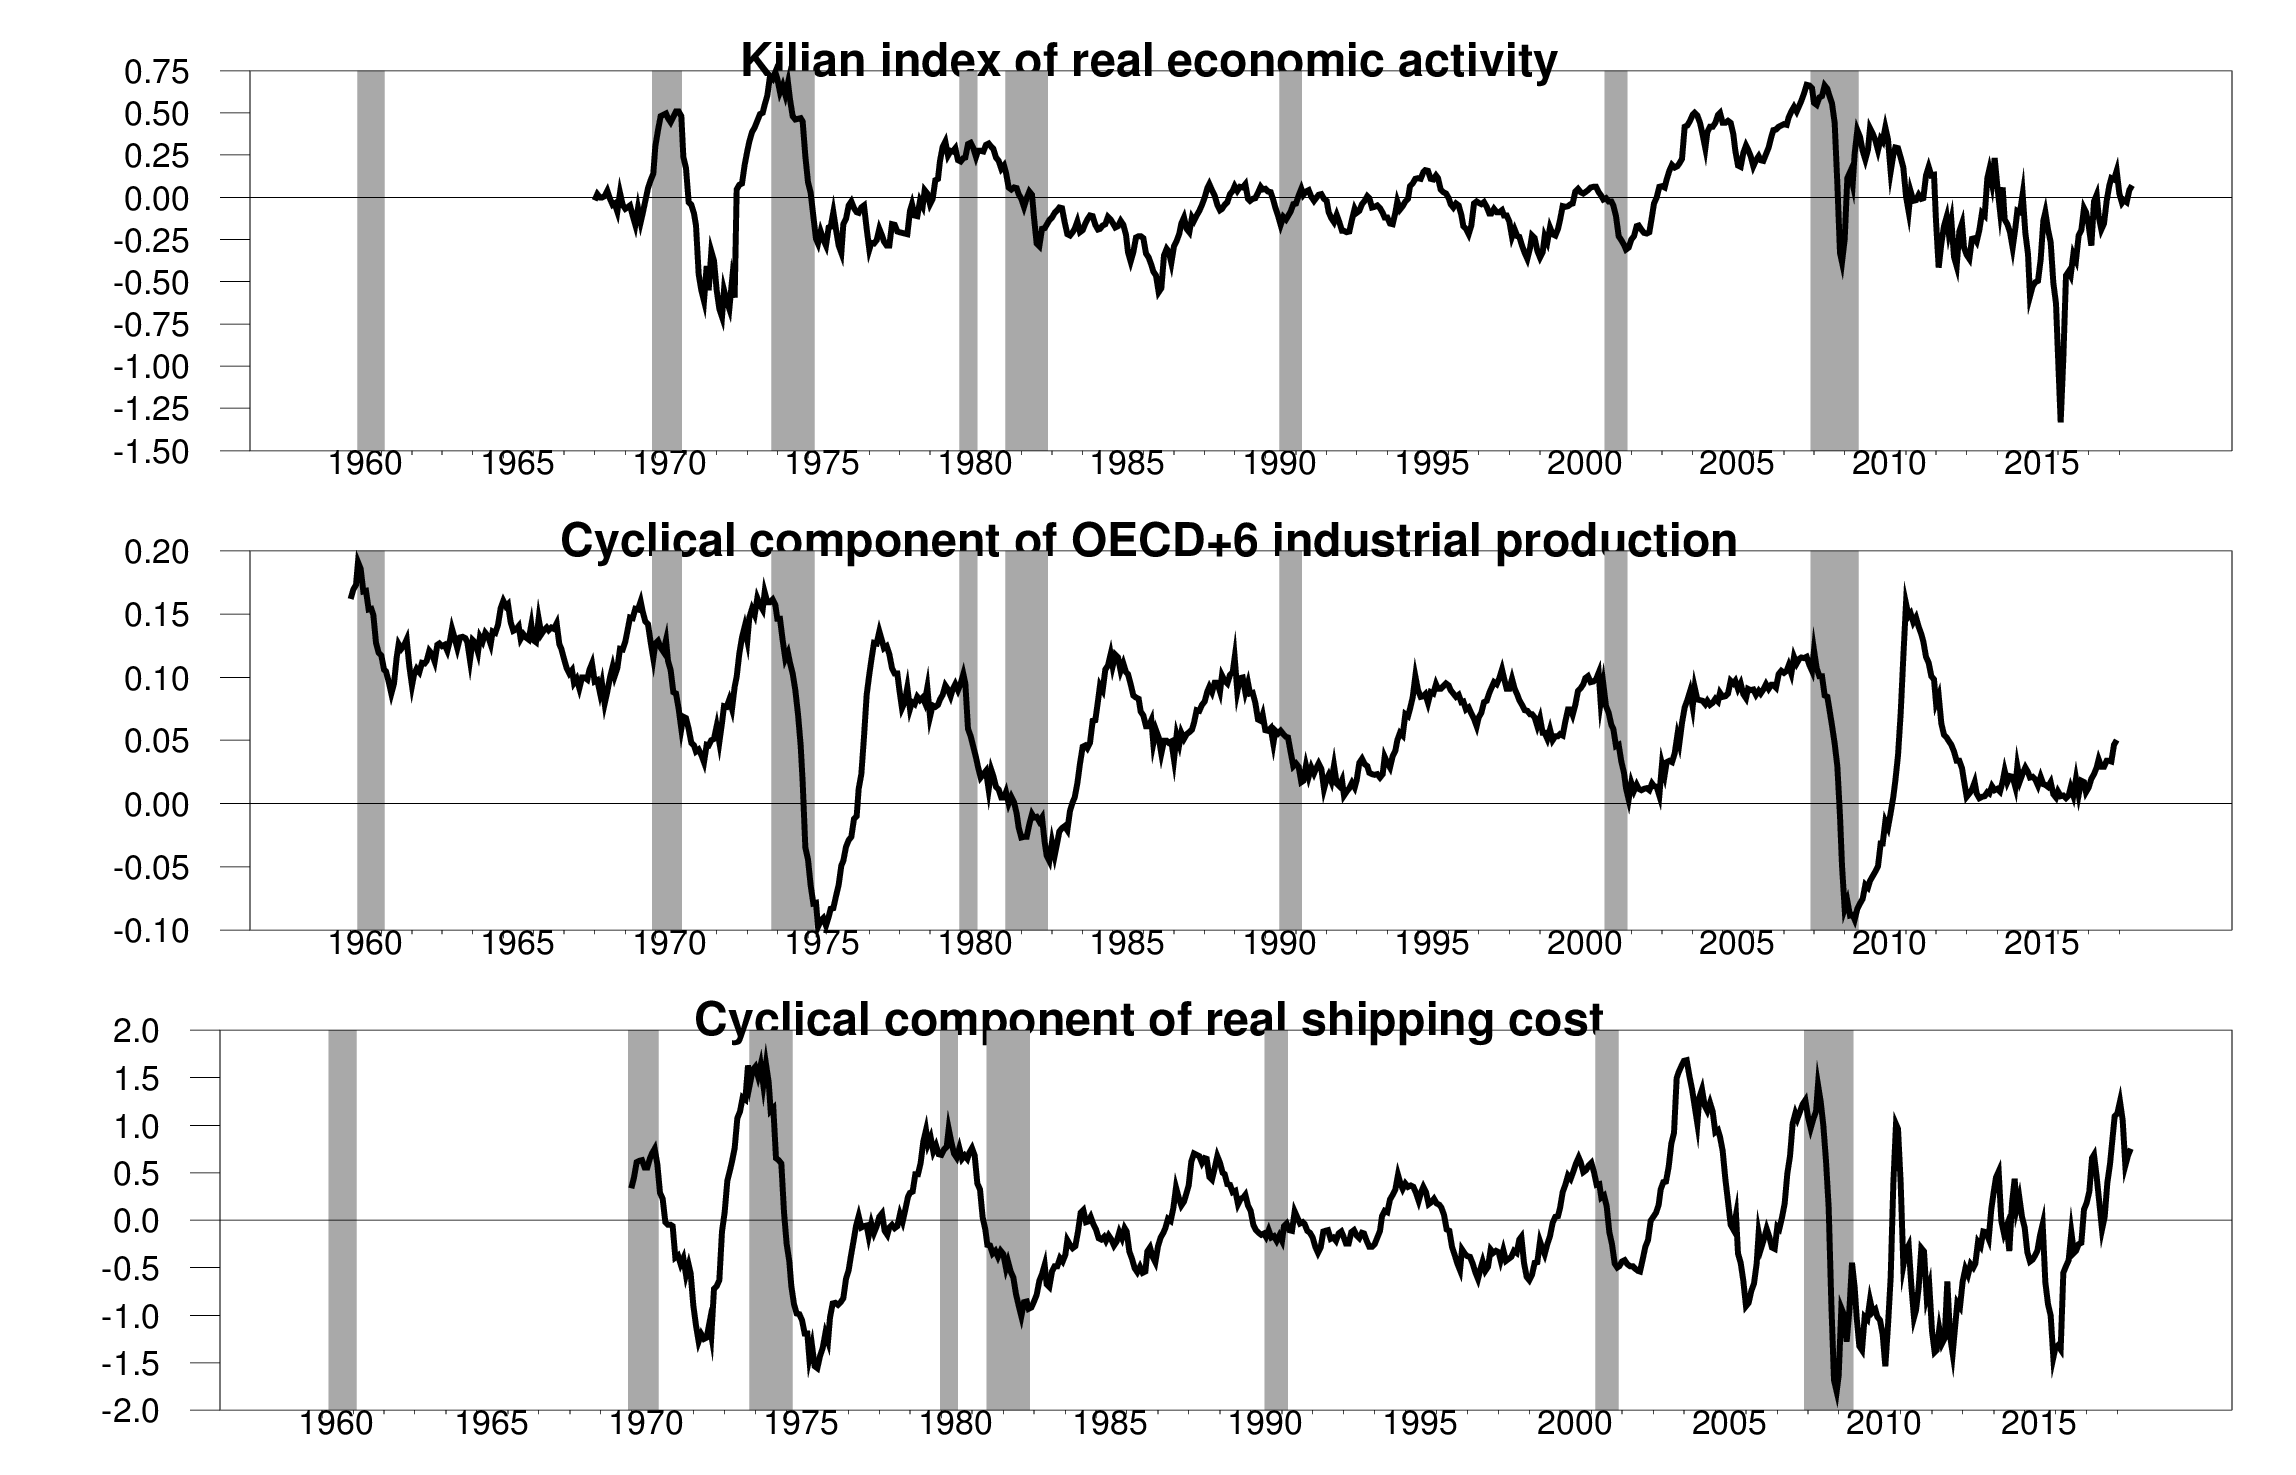
Three different monthly measures of global real economic activity, 1960:M1 to 2018:M6. Top panel: Kilian measure. Middle panel: 2-year change in log of industrial production for OECD countries plus 6 others. Bottom panel: 2-year change in difference between x and the log of the CPI. Source: Hamilton (2018).
OECD Main Economic Indicators published an estimate of monthly industrial production for the OECD plus 6 other major countries (Brazil, China, India, Indonesia, the Russian Federation and South Africa). The OECD series ends in 2011:10, but in a recent paper with Christiane Baumeister we reproduced the methodology by which the original OECD index was constructed to extend the series through 2017:12. In another recent paper I suggested that taking the two-year change in the log of a series like this is a reasonable way to isolate the cyclical component. That estimate of the cyclical component of industrial production in the OECD plus 6 is plotted in the middle panel above. Unlike the Kilian measure, this series implies that the 1974-75 and 2008-2009 recessions were the most significant downturns in global real activity during this period. The series characterizes 2015 as sluggish growth rather than a separate severe global contraction.
If one wants to use the relative price of shipping as a measure of global activity, I recommend using simply the log of the relative price instead of the double-log transformation in Kilian’s measure. Since x is already in units of a constant plus the log of shipping costs, the log of the relative price is given simply by the difference between x and the log of the consumer price index. Two-year growth rates of the latter series are plotted in the bottom panel of the figure above.
Since BDI is actually reported daily, one can use that same idea to get not just a monthly index of global real activity, but also daily, as I describe in my note. This series is plotted in the graph below.
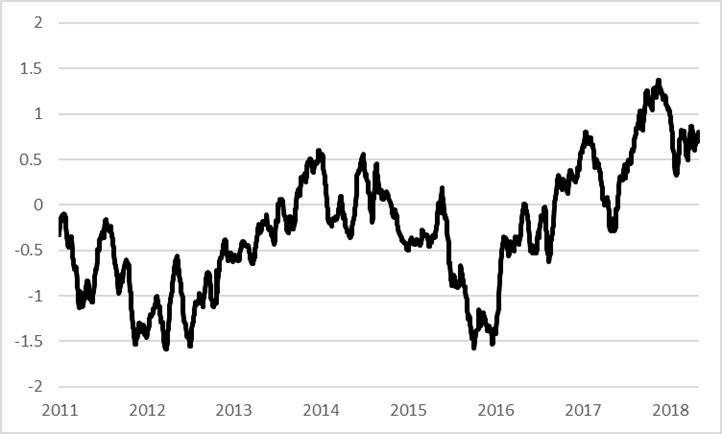
Daily cyclical component of real shipping cost, March 16, 2011 to July 16, 2018. Source: Hamilton (2018).
Data for all these series and code to generate them are available on my webpage.
Menzie is generally against using log of the log?? Isn’t this like donald trump being against 8 Russian prostitutes relieving themselves on his Moscow hotel mattress at the same time?? [Confused. Falls down to the floor into an instant coma]
(that was my attempt at humor people, what he said makes perfect sense)
I think, Jim, that events are moving past these sorts of metrics. The frontier today is big data analysis from satellites looking for real time GDP proxies country by country, or even region, on a daily or weekly basis. Boatloads of econometric analysis to be done there.
The two companies that spring to mind are Orbital Insight (Mountainview) and Ursa Space Systems (Ithaca).
Steven, curiosity garnered from my early space background, what kinds of proxies have they identified by satellite?
Night-time light data from satellites has been getting a lot of traction from economists in recent years. It doesn’t necessarily provide very high-frequency (daily, weekly) measures, but it does allow for some aggregation across countries, especially in certain world regions:
http://www.econ.brown.edu/Faculty/David_Weil/Henderson%20Storeygard%20Weil%20AER%20April%202012.pdf
So, right now I think the standard is 3 m resolution, almost 24/7 coverage — and cheap. I think that should be coming down to 1 m resolution soon. Right now, for example, they can count cars in a parking lot, but not moving cars. They can count construction cranes, and have been taking a stab at refinery through-put. And of course, you can count ships (albeit there are better methods). So, heat, light, land use and big objects or infrastructure — they can see that.
As for economics, if I recall correctly, you can put a satellite in low earth orbit for around $300k, including the hardware and launch. So the economics have changed enormously, and will continue to improve. This then allows high volume imagery leading to object recognition, machine learning and big data analysis — all done in the cloud.
So if you’re interested in aggregate level econometrics, this is where you want to be looking, I think.
Thanks, Steven, now know which type of satellite to which you were referring. You’re more than correct on launch prices coming down. That’s another testimony to the power of capitalism compared to central control. Plus we are on the verge of bringing heavy lifting costs down to or below Russian prices.
Much opportunity in space, and its becoming an international competitive venture.
Interesting post! I’ve been doing some research on the fate of the shipping companies. The weakness in the BDI may be in part due to an excess supply of ships. Shipping is a capital intensive business with a lot of volatility in their profitability which right now is at rock bottom. One can check out this Taiwanese company named Yang Ming as one example:
https://www.google.com/search?rlz=1C1GGRV_enSG790SG790&ei=qZJ0W8PhBavX0gL-l4noCA&q=yang+ming+stock&oq=yang+ming+stoc&gs_l=psy-ab.1.0.0j0i22i30k1l9.24539.27492.0.30927.5.5.0.0.0.0.216.837.0j4j1.5.0….0…1.1.64.psy-ab..0.5.837…0i131k1j0i67k1j0i10k1j0i22i10i30k1.0.ygFeVd1VXfc
Wilbur Ross had to sell his shares of a couple of shipping companies at a considerable loss. While I do not feel sorry for Wilbur, his employee PeakLoser likely does. So do not be surprised if PeakLosing starts doing some China bashing as the Chinese have built their fare of ships.
Oops. With the reference to logs thought this was certainly Menzie. Damn, I thought that was a good line too (heh). Carry on…..
Bloomberg has an interesting discussion of BDI:
https://www.bloomberg.com/news/articles/2018-02-01/decades-old-freight-index-gets-revamp-as-investor-interest-grows
If you look at BDI over the long run there’s a yu-u-uge spike in the early to mid-2000s. Are we really supposed to believe that demand for shipping spiked dramatically because of a massive increase in global economic activity? Count me as skeptical. My recollection is that the transportation folks in DoD were gobbling up every available vessel to move materiel all over the globe…and paying premium rates. So how much of the spike in the BDI was due to real economic activity and how much of it was just due unlimited Pentagon budgets?
“If you look at BDI over the long run there’s a yu-u-uge spike in the early to mid-2000s. Are we really supposed to believe that demand for shipping spiked dramatically because of a massive increase in global economic activity?”
Chart the price of oil or almost any commodity. There was an incredible commodity boom that was temporarily interrupted by the Great Recession but has sort of turned into a commodity bust. The boom was fueled by a yuuuge increase in demand from China.
pgl Well, that sounds plausible, but when I go to the OECD data base and pull up exports for the G7 plus China I’m not seeing the sharp spike that you see with the BDI data. https://data.oecd.org/trade/trade-in-goods.htm. I find it hard to believe that the number of available ships in the mid-2000s could account for the BDI spike in terms of increased volume, so traders had to be willing to pay through the nose for that marginal shipment of oil or bauxite or whatever. I can see where they would be willing to pay some premium, but the premium in the BDI just seems crazy. That’s why I’m thinking that only a Pentagon with an unlimited budget would be willing to pay such a high premium. People forget just how much materiel we shipped to the Gulf and the port at Karachi, Pakistan. One storage site in Kuwait had a CONEX yard approximately 10 square miles. Just the consumption of tires for the HMMWV required Goodyear to dedicate 100% of its European capacity to just those tires and that takes a lot of ships. And you can’t ship military hardware the same way you can stack CONEX containers full of commercial goods. Anyway, at the very least people should consider the BDI for the mid-2000s as an outlier.
You are looking at quantity of goods. When oil hit $120 a barrel, it was quite profitable to pay extra to get it shipped. When it dropped to $40 a barrel – not so much. Think of the Peak Pegagus rushing to get those soybeans into China before the tariffs hit. I bet the shipping company was paid a premium. Of course did Nobel Prize winning CoRev include that in his model? Snicker!
Pgl (fish in a barrel), snicker? You again show your ignorance. Why would the farmer NORMALLY pay shipping to China? Normally his shipping problem is getting it to the granary, but I’m sure you could find contracts with that included. Since you’re so interested, I’ll let you find and tally them for us.
“Why would the farmer NORMALLY pay shipping to China? Normally his shipping problem is getting it to the granary, but I’m sure you could find contracts with that included.”
OMG – CoRev comes up with one of patented comments that is both incredibly stoooopid and totally irrelevant. It seems he cannot help himself!
Pgl (fish in a barrel), runs away again. My model was for farmer costs using averages. you never understood that and still don’t, but make claims of stupidity for others?
How are you doing on the re-calculation of my model, or now finding contracts to support your claim. Rest assured I will not await your response.
Lord – your stupidity burns. I could care less about your “model” as it is both all over the map and beyond dumb.
I never said the farmer paid for the shipping cost and you know it (assuming you know how to read). The shipping costs could be – and in fact – are often paid by the importing entity. As in China. Let’s see – the choice of paying a premium for shipping costs versus not getting the beans there and paying around $2 a bushel.
Any sane buyer would pay extra for the shipping to avoid the tariff. But I guess in CoRev’ bizarro model, it is cheaper to pay insane tariffs than modest shipping fees.
Listen CoRev – everyone has asked you to grasp basic remedial skills before putting forth another truly idiotic comment. But I guess you cannot even understand these pleas.
Pgl (fish in a barre), there you go lying again: “I never said the farmer paid for the shipping cost…” Really? This is your comment: “Of course did Nobel Prize winning CoRev include that in his model? Snicker!” after saying this: ”
It is you who is all over the map, it is you. You never understood my model, and commented on part of it now for a couple of threads, and is the reason you claimed my farmer model should have included Peak Pegasus shipping costs. Lying is a verification of your not ever understanding my farmer-centric model. Or alternatively, you were too lazy to even read it. I lean to the lazy explanation.
With you it surely is like shooting fish in a barrel.
“You never understood my model, and commented on part of it now for a couple of threads, and is the reason you claimed my farmer model should have included Peak Pegasus shipping costs.”
Your model pretends all one has to do is to look at the supplier with no consideration for the buyer. As I noted – the buyer may be paying for the shipping but in any well specified demand = supply model, who is invoiced this expense has no net effect on the equilibrium.
The problem with your dumbass model is it pretends you can figure out the competitive equilibrium by looking only at the supply curve. Every one with even the most remedial training knows that is beyond insane.
So it is your who has no clue what your model is besides being the dumbest thing ever concucted!
Pgl (fish in a barrel) you just clarified, again, you never understood my farmer-centric model: “The problem with your dumbass model is it pretends you can figure out the competitive equilibrium by looking only at the supply curve. Every one with even the most remedial training knows that is beyond insane.” It answers the one question posed now for months, has the soybean farmer yet lost money on the 2018/19 crop with the tariff caused price reductions?
Only dumbass economists worry about generalities like or even use terms like: “competitive equilibrium by looking only at the supply curve”. While a farmer has to worry about how much is in his bank account to pay his latest bill. How often farmer would a farmer consider: “Competitive equilibrium theory can be considered as a specialized branch of game theory that deals with making decisions in large markets. It is used extensively to analyze economic activities dealing with fiscal or tax policy, in finance for analysis of stock markets and commodity markets, to study interest, and exchange rates and other prices. It serves as a benchmark for efficiency in economic analysis. It relies on the assumption of competitive markets, where each trader decides upon a quantity that is so small compared to the total quantity traded in the market, such that their individual transactions have no influence on the prices. Competitive markets are an ideal, and a standard by which other market structure are evaluated.”
Farmers are well aware of where they fit in the economic activities of their commodity supply function, and their analysis is far more specific and detailed to that supply function. They have little control ove4r the demand function, and NORMALLY except for local issues have little need to worry about final delivery where you ignorance first placed him responsible for calculating costs.
Always arrogantly blaming others for your own ignorance coupled with the personal attacks based upon that same ignorance is your common fault.
Please get a clue or this continued barrel shoot will continue.
“CoRev
August 18, 2018 at 4:11 am”
Blah, blah, blah. Lord you do get paid by the word. Another long ramble that proves only one thing. You are incapable of doing economics.
Trump canceled his military parade when he saw the enormous cost. If they are paying you by the word (even a penny a word) they are being regally ripped off.
CoRev, if you took your foot out of the barrel then you can stop the “barrel shoot”. pgi has no control over you taking your own foot out of the barrel before you shoot.
https://www.youtube.com/watch?v=dQBhUzEsO-Y
Pgl (runmning away, fish in a barrel and jerk) runs away after again after this request: “How are you doing on the re-calculation of my model, or now finding contracts to support your claim. Rest assured I will not await your response.”
With this unrelated and meaningless response: “Blah, blah, blah. Lord you do get paid by the word. Another long ramble that proves only one thing. You are incapable of doing economics.
Trump canceled his military parade when he saw the enormous cost. If they are paying you by the word (even a penny a word) they are being regally ripped off.”
Regrettably, this represents the liberal mind, mush, anger, and unrelated idiocy.
Professor Hamilton,
The link “my note” did not work for me.
“Since BDI is actually reported daily, one can use that same idea to get not just a monthly index of global real activity, but also daily, as I describe in my note. This series is plotted in the graph below.”
AS: Thanks! Fixed now.
Perhaps this is the proxy you’ve been seeking: https://www.gocomics.com/ziggy/2018/08/16
Ziggy is simply lamenting all those “economic” reports being put out by the Team Trump NEC and CEA!
pgl,
I think you misinterpreted Ziggy. He was generating more garbage because he was spending more; he was spending more because: https://www.bloomberg.com/news/articles/2018-08-09/u-s-consumer-comfort-rose-to-new-17-year-high-on-economic-views
Sometimes negativism is a form a garbage, too. But not in Ziggy’s case.
the double log seems to be troublesome as certain ranges of numbers push the result towards the negative infinity. this would imply as a minimum, the logBDI + C0 term must be greater than 1 to keep control of the second log calc. since this is empirical in nature anyways, does Kilian have any notions about restricting the allowable ranges of C0 to avoid this singularity?
Dear Folks,
I am not a fan of this use, even though I grant you I lack much better than to examine the data the IMF or World Bank produce, etc. My reason is that world shipping costs as an indicator depends crucially on the number of ships or at least shipping space remaining relatively constant. Suppose, however, the number of Panamax ships increases, while the number of small ships (such as Vietnam uses to ship coal to China) decreases. Shipping costs will increase, because the opportunities available for sending freight have decreased. You may get increased shipping from the West, say the U.S., on the Panamax ships, but production from the smaller countries like Vietnam goes down, since they are priced out of the market. The net quantity of worldwide goods produced can easily be the same or less. The shipping costs measure an increase in prices, granted. But that only works as a measure for increased output – demand – if supply stays roughly the same, and here (shipping) supply has decreased.
Julian
Professor Hamilton,
I have a question about monthly changes in any economic statistic, whether it is international economic activity or housing starts as released today. I am interested in your thoughts.
Each month as data are released, we are informed by media that a particular statistical release is either better or worse than the mean forecast of economists. Today housing starts data were released. The July 2018 actual SAAR level was reported at 1.168M units. The July SAAR 2018 change increased +0.9% from June 2018. The consensus forecasted change as reported by Econoday was forecasted to increase at about +10% from the revised June 2018 SAAR level of 1.158M units to 1.271M SAAR level units for July 2018.
However, at the bottom of the U.S. Census Bureau report a footnote (as shown below) indicates that we cannot conclude that the housing starts change is different from zero since “the 90% confidence interval includes zero”.
Yet it seems that the business community and media ignore the Census Bureau footnote when reporting the actual monthly results.
Census Bureau Report Footnote:
08/16/2018 08:30 AM EDT
Privately-owned housing starts in July 2018 were at a seasonally adjusted annual rate of 1,168,000. This is 0.9 percent (+/- 11.5%)* above the revised June 2018 estimate of 1,158,000.
July 2018: +0.9* % change
June 2018 (r): -12.9 % change
(*) The 90% confidence interval includes zero. The Census Bureau does not have sufficient statistical evidence to conclude that the actual change is different from zero.
AS: Difficult number to interpret. Before the July number we knew June starts were 1173. We now learn that even though July at 1168 is up from the modestly downward revised June number, July is in fact below where we thought housing was a month ago. This would be so no matter how low the June number were to have been further revised downward. Suppose it were revised so much that the July 1173 was up from that downward June revision by such a percentage increase that zero was not contained in the July 90% confidence band. Going by statistics, you’d then have said July is up. However going by common sense, which in general (though not always) is more important than any statistic, you’d still say the newest piece of information is below the last one. Hence no matter what, with this July print of 1168 the market is weaker than we had thought.
Take the original May number of 1350, up 5% from the revised April 1286. Which in a confidence band of + or – 10.2% is not significantly different from zero. Going by the statistics, you’d have had to say that the housing market was no different than what we thought it was a month ago. Going by common sense, however, we would have confidently said that the market is up big. Looking back, starts at 1350 as of May are on their expansion high! Market as of the May number stronger than we thought a month ago no matter the confidence band.
There is still more. Permits lead starts by a month. Hence we have additional information which should be melded in. Permits-starts are a unique twin nova amongst economic time series. Starts over a recent lengthy period tend to be about 85% of permits plus 200. Starts fell in a hole in June and July for some reason. (We could look further still and perhaps discover why.) Hence based on the latest permits of 1311, the market is not so bad as the above would lead us to believe. Nonetheless, on the margin I’d say the latest starts number should be entered as a thumbs down not a mere neutral.
In even larger context, starts are still in a bull phase since household formation is now on the rise. Household formation is on a solid upward trend since its trough in 2009. Also, formation and starts are still well below their pre-crisis average. Moreover, there is something difficult to measure but very real known as pent-up demand. It is operative here at the current moment in the housing market. And to further confirm, homeownership is also rising year-over-year after its many year tumble due to the collapse of home prices. We can even surmise that the fertility rate is on the rise, though the data lag badly. This because the statistical mill is unable to capture the births instantaneously recorded and tabulated in hospitals until a year or so later. Maybe the phone lines are down.
In conclusion, context is always important. Context is a main underlying feeder of common sense. An even higher order component of the overall context at the moment is the uniformly pro-growth policies of President Trump that will be pressed forward on all fronts with great vigor in coming years.
JBH,
Thanks for the comments. Also, apologies to Professor Hamilton, for being off topic. My concern was beyond housing starts. I was wondering if we are collectively making decisions about the changes of data percentages, when, in fact, the changes are not statistically different from zero for a given time period.
Steven, as to the use of satellite data, we need long time spans of data to study the effects of oil demand and oil supply shocks and it will be a long time before enough satellite data are available to do such analysis.
As to the shipbuilding and scrapping cycle, I recommend the following paper which examines this issue and other issues of interest related to shipping indices:
http://www-personal.umich.edu/~lkilian/jimf_publication.pdf.
As to the substance of the original post on the Kilian index of global real economic activity, see my reply below:
http://www-personal.umich.edu/~lkilian/kilian_correction.pdf
Lutz Kilian
Hmmmmmmm…….. not going to say it.
Ok, I’m going to say it (you know I can’t stop myself). This smells strangely similar to Kenneth Rogoff’s “coding error/spreadsheet error”. As in—- a screw up.
Wouldn’t it be better to put the corrected Killian index graph on top of the series with the 2-year change in the log, than to compare it to the original with the error, (as you do in your response)??
What is the main explanation for the Killian Index making 2015 look worse than 2008??
At least he acknowledged the coding error:
“Hamilton (2018) suggests that the Kilian (2009) index of global real economic activity is misleading and calls for alternative measures. The problem documented by Hamilton is a consequence of a coding mistake. Specifically, the index of nominal freight rates underlying the Kilian index was accidentally logged twice. Once this coding error is corrected by removing one of the log transformations, none of the concerns raised by Hamilton remains valid and the index may be used as originally intended. Moreover, it can be shown that the corrected index differs only slightly from the original index.”
That JIMF paper looks like an interesting contribution.
@ pgl
Out of respect to Jim and Professor Chinn, I’m not going to tell you my thought on that at the moment. Kilian deserves a chance to respond. Jimmy Swaggart was “sorry” after he was caught. But did JImmy really “come clean”?? Over time, people will see something for what it is, and some people need to come to terms with that.
One has to wonder who the AER relied on as referees. Had Dr. Hamilton been a referee, the author would have had a chance to correct the coding error before this paper was published.
I doubt I would have caught this as referee. It was a subtle error. Kilian thought of x as a nominal index, and thought the correct thing to do with a nominal index was to divide by the CPI to get a real index and then take logs to get a log of a relative price. Although my write-up makes the issue transparent, it’s not obvious that was what was going on until you really got into the algebra. No one had noticed prior to my note that recent values of x were simply the log of the BDI plus a constant. One problem is that the procedure was not adequately described in the original article– he never wrote down the equations that appear in my note. But the bigger problem is that Kilian refused to share the value of x with other researchers so that they could replicate the construction of his index. He would share the index, but not the details of how it was derived. If he had shared the value of x with other researchers (and I know many people who have asked him for this over the years, including me), someone would have discovered this error years ago. It was only when I tried to recover the underlying x from the index that he publishes that I recognized the error he must have made.
Regrettable, this is a common problem in today’s science: ” But the bigger problem is that Kilian refused to share the value of x with other researchers so that they could replicate the construction of his index. He would share the index, …” part of his data but not all/enough to replicate.
I have watched this for years in Climate Science by some of the biggest names in the field. Michael Mann’s famous temperature hockey stick is one of the more famous examples.
I agree, Lutz, that not all time series are the same. However, the point of using the BDI or other indicator is to try to get a more real-time assessment for GDP. After all, GDP is published in most countries with a few months of the close of quarter, and with some reasonable accuracy, within a year or so. Thus, BDI is an inferior metric if we are speaking of any substantial time lag. We’d just rather use the GDP data in most cases.
So what we’d like is something more real time, and the advantage of BDI is that you can check any time of day, like oil prices and futures. We’d like to use that to make inferences about current or short-term economic conditions. So we’d like to something like the Altanta Fed’s GDPNow and the NY Fed’s GDP Nowcast and both make them more accurate and extend their reach globally.
And that’s happening, with a variety of remote-sensing options popping up. I encourage you to engage with these new sources, because that’s where the game will be played, and relatively soon.
I am happy to make an introduction to either Orbital Insight or Ursa, both of whom I know.
Additionally, if you’re interested in shipping, I’d note that ships are equipped with transponders and these can be tracked via the internet. I believe the best for oil markets data is ClipperData, where Matt Smith heads research. They use the AIS (transponder) data to track vessels real time and couple that with their own algorithms (it’s more complex than you might think) to forecast shipments in real time. Matt is a wonderful guy and a very knowledgeable expert, and well worth getting to know if you want to learn more about this database. Again, I am happy to make an introduction.
I think the broader point, however, is that remote sensing and data processing is going through a revolutionary period, and I think economists need to be actively engaging with these companies. A number of them will be willing to provide you free and open access to their data to help them build a usable product.
The details of the construction of the Kilian index have been available upon request since 2009 and have been shared with and vetted by numerous central banks, international organizations, government institutions and academic researchers.
Jim never requested these details from me. He requested the underlying raw data for the nominal shipping rates. Since constructing these data by hand from the original hardcopy sources required considerable effort, I treat these data as proprietory. Of course, anyone is free to reconstruct these data from the publicly available sources provided in my 2009 article.
Finally, some of the previous commentators seem to have missed the fact that the corrected index looks quite similar to the original index. There is no reason to expect the substance of the findings in the 2009 AER paper to change.
I hope you and Dr. Hamilton sort this out. Your 2009 paper was differently interesting as was your JIMF paper. So please keep up the great research but please don’t get too defensive as I would not want this to turn into that Gerald Friedman/JW Mason affair.
What ever became of this?
https://www.jstor.org/stable/1806061?seq=1#page_scan_tab_contents
Replication in Empirical Economics: The Journal of Money, Credit and Banking Project
William G. Dewald, Jerry G. Thursby and Richard G. Anderson
The American Economic Review
Vol. 76, No. 4 (Sep., 1986), pp. 587-603
When asked about the “hard landing” as he was lifted into the ambulance, the gentleman said “I don’t know what everyone is excited about. The second parachute looked the same as the first parachute”.
https://www.youtube.com/watch?v=iwku5Alsi04
“Since constructing these data by hand from the original hardcopy sources required considerable effort, I treat these data as proprietory.”
if you constructed the data by hand on your own time, you have a point. but if you constructed the data under support from a grant or university support, it is not appropriate to claim this data set is proprietary and yours. and in the modern research world of data transparency, your response would be considered lacking. in particular, nobody can validate that the numbers you used in your analysis were accurate (no transcription mistakes).
My neighborhood has this character a lot like CoRev who just sold his house for $1 million to a lovely couple (my neighbors are elated that el jerko is leaving). Of course the selling broker and the buying broker will each get a $25,000 cut with el jerko netting $950,000.
Here is the amusing part. Just like CoRev’s latest stupid tirade, el jerko said the seller should never pay the broker commission. Thank God – the two brokers were not as stupid as el jerko. They decided to tell the buying couple to pay their fees in exchange for writing a check to CoRev (sorry I meant el jerko) for $950,000.
Anyone with an IQ above 50 knows that the result was the same. But not el jerko and apparently not CoRev! The neighborhood will be so much better off without such stooopid jerks!
Pgl claims: “el jerko said the seller should never pay the broker commission. Thank God – the two brokers were not as stupid as el jerko. They decided to tell the buying couple to pay their fees in exchange for writing a check to CoRev (sorry I meant el jerko) for $950,000.” I see now you claim to be an expert in Real Estate law. If that really happened, his stipulation was in the listing contract, and your not lying again, the seller may have grounds to sue the realtors and the realtors to be subject to ethical violations.
/sarc But this is NY, and we know how New Yorker’s march to a less legal beat. I mean NY gave us this President. /sarc There I highlighted the meaning for you pgl.
No I am not claiming you are an expert in real estate law. Try READING what I wrote. I said you are one stupid jerk. And you cannot even grasp this simple truth?! Just wow!
Pgl, (fish in a barrel and stupid jerk), it was your example that was stupid. Just because you think everyone believing differently from you is stupid is not their problem, but yours. You prove, many times over, that you do not at all understand the transactions required in your models and theory based economic world.
Your example described a classic ethics , but you’re a liberal and ethics is not in your vocabulary no consideration when making angry and irrational points.
Only pgl’s view point has any meaning? Your arrogance is breathy taking!
h taking.
This is from someone who claims that farmers cannot control the market price, they do not suffer when it falls. Yes – we have a new winner from Stupidest Person Alive!
Pgl (fish in a barrel and a jerk), as I have said many times you are clueless. Please quote my comment which said: “This is from someone who claims that farmers cannot control the market price, they do not suffer when it falls.” I won’t wait, because I am positive you will do another runner.
BTW, from your comment: “This is from someone who claims that farmers cannot control the market price,…” amazingly you obviously think farmers do control the market price. Wow, and you call others stupid.
“You never understood my model, and commented on part of it now for a couple of threads, and is the reason you claimed my farmer model should have included Peak Pegasus shipping costs.”
There CoRev goes again! In any properly specified demand = supply model things like transportation costs and tariffs would be factored in.
But CoRev’s sophisticated model includes neither. Maybe this is why the AER is not publishing it. Of course those referees at the AER do not understand CoRev’s sophisticated model. You see he has figured out how to determine equilibrium prices and quantities without a demand curve. Simply look at the supply curve and it is all there – at least in his mind. I tell you – the man is a GENIUS!
Have you looked at the work by the Netherlands Bureau for Economic Policy Analysis on world trade volumes and world industrial production.
http://www.cpb.nl/en/figure/cpb-world-trade-monitor-may-2016
Because trade is so critical to the Dutch economy they keep a running estimate of both that is only a few months out of date. They use it extensively in their analysis of the Netherlands economy.
In my work I long ago decided not to use data on shipping rates as a proxy for world economic growth. Interestingly, researchers at Fidelity reached the same conclusion.
Rather I have used the CRB index of industrial raw material prices that does not include energy prices. It has a great record of signaling when to buy and sell oil stocks in the stock market. Needless to say it is also a good bond market indicator.
Note I have a new email address
Groningen University has some unique numbers on trade, which I dare say, you couldn’t find anywhere else.
http://www.wiod.org/home
The GVC data is a little dated because it takes so long to tabulate. But combined with more short term data I think could help visualize the future economic picture—whether related to Trump’s anti-trade mess or other world trade events.
To all those who expressed an interest in the replicability of published research, I now had a chance to re-estimate the regression models in Kilian (AER 2009) based on the corrected index. The results about the historical evolution of global oil demand and oil supply shocks, about the responses of the real price of oil to these shocks, about the determinants of the real price of oil, and about the effects of global oil demand and oil supply shocks on U.S. real GDP and inflation are extremely robust to this change. In fact, in most cases, the reader would be hard pressed to even notice the difference.
@ Professor Kilian
Wouldn’t it be better to put the corrected Killian index graph on top of the series with the 2-year change in the log, than to compare it to the original with the error, (as you do in your response)??
What is the main explanation for the Killian Index making 2015–2016 look worse than 2008??
I’m probably talking above my pay grade here. But it seems to me, there is something in econometrics called “specification error”. That is when a person sets up his model wrong or there is bias in the model. Now when someone does this, I don’t think it should be termed a “coding error” or a “spreadsheet error”. To me—the rank amateur, yes—that comes across as a cop out by the person who set up the model wrong. It wasn’t the “code” or “spreadsheet” that chose how to set the model up (wrongly), it was the person.
In addition, the problem to me seems not just to be the double log but also the lack of a two year “normalization” (not sure the correct terminology, it seems like changing the period of the base year). And if that missing two-year normalization (or a normalization on a shorter time span) is not put into the Kilian model, it is still not as accurate as it could otherwise be.
It would appear a certain Michigan prof’s EGO is very, uuuh,”robust” to the idea something he has done could be made better.
CoRev decided to attack Michael Mann as if this distinguished researcher is somehow a fraud re Climate Change. Mann is not a fraud but CoRev is pushing the right wing fraud known as ClimateGate. If you are unclear what this is about – this will help:
https://www.theguardian.com/environment/2010/jul/07/climate-emails-question-answer
CoRev probably was paid by his masters for this smear. Did CoRev inform him that this smear is a fraud? I guess CoRev will tell any lie for money. Or maybe they lied to CoRev figuring he is too stupid to check out reality.
And let’s not forget CoRev’s latest lie: “amazingly you obviously think farmers do control the market price.”
I never said any such thing. But least I know that it is the buyer’s demand curve and the seller’s supply curve that matters. Alas CoRev cannot get beyond the supply curve even as he misses completely the fact that economist costs exceed accounting costs by things we call opportunity. CoRev thinks he is shooting fish in a barrel but the fish laugh at his complete incompetence!
Pgl (fish in a barrel, jerk) now you want to change the subject to Climategate? No, I’m not going to bite!
You were the one who earlier smeared Michael Mann. Oh wait – there are two CoRev’s here. That must be why you write such contradictory BS.
Smeared Michael Mann? Telling the truth about his refusal to provide the needed data to actually REPLICATE and not re-create his results is smearing?
I will not respond! Good day to you.
plenty of independent studies have come out with similar conclusions to mann’s work. not sure what the huffing and puffing is all about.
“plenty of independent studies have come out with similar conclusions to mann’s work. not sure what the huffing and puffing is all about.”
Baffling read what I posted. CoRev did not. Of course we all have realized that CoRev only reads what he political masters allow him to read.
This issue brings up a few issues regarding academic research. The initial version of Hamilton’s note is dated August 15. On August 16, Kilian replied with an academic paper:
“It can also be shown that the empirical results in Kilian (2009) about the historical evolution of global oil demand and oil supply shocks, about the responses of the real price of oil to these shocks, about the determinants of the real price of oil, and about the effects of global oil demand and oil supply shocks on U.S. real GDP and inflation are extremely robust to this change.” (Kilian, Reply, August 16, 2018)
Kilian posted on this website on August 16, 17 and 18. On August 18, Kilian tells us
“To all those who expressed an interest in the replicability of published research, I now had a chance to re-estimate the regression models in Kilian (AER 2009) based on the corrected index. The results … are extremely robust to this change.” (Lutz Kilian August 18, 2018 at 6:38 am).
This seems to suggest that Kilian’s formal “Reply” on August 16 made claims about robustness that he had not yet substantiated.