Some people are getting a little spooked by recent stock market movements. Here I offer a few thoughts.
Although there has been a dramatic drop in the S&P500 since October, the market had been up pretty significantly from the start of the year up to that point. As of Friday, the net change between the start of the year and now has been inconsequential.
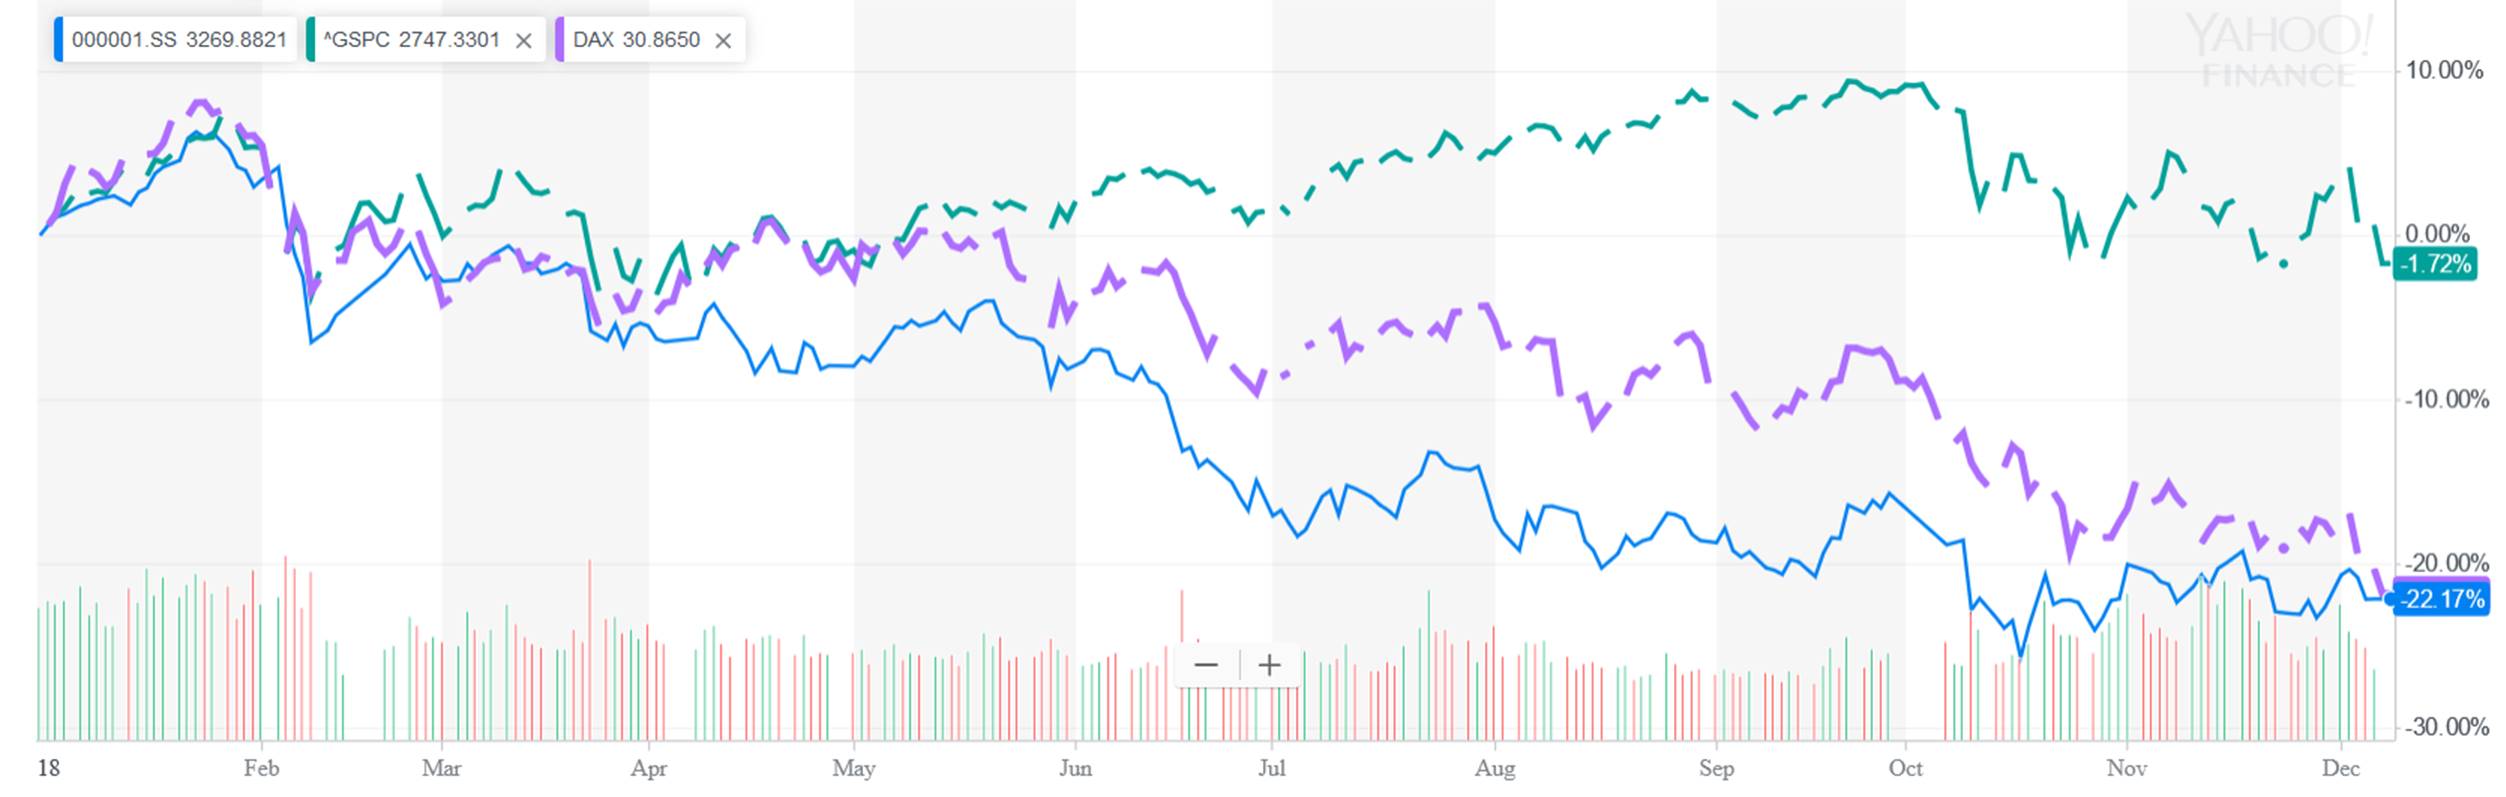
Cumulative change since start of year of U.S. S&P 500 (green), Shanghai composite (blue) and German DAX (purple). Source Yahoo Finance.
If somebody should be worried, it should be the Chinese or Europeans, where the drop in stock prices so far this year has been fairly painful. One interpretation is that bad news for them is finally catching up with the U.S.
It’s interesting that the rise and fall in U.S. equity prices this year paralleled that for the 10-year Treasury yield. That also had been climbing significantly during the year, only to drop dramatically the last few months.
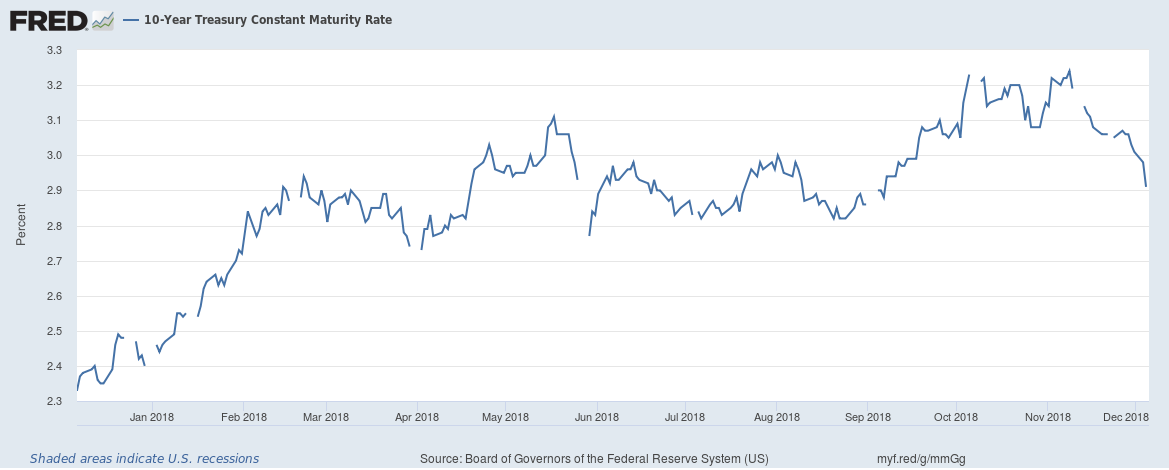
Interest rate on 10-year U.S. Treasury bond. Source: FRED.
Other things equal, lower interest rates would usually mean higher stock prices, because it means future dividends and earnings are less significantly discounted. When instead interest rates and equity prices move together, as they have been, it suggests that some third factor is driving both yields and stock prices. One possibility is that the U.S. fiscal stimulus both raised long-term real interest rates as well as near-term real growth forecasts earlier this year. One outcome I anticipate as a result of the recent U.S. election is less fiscal stimulus, which would bring both stock prices and bond yields down from earlier highs.
There are some other measures that raise some concerns. New claims for unemployment insurance are one of the best leading indicators we have, and those have been inching up. But again, that’s mostly noticeable because of the long previous decline.

4-week average of initial claims for unemployment insurance. Source FRED.
Some analysts are darkly warning of a recession some time in the next two years. Not a particularly brave (or worrisome) forecast, that. If in any random month since 1947 you’d declared that the economy would be in recession some time in the next 2 years, 43% of the time you’d have been right. Perhaps the probability is a bit above that right now. The truth is that stuff happens– always has, always will. But exactly when we’re going to experience our next recession, no one knows at this point.
None of that is to deny that further sharp drops in U.S. stock prices are quite possible, even if there’s no new bad news. The reason is that stocks are so richly valued relative to earnings compared to historical norms. Below is an update of one of the graphs from Yale Professor Robert Shiller’s very long-term data set to which I’ve often referred. The green line is a price-earnings ratio on the S&P500 or earlier counterparts. So as not to overstate the impact of temporary spikes up or down in earnings, Shiller relates the current inflation-adjusted stock price to the previous ten-year-average of inflation-adjusted earnings. That backward-looking P/E currently stands at 30.6, well above its average value of 16.9 in data going back to 1880. If we return anywhere near historical averages, it would mean a huge drop in stock prices.
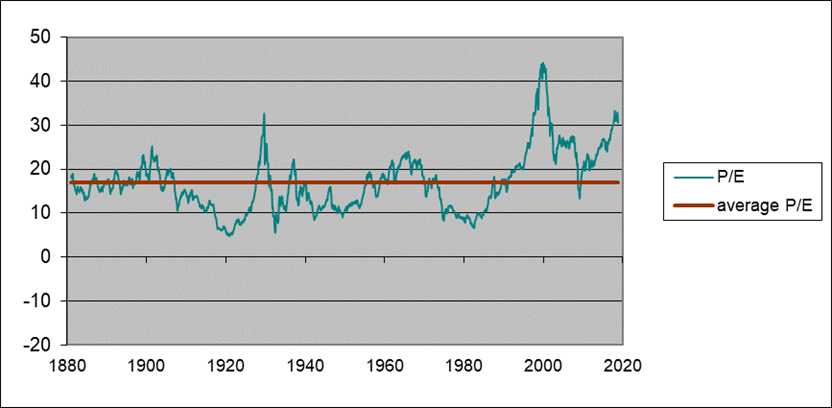
Green line: Ratio of real value of S&P composite index to the arithmetic average value of real earnings over the previous decade, January 1880 to Dec 7, 2018. Red line: historical average (16.9). Data source:
Robert Shiller
“Shiller relates the current inflation-adjusted stock price to the previous ten-year-average of inflation-adjusted earnings. That backward-looking P/E currently stands at 30.6, well above its average value of 16.9 in data going back to 1880. If we return anywhere near historical averages, it would mean a huge drop in stock prices.”
Of course his metric attempts to capture values relative to some long-run estimate of cash flows but isn’t adjusting for the cost of capital. I would argue we are in an era of low costs of capital but then Trump’s fiscal folly could change all of that.
Kevin Hassett back in 1999 predicted that the DOW was about to hit 36000:
https://www.amazon.com/Dow-36-000-Strategy-Profiting/dp/0609806998
It was around 12000 then and Shiller thought it was overvalued – not undervalued. Anyone want to guess what the DOW did in 2001?
OK it is now 24000 as earnings about twice what they were in 1999. DOW 72000 anyone? Yes I cannot wait for Hassett to comment on all of this in terms of the 2018. I’m sure Shiller will have a good laugh!
“stuff happens”?? Menzie, I have tried so hard to get my blog comment degeneracy to infect you and I can see it’s time to re-double my efforts.
https://www.youtube.com/watch?v=cyLdtG7KZvw
The old school rule on P/E ratios used to be about 12–15. And if you had one below that that wasn’t playing games with accounting, you were pretty well set (or at least that was a good starting point/litmus test to then check the other numbers). That was a great way to filter out your list of potential investment candidates—even before they had websites and software to do that. Doubt we will see those days return unless we have another 2008 style crash, and even then I have my doubts.
As a finance major/ degree holder I should have something deeper to say on all of the above. Sadly…..
MOses,
This post is by Jim Hamilton, not Menzie. The Shiller index differs from garden variety P/E ratios.
My apologies to Professor Hamilton for the misidentification and not paying closer attention to the author of the blog post. I don’t recall making any statement on Shiller, just market P/E ratios in general.
Is anyone aware of any studies comparing distant past earnings with current earnings considering all the FASB rulings over the past years that perhaps reduce earnings? As FASB rulings perhaps reduce earnings, investors may be willing to pay more for shares today, compared to the distant past. One such earnings reducing FASB is the requirement to expense employee stock options. Another example concerns various changes in how pension and benefit costs are expensed.
@ AS
Just a general comment without wanting to grab half a dozen links. This is in no way meant to be critical, just hopefully helpful.
Most of the sharper accountants I read believe that FASB has lowered their standards or “loosened” their standards over the years (standards of GAAP etc). My understanding is that FASB does not have the authority to enforce rules either, only set the rules. GAAP rules have gotten weaker over an extended period of time, and therefor, I would argue, inflates earnings or at least inflates earnings as compared to prior years. Therefor (and this last part may be more a subjective opinion on my part) investors should actually be willing to pay less for shares (or unwilling to pay more). Now, obviously as Professor Hamilton’s sage-like post shows, my “take” on it does not agree with current equities market “culture” shall we say. Your question is still an excellent question and it speaks well of you that you ponder such things.
Moses
If public companies do not comply with GAAP, then it is very doubtful that auditors will issue an unqualified opinion. I can’t opine on all FASB pronouncements, but accounting for employee stock options, pensions and post retirement benefits have become much more stringent in the past few years compared with the past.
Moses,
Regarding GAAP, Congress has authority regarding accounting for public companies, which Congress delegated to the SEC. The SEC delegated GAAP to the APB which flowed to the FASB. The SEC, however, retains the right to increase GAAP requirements for public companies, if the SEC does not consider GAAP to be sufficient in some area.
“If public companies do not comply with GAAP, then it is very doubtful that auditors will issue an unqualified opinion”. Yep – just ask Arthur Andersen! You are also right about expensing employee stock options but note that took 30 years to get right.
There have been studies (which I have lost track of, so can’t link to) which adjusted P/Es for other forms of return, such as excess return from buy-backs. Once that is done, the S&P at hits high P/E was still moderately high, but in line with other major stock indices around the world. Using standard P/Es, the S&P has been substantially over-valued against the rest.
Aren’t there half as many publicly traded companies now compared to these prior periods?
Lots more money around, fewer of these things to buy, and more ability for more-concentrating corporate American companies to control their pricing, labor costs and margins. Throw in the non market, non business factors that come from the tax cuts, artificial but further empowering – why is anyone surprised by P/e per share measures. And why do they compare today, with periods where none of this applied?
At least comment on these fundamental differences.
yep, under most most measures the US stockmarket is over valued.
what worries me is IF, and I did say IF, the US gets into a recession there is no possible fiscal response. bot when the Structural deficit is 6% of GDP.
For those of you who are blog addicts, ZeroHedge has a ton of stuff up tonight. Maybe because the oddball behavior of markets, the news cycle, and the France mess?? But it’s been a LONG time since ZH had this much stuff up (and good content) on a Sunday night. If you’re not a blog addict maybe you can skip it. If you miss the “glory days” of blogging I recommend heading over to “ZH” and diving in. Some of it is fun stuff. Only you can decipher. The PeakIgnorances can chase the garbage and chase their own tail–if you’re sharp you can ferret out the good stuff. Happy hunting.
What might have changed? Can anyone remember what might have happened in early November to trigger this drop? Anyone?
CoRev The drop didn’t start in November. The most recent drop started in early October. And the election results closely matched what had long been expected, so I don’t see any new news event that wasn’t already anticipated by a rational expectations agent. Oh wait…you have problems understanding the notion of rational expectations.
Among the many things CoRev is incapable of doing is taking a look at this link which shows us a nice chart of the historical S&P 500:
https://finance.yahoo.com/quote/%5EGSPC/
Hey CoRev – you should also purchase a calendar. The market started dropping right after September 17. A full seven weeks before the elections.
2slugs & pgl, bwa, ha, ha I expected nothing less than your responses: 2lugs: “The most recent drop started in early October. ” and pgl: ” The market started dropping right after September 17.”
YUP!!! The market was reacting to election predictions as early as Sept. and 2slugs was wrong again.
https://abcnews.go.com/fivethirtyeight/video/fivethirtyeight-house-forecast-update-sept-2018-57624651
CoRev Did you even read the fivethirtyeight graph??? The projection for the Democrats taking the House in October was virtually unchanged from September. And the forecast from September was virtually unchanged from August. There was no new news when the Democrats won in November. The election forecasts had been fully digested and incorporated long before the markets started to fall in late September/early October.
CoRev – you should stop laughing and learn to read a chart. I hear that your mother is so embarrassed that she my deny knowing you.
OMG! Did you read the actual date for your 538 link. September 5, 2018. The market was still rising for the next 12 days.
Lord CoRev – why do you hate your mother this way? Stop embarrassing her!
I wonder if CoRev was just listening to that Wall Street socialist who was on MSNBC a couple of minutes ago. He noted – like you – that the drop in the stock market was in OCTOBER and attributed the weakness to higher interest rates from the FED.
He continued by noting that November was a better month for the stock market. So by CoRev “logic” when corrected for the actual facts, the Democratic win helped reverse the damage from the FED’s October monetary policy.
Glad we could sort all of this out. Thanks CoRev!
Guys, why all the nitpicking errors to ignore and deny the obvious? Which month was it Aug, Sept or Oct, when predictions affected the market?
Pgl, I know you’re not saying Trump was correct in blaming the Fed for poor economic performance. No! You would never do that. NEVER!
Getting key facts right is nitpicking. What is “the obvious” here is that you have taken your usual incoherence to a whole new level!
Stock market performance. Not economic performance.
And, if you look at Fed rate hike expectations, in for instance December 2020 eurodollar contracts, you’ll see that rate expectations and the S&P are highly correlated, and moved more or less in tandem (EDZ0 led by a bit) all year. The Fed IS to blame for the stock market’s weakness. And that’s not a bad thing, either.
CoRev Which month was it Aug, Sept or Oct, when predictions affected the market?
You seem to have lost track of your own comment. Here’s what you said earlier:
The market was reacting to election predictions as early as Sept. and 2slugs was wrong again.
The point is that predictions about the election did NOT affect the market. That’s why I told you to go look at the fivethirtyeight.com graph. It shows that the election prediction was essentially unchanged from early August through October; however, the stock market started to fall in late September/early October. Let me make this really, really simple for you. The market predictions were relatively constant, but the stock market wasn’t. What does that tell you about any correlation between the election predictions and the stock market? Understand?
2slugs, you are talking to a brick wall here.
Early November, CoRev? That’s when the latest Trump fact checks revealed that he had uttered 1,100 lies or mistruths in the past 30 days. (To be accurate, 1,104 in the month of October) Thanks for the reminder.
Almost forgot. That was around the same time he blamed California wildfires on insufficient leaf and weed raking. Thus pointing out how foolish my neighbors and I have been relying on mowers, chain saws, and string trimmers as well as winter burns.
Of course the big drop occurred BEFORE November. Either CoRev has never learned to read a chart or he is doing his best Trump imitation – lying 24/7.
Some perspective: https://www.macrotrends.net/1319/dow-jones-100-year-historical-chart
Select 30-year, Show Recessions Log Scale Inflation-Adjusted
interestingly, i see the plot increase when a democrat was in the white house, and flat or down if a republican was in the white house. any reason for this?
But one should go back for say the last 60 years. Big drop from 1965 to 1980 followed by a 1980’s boom. Of course we had tight money to kill inflation in the 1970’s regardless of political party whereas Reagan was all about soak employees to give big tax breaks for corporations.
But yea the Bush41 and Bush43 years were just dreadful.
pgl re: big drop from 1965 to 1980. I seem to remember the Vietnam War and the costs associated with that followed by the oil “crises” that sent inflation skyrocketing. Vietnam can be attributed to Kennedy and Johnson (Nixon ended that) and the oil “shortage” crises in the U.S. was pretty much a political phenomenon of the West supporting Israel during the 1967 war (which party was in power then?) and being boycotted by the Arab countries.
I had to find a historical chart of real oil prices that dates back 70 years:
https://www.macrotrends.net/1369/crude-oil-price-history-chart
The chart supports my memory that the first significant oil price shock was in 1973.
Bruce Hall the oil “shortage” crises in the U.S. was pretty much a political phenomenon of the West supporting Israel during the 1967 war
Could you explain this? When referring to the OPEC states cutting off oil to the West, people are usually referring to the West’s support of Israel during the 1973 Yom Kippur war, not the 1967 Six Day war.
pgl, I believe you are correct about the year that the Arab boycott created the oil crisis the first time; the second time I believe was 1980-81. The U.S. had allowed itself to become very dependent on a key strategic resource from an area that had far different self-interests than the U.S.
When the U.S. sided with Israel against the multi-Arab nation threats/attacks (300,000,000 Arabs vs. 6,000,000 Jews), it opened itself up to the old conundrum: morality versus expediency. It would have been expedient to simply watch 6,000,000 Jews get killed or driven out of Israel. Oil prices would have remained low in all likelihood and we could all praise the religion of peace as an economic ally, if not a moral ally. I realize that there are many old-line liberals who have nothing but disdain for Israel and view the 300,000,000 Arabs as good economic “partners”. I’m sure there are just as many old-line conservatives with similar views. Of course, this is due to the ill-treatment and torture of the 1.5 million Arabs who still live in Israel whereas the several thousand Jews who live in the entire remainder of the Middle East are treated with veneration by their Arab hosts (do I have to use the /sarc?).
Liberals like to think of themselves as morally superior, enlightened, and the supporters of minorities… unless the minority are the Jews in Israel. So, yes, Nixon the Republican president in 1973 threw his support toward Israel. It was a moral decision, not an economic one. In 1980, Reagan pushed hard against the Soviet Union until it fractured. This happened coincidentally with the second Arab-caused oil crisis. I don’t believe Reagan connected the Arab actions with the strategic decision to press the Soviet Union into an economic corner.
So, while you see 1973 and 1980 oil crises as the “fault” of Republican presidents, I see the U.S. doing the morally right thing against an aggressive Arab majority and a morally corrupt Soviet Union in spite of an economic cost. Would Democratic presidents have taken the same risks?
Anonymous Liberals like to think of themselves as morally superior, enlightened, and the supporters of minorities… unless the minority are the Jews in Israel.
I don’t see where pgl was questioning US support for Israel in 1967 or 1973. In fact, most liberals were very supportive of Israel. Back then most of the opposition to Israel was coming from the far right. You might have forgotten this, but back then Israel was considered a socialist country. Or did you forget about all those young liberal Americans spending their summers in an Israeli kibbutz?
So, while you see 1973 and 1980 oil crises as the “fault” of Republican presidents
Again, pgl said no such thing. And the President in 1980 was a Democrat, not a Republican. For that matter, the 1980 oil crisis didn’t have much to do with the Arab/Israeli conflict; it was mainly due to the actions of a Persian country (Iran). In case you forgot, Iran cut off oil in retaliation for President Carter offering sanctuary for a dying Shah.
And what was the average interest rate that accompanies the average p/e? I assume there is a connection.
the shiller curve is interesting. we have had three peaks, including the current one, at these elevated values. the past two peaks resulted in significant declines. since the 1990’s we have had an elevated PE compared to historical values, so there appears to be a new “average” over the past thirty years-even our financial crisis put a bottom on this value. so we are definitely elevated by historical standards, but maybe not as much when considering the more recent higher average value. or perhaps our measure of inflation over the past thirty years is inconsistent with the past? there certainly is a difference in average values over time. personally, i feel most stocks are currently overvalued (not sure if significantly should be included) and have been waiting for a pullback for a while. the trump fiscal stimulus has been the biggest push in the past couple of years, how we handle its demise will determine whether we get a strong correction or stay the course.
dr hamilton, would the previous ten year moving average (rather than historical average) shed any more light on the current PE level as high or low?
Hi Prof. Hamilton,
I have found that the P/E ratio is strongly dependent on the timeframe you use to calculate the earnings average. This is because the earnings disaster of the Great Recession is just a bit under 10 years ago, and is still having a large impact on the P/E10. I use the P/E7 because it better matches the length of the average business cycle.
The P/E7 is right now standing at 25. Also, it is true that the long-term average P/E7 is 16, but as you can see, there appears to have been a shift in the underlying trend and the average for the last 30 years is 24. It’s hard what to make of it all, but it seems the P/E is not totally unreasonable by standards of the last generation.
compared to historical standards, since the PE is normalized to an inflation component, it appears to me that inflation is either not measured the same or has taken on a different behavior, over the past 30 years. if you can figure this out, you know whether the normalized PE is very high or just average high. or accounting has significantly changed what “earnings” are.
F
It does look like perhaps there was an increase in the long run fundamental P/E ratio about 30 years ago. It is possible that this was due to a decline in inflation expectations, but another possible factor only rarely noted in commentaries was the fall of the Soviet bloc and the end of communism and socialism in much of the world, with the most important aspect of this being a major decline in the probability of uncompensated nationalizations happening around the world, which indeed did largely disappear, although there has been some reappearance of them in a few places more recently.
“It is possible that this was due to a decline in inflation expectations”.
But wait – isn’t inflation neutral? Isn’t the drop in real interest rate that matter?
Of course as I say this I remember back in the late 1970’s a marvelous paper by Franco Modigliani on the weak stock market when he tried to model this out saying markets should be inflation neutral. He admitted the model was a bit complex as it took Ken Arrow a few minutes to grasp it. Now if Arrow does not get something within 60 seconds, it has to be complicated!
Calculated Risk, Bill McBride, doesn’t think Shiller’s housing post is scary. Combine Shiller’s stock market post with his housing post and do some head scratching about the near future. Every snow avalanche starts with the last snow flake. Some have commented that the stock market is not the economy and others have said the housing market is the economy. The stock market has a big effect on local markets. Back when we lived in Palo Alto, the dot com bust dipped the local house prices and there was another dip in 07-08. Wish we had cashed out stocks and bonds in 08 and bought more rentals. Interesting.
I found a November 27 blog post on this from Bill McBride:
https://www.calculatedriskblog.com/2018/11/case-shiller-national-house-price-index.html
Has he said more since then?
I sent bill this link
https://www.nytimes.com/2018/12/07/business/housing-boom-how-long-can-it-last.html?partner=rss&emc=rss
He responded that today’s market was nothing like 05 to 08. He does not see a recession on the horizon.
best
Something I find odd and disappointing about Shiller’s column is that he completely ignores something he focusd on back in 2005 and earlier when he was warning of a major housing bubble that could and would burst. That is the price to rent ratio. While nominal housing prices may now be back up to their 2006 peak levels, the price to rent ratio is nowhere near as high. Using Jan. 1998 as 100, it got to over 180 in 2006,. but is mow only at 137. Yes, it is up, but nowhere near 2006 territory. A substantial part of the current problem is due to a lack of housing construction, whose source I am not sure of. Interest rates are low, and it is not obvious that the restrictive land use controls in place in places like Boston and California are worse than in the past. Rents clearly show basic supply and demand conditions, and somehow supply has not been responding to the rising demand. But Shiller simply does not discuss this at all, which I find mysterious.
“the price to rent ratio.the price to rent ratio.”
Yes – I asked the same question. Thanks for providing the actual data!
One outcome I anticipate as a result of the recent U.S. election is less fiscal stimulus, which would bring both stock prices and bond yields down from earlier highs.
I’m not following this. I don’t see a Democratic House of Representatives and a Republican Senate leading to less fiscal stimulus. If anything we’re likely to see a bit more spending than would be the case with a Republican House of Representatives. The election result was almost exactly as predicted months ago. And any investor could easily read CBO’s projection for slower growth as the fiscal stimulus faded, so presumably all of that should have been baked into equity prices. I don’t find the drop in equity prices all that much of a shock. What was a surprise to me was the rise in equity prices over the spring and summer. The S&P today is about where it was in late winter/early spring. For me the anomaly is why the stock market increased over the summer despite a torrent of bad international trade news; e.g., tariffs, NAFTA 1.01, Brexit, Germany’s recession, Turkish and Italian banks, etc.
I worry that in this case a weak stock market might cause a recession. For most of the historical period stocks were something that mainly affected rich folks and institutional investors, so a drop in the market didn’t affect permanent consumption plans of ordinary folks. But today we have a lot of ordinary folks who consume out of wealth, and that wealth is tied to equity markets. Back when retirees had defined benefit plans they regarded future income as a flow variable coming from future corporate income (another flow variable). But now current retirees treat future income as depending upon current wealth (a stock variable). So in today’s world a reduction in wealth is likely to have a stronger effect on consumption than was true in the past. A wealth shock is likely to be very persistent.
“I don’t see a Democratic House of Representatives and a Republican Senate leading to less fiscal stimulus.”
Well we did see Obama’s “Grand Bargain” proposal where he would agree to some cuts in government benefits in exchange for some more taxes on the rich. Not that I thought the former was a good idea and it certainly was the case that McConnell said no to the latter.
I mostly see no change. Everything is pretty much on hold until after 2020. The GOP isn’t going to go along with tax increases or cuts to defense, and the Democrats aren’t going to go along with cuts in non-defense spending. I can see where both sides might agree to increased infrastructure spending or a beefed up farm bill. But mostly this is stuff at the margin. We’ll mostly just plod along until after the 2020 election. The one thing that might change that would be a recession late next year. Then all bets are off.
Things are not changing as long as we have either Paul Ryan or Mitch McConnell to deal with. Yes Ryan is finally retiring but the evil turtle still rules the Senate.
Gee – the always well informed Tim Duy agrees with me that it was FED policy that drove down the market and not that batshit insane CoRev rant about the November elections!
https://blogs.uoregon.edu/timduyfedwatch/2018/12/10/unpleasant/
“The situation on Wall Street is, well, unpleasant, and it in turn is creating considerable uncertainty about the outlook for monetary policy in 2019.”
Duy continues by noting the case for tight money isn’t exactly that compelling.
Tim Duy also gives us this:
Finally, we have geopolitical risk just about everywhere. President Trump’s “bull in china shop” strategy with all of our trading partners leaves the US isolated when we could have pursued a unified approach to addressing issues with China. At home, Trump looks increasingly vulnerable and his response will likely be to create additional chaos. Brexit has devolved into a hot mess of a disaster.
The market is heavily weighted towards tech firms and banking, both of which are vulnerable to Trump’s “bull in a china shop ( or “China shop”???) strategy.” And boy has “Brexit devolved into a hot mess.” The PM had to pull the Brexit vote from the floor because it was doomed to certain defeat. So back to Brussels. Good luck with that. And Germany is in the middle of a political and economic crisis of its own.
on brexit, i have argued from the beginning that i did not think the brexit would actually occur. although i thought it would be cleaned up by now, my expectation was either a new public vote, or the may government would not follow through with the pullout trigger. i have been wrong on both counts. but i think i heard today that an eu court has ruled that the british are permitted to withdraw from the divorce, and the eu partners are not required to sign off on the move. so this does put a brexit into doubt, although not quite in the way i anticipated. it is still possible that may comes out and says the british parliament will not accept the current deal, and wants further negotiations. and the eu parliament says we are done negotiating. in this stalemate, i suppose may could simply grant both their wishes and cancel the divorce. if so, a lot of wasted time and effort for a no event. but probably better for the world overall.
@ baffling
I haven’t been keeping track of it as well as I should have and I’m sure many have. Maybe the whole Trump mess had got my eye distracted from the Brexit ball. But my understanding is the March 29 deadline is a pretty hard deadline. I mean I don’t see how they back out of it happening in late March. The part that gets me is they keep blaming it all on May lately. I don’t even like Theresa May, but I don’t know how she takes the blame after a wide democratic vote was held. I thought Nigel Farage and Boris Johnson were the “baddies” on that, if you’re anti-Brexit.
BTW, I agree with Menzie on like 98% of everything economics based, and probably at least 85% of Menzie’s politics. I mean truth be told that’s another reason I like this blog, it’s easy to like something that agrees with your thinking a large segment of the time. But I have been “pro-Brexit” which I am sure puts me at odds With Menzie and Professor Hamilton. That and the recent BEA numbers on GDP (which I think are way too high) are about the only two things I disagree with Menzie that I can think of. I’m sure there’s others but those are the two biggies pop into my head easily.
Find myself kind of enjoying the drama of Brexit, like I’m watching it as a passive observer from deep space or something, and then I get jolted awake thinking what a weak Europe could do to the world right now. It’s not good. Which still doesn’t change me being Pro-brexit–but it’s a pretty big snag on it.
“But my understanding is the March 29 deadline is a pretty hard deadline.”
that was the case, until very recently
https://www.bbc.com/news/uk-scotland-scotland-politics-46481643
it appears that the british actually control this event now. will they be stubborn and remain the course, or reconsider what has happened. before they make a decision, it would be wise for them to have a full understanding of what influence the russians had in the brexit conversation. there appears to be evidence the russians influenced the vote to some extent, or at least the narrative. i never felt the british population were given a full and accurate account of the issues related to staying/leaving the eu.
it is rather concerning to see the democratic process has been tainted to various degrees by the russians, both in the usa and great britain. the failure of the gop and president to acknowledge their influence is also rather concerning. the russians have found a cheap means to effectively disrupt the government and economy of two great democracies without pulling a trigger or dropping a bomb.
P/E is about two things: future earnings and interest rates. The higher the expected future earnings and the lower the interest rate the higher the P/E. Both of these things have taken a hit recently with the Fed tightening, and the pro-business Trump administration facing headwinds (see CoRev).
The “pro business Trump administration” led by Mr. Tariff. (AKA “The King of Debt”, AKA “Individual-1” )
@sammy. “Pro business?” Surely you’re joking.
The business of tax lawyers and those who advice on customs duties is certainly taking off. Now real businesses are having to pay these extra fees but at some people are making out like bandits!
Yes higher interest rates hurt stock values. But see CoRev??? I made the point about the FED tightening and CoRev said that was nitpicking. Can you guys on the right get a program? DAMN!
I think Kevin would be the first to admit that his DOW 36,000 estimate was based on a theoretical oversight that Jeremy Siegel pointed out and that greatly embarrassed Hassett and Glassman (but especially Kevin).
Krugman also noted their incredibly stupid error. Valuations depend on cash flows not profits. Cash flows are operating profits net of the new tangible assets required for a growing operation. Anyone who gets this wrong has NO business writing books on valuation.
I think several factors might have changed the returns to corporations from historic norms. First is that capital has been able to garner a greater share of the value of output – the time-honored shares of capital and labor have changed a lot from what they were just 30 years ago. Secondly, a great part (some estimate 80%) of corporate profits today consist of so-called ‘supernormal’ profits (monopoly profits) (Apple, Google, Nike, etc.) based on intellectual property rights as opposed to physical capital. Finally, effective tax rates on corporate profits have plummeted since 1986.
All excellent points!
JDH: ” One possibility is that the U.S. fiscal stimulus both raised long-term real interest rates as well as near-term real growth forecasts earlier this year.”
Curiously, back in 2009 at the depths of the Great Recession, JDH was very concerned about the prospect of trillion dollar deficits for fiscal stimulus when 15 million people were out of work.
But today, at the peak of the economic cycle, and Republicans running trillion dollar deficits to provide tax cuts for the rich? Not a peep of concern. It is curious.
The Washington Post has a handy list of Trump’s bottomless Pinocchios
https://www.washingtonpost.com/graphics/politics/fact-checker-most-repeated-disinformation/?utm_term=.1476a0ba8b63
A $900 billion (over a decade) farm bill that is so loaded up with lard that even Iowa’s Senator Chuck Grassley will vote against it:
https://www.washingtonpost.com/business/2018/12/11/congresss-billion-farm-bill-is-out-heres-whats-it/?utm_term=.d31d9f43c101
Trump is not exactly the fiscally responsible one – is he?
Some good news this morning for CoRev – the stock market was doing well. But then we had that embarrassing ranting by Donald Trump as he acted like the little lying child he is before Chuck and Nancy and the market started crashing:
https://www.usatoday.com/story/money/2018/12/11/dow-stocks/2275063002/
Now I trust CoRev to completely miss today’s timing. He always gets things like this messed up!
“Pelosi Takes Trump to Woodshed”
Latest data I could find at FRED related to market value to GDP for US and world. Latest for USA is 2017, for world is 2015.
Stock market capitalization to GDP world 2015: 55 percent https://fred.stlouisfed.org/series/DDDM011WA156NWDB
Stock market capitalization to GDP United States 2015: 143 percent https://fred.stlouisfed.org/series/DDDM01USA156NWDB
i have calculated the PE on trailing operating earnings since 1988.
Most professional portfolio managers I know prefer to use the
operating earnings PE. The debate is over whether to use trailing or
forecast earnings. I come down strongly for trailing operating earnings.
At the current market peak that PE was at the top of my fair value
band and is now well below the band– so it looks cheap.
It is important to remember that the stock market PE is partially a
function of bond yields and that US bond yield are strongly influenced
by European and Japanese interest rates.
So almost any reasonable market valuation will incorporate economic development
outside the US as well as inside. In my bond valuation mode, for example l foreign bond
yields — the average of British, German and Japanese yields — has a greater
influence on US bond yields than fed funds. Remember, the US is an open
economy with a current account deficit that has to finance the
savings-investment gap with foreign capital inflows.