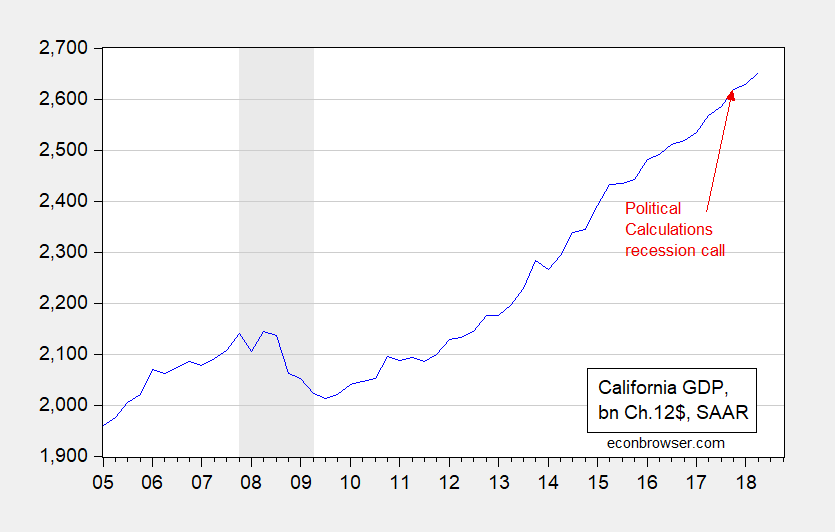
Back nearly a year ago, Political Calculations asked if California was in recession.
Going by these [household survey based labor market] measures, it would appear that recession has arrived in California, which is partially borne out by state level GDP data from the U.S. Bureau of Economic Analysis. [text as accessed on 12/27/2017]
The release of the 2018Q2 state GDP figures provides an opportunity to revisit this question — it’s likely no recession occurred.

Figure 1: California GDP, in bn. Ch2012$ SAAR (blue). NBER defined nation-wide recession dates shaded gray. Source: BEA and NBER.
Of course, the GDP figures will be revised. However, as of now, these data suggest to me that California did not enter in, and is not currently in, recession. For previous assessments, see: [1] [2] [3] [4] [5] [6] [7], [8], [9].
Was not their claim based on taking into account high housing costs in California? Certainly nominal incomes have been performing fine in CA, but housing costs have been sharply rising with the state the epicenter of recent Robert Shiller hystericizing about a possible housing bubble.
I think Ironman is answering a different question than the one he proposes to answer. The definition of a recession: a period of temporary economic decline during which trade and industrial activity are reduced, generally identified by a fall in GDP in two successive quarters.
California is not experiencing a recession!
However, what his article is actually talking about is: A slowdown in the growth of the employment numbers – and that may be correct. That is *not* the definition of a recession.
This is one of my personal pet peeves, because GDP or GDP/capita is too often use when standard of living, or median household income should be used – That does not have any bearing on whether California is in a recession, it is the wrong measure.
Bellanson: I wouldn’t be so absolutist. From NBER BCDC, latest memo:
You might find Bill McBrides take on Shiller’s post interesting.
https://www.calculatedriskblog.com/2018/12/a-comment-on-professor-shillers-housing.html
Bill McBride notes: “it is important to note that Professor Shiller is discussing house prices, as opposed to housing activity (usually a “housing boom” would refer to new home sales and housing starts). This is not one of the “greatest housing booms” in terms of new home sales and housing starts – in fact, housing activity is still somewhat low historically”.
It has been low for a while suggesting less housing per capita which means the rental cost of a house would likely be high. I’m not sure if the Case-Shiller index incorporates the impact of higher equivalent rent costs. If not – it should.
Somehow neither McBride nor Shiller pay attention to housing rents, which have been rising sharply in California pariticularly. I noted in another thread here and just now on Econospeak that while housing prices are nominally reaching their 2006 peak, the price/rent ratio is nowhere near that, even though it is rising.
So there is a serious question about what is driving this rise in rents, and more particularly why has not the supply side responded to this. Some of this is lags, some of it is rising interest rates, although those remain still pretty low in real terms by historical standards. Of course many poke aat excessive land use rules that limit construction, and maybe they ae it, although it is not obvious that such restrictrictions have gotten worse in recent years. If they have, well, there it is, but it looks like something else is going on here.
In any case, by conventional stats CA is not in recession, but if one takes into account cost of living, well, housing prices including rents are reeally soaring and high in CA, making the question of recession not so striaightforward. Yes, the economy is generally booming, but thosenot directly benefitting from that are suffering due to the related rise in housing prices.
As recently as November 27 McBride has a post relating to housing rents:
https://3.bp.blogspot.com/–eaxq04bmJg/W_2pyhu-JkI/AAAAAAAAwos/-uRlkWqFLOEZYHRBaaxdXM1IrN9h7-v9QCLcBGAs/s1600/PriceRentSept2018.PNG
You might find it interesting to note that the price-to-rent data McBride quotes is from Case-Shiller.
McBride also leaves a link to this 2004 paper by John Krainer and Chishen Wei.
https://www.frbsf.org/economic-research/publications/economic-letter/2004/october/house-prices-and-fundamental-value/
I’m not a regular reader of McBride, but I dare say as far as bloggers go, you’d be hard-pressed to find anyone who follows the housing situation better. McBride says: “the price-to-rent ratio is back to late 2003, early 2004.”
This took me all of about 4 minutes to find.
Here is the BLS” CPI shelter index for anyone who is interested. I am pretty sure this is an exclusive measure of rents. Happy to be corrected if the index also includes purchases etc. This was a little more difficult to find for me than the McBride link with the Case-Shiller data. I would assume they jive together, at least somewhat.
https://data.bls.gov/timeseries/CUSR0000SAH1?output_view=pct_3mths
You can download a .xlsx file there as well that at least goes back to 2008. Happy hunting.
Too much data and sources to quote individually here. Suffice it to say if you are interested in the Southern California rental prices picture, you’ll get a good idea here. And tons of links towards the very end of the article on the left, just before you hit the comments section. It’s a relatively well respected newspaper, if it is on the paper’s site itself, it is most likely reliable.
https://www.ocregister.com/2018/02/15/southern-californians-scrimp-to-get-by-as-average-rents-hit-1900/