Industrial production is down relative to previous month, and relative to recent peak. GDP, sales, personal income are all below recent peak as well. Nonfarm payroll employment continues to plug along — although at a decelerating pace (1.53% y/y).
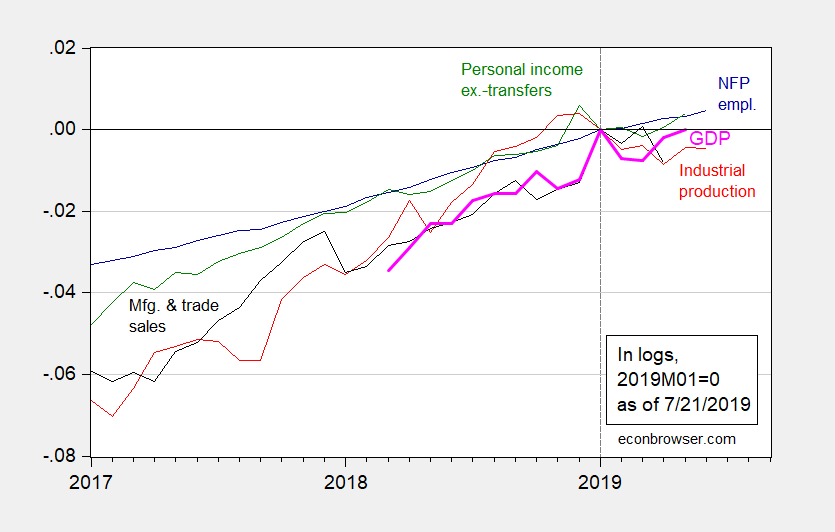
Figure 1: Nonfarm payroll employment (blue), industrial production (red), personal income excluding transfers in Ch.2012$ (green), manufacturing and trade sales in Ch.2012$ (black), and monthly GDP in Ch.2012$ (pink bold), all log normalized to 2019M01=0. Source: BLS, Federal Reserve, BEA, via FRED, Macroeconomic Advisers (6/26 release), and author’s calculations.
Note that manufacturing has recovered somewhat since last posting.
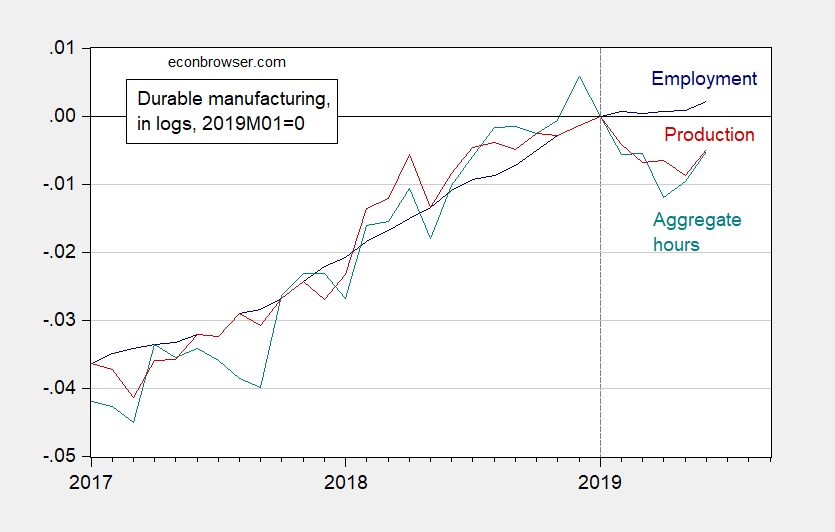
Figure 2: Manufacturing employment (blue), aggregate hours of production and nonsupervisory workers (red) and production (teal), in logs 2019M01=0. Source: BLS, Federal Reserve via FRED, and author’s calculations.
Doesn’t look terrible. Economy looks to be recovering from a soft patch.
Thank goodness we followed “Princeton”Kopits’ advice not to punish rich white men and large American conglomerates who employ illegal immigrants in droves or those graphs would REALLY look like sh*t now. [ wipes the sweat off my brow in relief ]
You were probably saying that during the fall of 2008. Go back to underestimating the number of people who died as a result of Maria.
Oh come on Menzie! Using official government numbers again? Calling Judy Shelton! Calling Judy Shelton!
I bet Menzie uses NIST certified thermometers too. Why does he always have to be such a jerk that way?!?!?!? I always just phone CoRev and ask him what his disarranged and non-method spreadsheets on daily temps say for today. Then if CoRev’s phone line is busy I phone JBH and ask him what the fruitcakes on Alex Jones are saying about climatology. They say if it’s cold one week in the middle of winter that means global warming is a hoax, so I feel good about the whole thing. Now, when I see a 120 pound soccer mom driving alone in her 5,000+ pound SUV I holler out to her “You go girl!!!”
Moses, “I bet Menzie uses NIST certified thermometers too.” Let’s take a little historical walk regarding your certified thermometers. In 1880, you placed a thermometer on a post within quick walking distance of your front door. For convenience it was out near your mail box, as once a month you were going to post your monthly records. Might as well combine that latest reading with the trip to the mail box.
Imagine if you will you were on a a farm ~1 mile outside of your village. Has your village frown to incorporate what was then your farm? Has the road surface changed? Has the road size expanded? Has the the family associated with taking those measurements been as attentive as you? Did they ever take any vacations, get sick, have reduced vision, be of equal height? How often was it calibrated? Was that certified thermometer’s technology ever changed? Finally, has that thermometer’s location changed, and how much, since first installed?
Assuming the answers are all or mostly yes, what is the annual average for your thermometers temperature readings? Are they greater than the ~1C that the world’s thermometer’s indicate? And finally, can you show us how you calculated the value for the population change encroachments on your disarranged and random changed pristine data temperature data set?
Can you tell us how you accounted and corrected these disarranged and random changes for each of the world thermometers against your your own disarranged and random changed pristine data temperature data set?
When you do please give me that call. I promise to not have a busy phone.
frown is grown.
Moses, please remember that Baffled considers your hand collected and written data NOT raw data. In his world your data must be converted to electronic signals and eventually converted to digital ones and zeroes for computer processing. Oh, wait it already has been, and is stored in the NOAA GCHN data sets.
Only the baffled does not understand this to be RAW DATA, and since it was done after the fact of collection it is not real time data. Only in the Baffled world does today’s technological changes allowing for faster, larger processing – storage and transmission make your hand collected and written data NOT raw data ??? better/worse/non-existent? He was a little vague with this claim. Oh, that’s right, he was able to process more real time data. A well DUH answer if he was actually doing real time processing.
RAW DATA? Is that like steak tartar? You do drift to some of the dumbest debates!
I always assumed this was how you checked the “raw data” CoRev.
https://www.youtube.com/watch?v=NigyrT7nLBQ
When mid-winter comes please let us know if your tongue stuck to the pole or not. Keep us up-to-date, as, if nothing else, you are always entertaining.
Now now, pgl. CoRev has repeatedly told us he is a great expert on climate science, even if he has no advanced or other degrees in it. It is what allows him to bloviate regularly on weather and soybean prices, while also bloviating on which time scales are weather and which are climate, not to mention his ability to find a link to an emblem for Apollo 8, which he subtly suggests actually shows an award he might have gotten, although apparentliy threw away or maybe hung on a wall or maybe put in a drawer or, well…. In any case, you must show the utmost respect here for this great expert who clearly knows more about forecasting, or maybe predicting, future GDP growth than Menzie or anybody else around here, or if not, well, at least the climate, if not the weather.
corev, when you lose an argument is your basic reaction to simply lie and misrepresent what has been said in the past? your comments are completely off base and silly. what you describe was not stated at all. its like a toddler screaming after being corrected. incoherent babbling.
Our Usual Suspects keep saying Trump is playing 3-dimensional chess. They may be right:
Gretna police officer suggests U.S. Rep. Alexandria Ocasio-Cortez ‘needs a round’ in social media post
https://www.nola.com/news/crime_police/article_a206330a-aa5c-11e9-a2da-e7a8c6248a10.html?fbclid=IwAR1j7JqyciM-3G2QgTNXLIwpC4yGKgdeYPGNxby339jCbq6QCj0WGSEBsNw
Yep – the Grand Plan to win back the House is to stir up his racist based to murder his opponents in Congress. Putin would be so proud of his little student!
https://www.youtube.com/watch?v=dKDuLdPFyto&t=2m04s
What concerns me is the rapid increase of debt to GDP. There was an article by Aaron Kuriloff in the Wall Street Journal earlier this year, noting that the aggregate debt as a percent GDP ratio is now over 300%. https://www.wsj.com/articles/taking-stock-of-the-worlds-debt-11545906600 We are seeing a lot of high risk corporate debt in the US that is financed by the shadow banking sector. This raises my concerns regarding an adverse financial event taking place. Most US banks are in good shape (though capital controls always need to be better) but it’s the other stuff that is the known unknown to paraphrase Rumsfeld).
Alan,
You are not alone is worrying about the large scale of corporate debt, which is not talked much about in the media, and may be the leading candidate for a market in the US economy that is a bubble that could blow and cause resulting trouble. However, there are quite a few observers who argue that it is not all that way out of line and not worth panicking excessively over. I do not know. Guess we shall have to wait and see. But indeed, the corporate debt looks more dangerous than public debt, which is not at the moment all that bad, although it is certainly getting worse thanks to the irresponsible Trump fiscal policy.
New spending deal and debt ceiling suspension for 2 years should keep us out of recession if the trade wars don’t get any worse and the Fed cuts rates. That is a big “if” of course, but maybe consumers keep on spending and business investment picks up. We might get lucky.
Yes, to the extent there was weakness in the June industrial production data, it was in utilities, which sank 3.6% MoM. Perhaps June was cooler than normal. I doubt July will be!
We might get lucky, but I still expect a slowdown in early to mid 2020. Big tech makes a whole lot of its money selling advertisements. I didn’t see any potential bubbles until an article in the Economist pointed it out this week. That might be a bubble. It’s not a housing market strength bubble, but if tech slumps, it’s a problem. It’s a far bigger portion of the economy than manufacturing is now.
When I say slowdown, it doesn’t have to be a technical recession. The trend will be toward slower growth, resulting in flat or negative growth overall. The fearless seat of the pants prediction just keeps getting more fearless. If it doesn’t turn out like I think, it won’t stop future predictions.
Sooner or later a prediction of a recession will be correct. No active links for whoever who doesn’t actually read them.
The U.S. could face a recession by next year or in 2020 as a growing threat of inflation forces the Federal Reserve to raise interest rates more quickly than anticipated, Colorado Springs economist Tatiana Bailey said Tuesday.
Colorado Politics, Feb. 28, 2018
A recession will hit the US economy next year, warns David Vickers, multi-asset portfolio manager at Russell Investments.
Morningstar, Feb. 26, 2018
Hedge fund billionaire: 70% chance of recession before 2020 election
CNN Money, Feb. 22, 2018
Prognosticator Alan Beaulieu of ITR Economics was in Bend on Thursday to tell a rapt audience when to expect the next downturn. Based on his New Hampshire firm’s proprietary leading indicator, he thinks the next recession will hit late this year and last into the first half of 2019.
The Bulletin, Feb. 8, 2018
Andrew Staples, director of the Economist Intelligence Unit for Southeast Asia, said his firm expects the U.S. economy to slip into a technical recession in early 2020.
CNBC, Jan. 23, 2018
The Trump Recession is coming… History suggests that the next recession is not far off.
David Von Drehle, Washington Post, Jan. 5, 2018
A financial warning sign that preceded the last seven recessions is about to signal again, and that could mean a recession in 2018 is coming…
Money Morning, Nov. 30, 2017
Guggenheim’s Model Points to Recession in Late 2019 or 2020
Guggenheim Investments, Nov. 29, 2017
Wells Fargo formula shows recession looming in next 18 months
Orange County Register, Nov. 22, 2017
There is 69.2 Percent Chance of Recession
Colorado Biz, Oct. 22, 2017
Marathon Asset Management boss Bruce Richards is gearing up for the next global recession, which he reckons could be less than two years away.
The Economic Times, Oct. 4, 2017
Earlier this year, FS Insider discussed a new machine-learning “forecasting engine” developed by San-Diego-based Intensity Corporation used for economic and revenue forecasting, large-scale investing, supply chain optimization, and a wide range of other areas. The current forecast their platform is giving for a US recession is June 2019…
Financial Sense, Aug. 18, 2017
But there is another recession in our future (there is always another recession), which I think will ensue by the end of 2018. And it’s going to be at least as bad as the last one was in terms of the global pain it causes.
John Mauldin via Forbes, Jul. 27, 2017
I see you were a colleague of Donald Luskin back in September 2008!
She consulted the Great Spirit. https://www.cnbc.com/2019/07/22/elizabeth-warrens-recession-scare-is-long-on-fear-short-on-facts.html
Elizabeth Warren is an economist? Another totally batshit comment from Brucie boy. Yes let’s give Brucie boy a Nobel Prize – for most irrelevant BS artist ever!
Bruce Hall: Well, real gross value added q/q growth has been negative for two quarters. CFNAI came in negative today, below expectations. How optimistic are you…and why?
Menzie:
Are we looking at different things?
Table 1.3.6. Real Gross Value Added by Sector, Chained Dollars
https://apps.bea.gov/iTable/iTable.cfm?reqid=19&step=2#reqid=19&step=2&isuri=1&1921=survey
Yes the real gross value for the government sector has declined but it has risen for the household sector and the business sector.
Pgl: sorry, I meant *manufacturing* VA
Not to be dense but I have tried checking the tables provided at http://www.bea.gov. I can’t find this series. Which NIPA table and which line in that table shows this quarterly series.
pgl: You are not dense, you are right – it’s manufacturing production (ipman) that has decreased two quarters. My apologies for misremembering.
FRED provides this on a monthly basis, which is down since the end of 2018:
Industrial Production: Manufacturing (NAICS) (IPMAN)
https://fred.stlouisfed.org/series/IPMAN
I see Brucie is ducking this issue now that a real question has been asked of him. Typical!
CFNAI is Chicago Fed National Activity Index
https://fred.stlouisfed.org/series/CFNAI
Now that Brucie boy knows what the data looks like – we look forward to his usual misrepresentations!
whoever,
We can all pick and choose our economic indicator to support our positions:
• https://www.bls.gov/news.release/pdf/laus.pdf
• https://www.bls.gov/eag/eag.us.htm
• https://tradingeconomics.com/united-states/currency
• https://tradingeconomics.com/united-states/inflation-cpi (you can decide if that’s good or bad based on your bias)
• https://tradingeconomics.com/united-states/consumer-confidence
• https://www.bea.gov/news/glance
Some see good news; some see bad news. The reality is that not much is happening to indicate a significant slowing or growth. Not that bad of a situation.
The interesting thing is that the private sector, not the government, was driving the growth of GDP recently. https://www.bea.gov/news/2019/gross-domestic-product-industry-first-quarter-2019 (7/19/19)
You know – your Trump worshiping is incredibly boring. Try addressing Menzie’s question without your usual bait and switch.
I guess we should call you WHATEVER! Bruce “no relationship to Robert” Hall!
Bruce Hall’s 2nd link shows that the unemployment rate rose last month. Hmmm? But nominal hourly earnings rose a wee bit. Of course if Bruce “no relationship to Robert” Hall looked at this series in inflation adjusted term, he might realize real earnings fell.
Wait, wait. I just made a stupid assumption. Bruce “no relationship to Robert” Hall is too STOOOPID to look at real wages. In fact this Trump minnie me is too STOOOPID to check his own links! WHATEVER!
Brucie boy’s last link:
“Profits from current production (corporate profits with inventory valuation and capital consumption adjustments) decreased $59.3 billion in the first quarter, compared with a decrease of $9.7 billion in the fourth quarter.”
Damn Brucie – we knew you were incompetent but this takes incompetence to a whole new level!
“The interesting thing is that the private sector, not the government, was driving the growth of GDP recently.”
This is what Brucie Boy got from his follow-up BEA link? First sentence in that link:
“Finance and insurance; retail trade; and health care and social assistance were the leading contributors to the increase in U.S. economic growth in the first quarter of 2019.”
Finance, retail trade, and health care are only PART of the private sector. Did Brucie Boy check the other parts of the private sector? Silly me for asking as we know his incompetence at basic research is nil.
C’mon Brucie – you make it WAY too easy to mock your Trump worship. WHATEVER!
Gee whoever, we must be looking at different data. Average hourly earnings June vs. May were up $0.06. https://www.bls.gov/eag/eag.us.htm
whoever, wow unemployment took off from 3.6% to 3.7% (probably subject to change). We should panic. Oh, wait, that was still 0.3p.p. better than January. Never mind.
But are you telling me you believe that’s an indicator of a coming recession? Let me refer you to a comment I just read: STOOOPID!
As to your other “misreads”:
• For the finance and insurance industry group, real value added—a measure of an industry’s contribution to GDP—increased 9.5 percent in the first quarter, after decreasing 6.2 percent in the fourth quarter. The first quarter growth primarily reflected an increase in insurance carriers and related activities.
• Retail trade increased 11.9 percent in the first quarter, after decreasing 2.5 percent in the fourth. This primarily reflected an increase in other retail, which includes gasoline stations and pharmacies and drug stores.
• Health care and social assistance increased 6.2 percent, after increasing 2.4 percent. This was the largest increase since the fourth quarter of 2008.
• Nondurable goods manufacturing increased 8.4 percent in the first quarter, after increasing 1.1 percent in the fourth quarter. The first quarter growth primarily reflected increases in petroleum and coal products.
• Information services increased 4.5 percent, after increasing 8.9 percent. The first quarter growth primarily reflected increases in data processing, internet publishing, and other information services, as well as publishing industries.
• Education services increased 4.3 percent, after decreasing 1.9 percent.
Economy-wide, real gross output—principally a measure of an industry’s sales or receipts, which includes sales to final users in the economy (GDP) and sales to other industries (intermediate inputs)—increased 1.6 percent in the first quarter. This reflected an increase of 2.8 percent for the private goods-producing sector, 1.3 percent for the private services-producing sector, and 0.3 percent for the government sector. Overall, 14 of 22 industry groups contributed to the increase in real gross output.
All this good economic news under Trump’s administration is really killing you, eh?
https://www.bea.gov/news/2019/gross-domestic-product-industry-first-quarter-2019
But, let’s go to “official” data for forecasting:
https://www.chicagofed.org/research/data/cfnai/current-data
https://www.chicagofed.org/publications/nfci/index
Oh, gee, nothing to write home about.
CFNAI has been negative for a while. It appears to have stayed negative longer than it did the last time it had a downturn in 2015 or so. It looks similar to the shape of the curve in 2007, even though I don’t expect the bottom to fall out quite as thoroughly this time. It will be more like 1992 than 2008, unless something crazy happens.
Thanks – someone took at a look at the data. Too much to ask Bruce “no relationship to Robert” Hall to do. Or should we should call him WHATEVER?!
pgl – of course I looked at the data. It’s in picture format. I understand pictures! Up to a point, of course. The crazy may have just happened. Boris Johnson is about to be the British PM, which means Britain crashing out of the EU. That’s going to make for strains, but never mind the politics, I cannot see that guy successfully navigating a downturn without making it worse. The resulting mess could damage the EU, and with it, the world economy. My fearless predictions just keep getting more fearless.
Bring on more data pictures. I can at least recognize patterns when I see them.
Professor Chinn,
I notice that Real Personal Consumption Expenditures: Durable Goods (FRED: PCEDG96) seems to be more optimistic.
Also, Real Retail and Food Service Sales (FRED: RRSFS). Is the series RRSFS more of a lagging indicator?
AS: I don’t know why NBER BCDC doesn’t follow consumption more closely, and similarly retail and food service sales. I suspect the ones they do follow (and I’ve plotted) are more representative of the broader economy.
Thanks. Just trying to see if there was an “on the other hand”.
Real Personal Consumption Expenditures: Durable Goods
https://fred.stlouisfed.org/series/PCEDGC96
This series took a nosedive after November 2018. Yea it did recover a bit since February 2019. But this variability is supposed to be your source of optimism?
I normalized PCEDG96 to January 2019 as done above to compare with what Professor Chinn did. Unless I made a error, the change since January 2019 seems optimistic.
@ Menzie
Menzie, I have always found these numbers to be fascinating (along with truck numbers and “intermodal”). I will readily confess part of my fascination with them has to do with my childish/boyish/immature affection for trains. But it is a pretty good general barometer. And even if you play around with the numbers, such as taking coal out of the mix (using the checkmarks for the variables included/excluded in the right side of the railfax site), or mainly focusing on USA rail (as opposed to including predominantly Canadian rail companies), the numbers show a pretty strong pattern of slowdown— especially that bottom graph on this link:
https://railfax.transmatch.com
I just learned from watching some dumb cable news show that Rhode Island’s economy went from unemployment in excess of 11% in 2011 to only 3.6% now. FRED? Please confirm:
https://fred.stlouisfed.org/series/RIUR
The local news reports:
https://turnto10.com/politics/president-trump-tweets-about-raimondo-state-economy
‘We know President Donald Trump loves twitter. He especially likes to settle scores with it, so when New York Times columnist Thomas Friedman whacked him in a column two days ago, he fought back with assorted insults. The newspaper column also complimented Rhode Island’s Governor Gina Raimondo as a moderate Democrat improving her economy….So in Trump’s series of tweets, he mentioned Raimondo, not by name, but by saying, “….Governor of the State did a good job. That may be true but she could not have done it without the tremendous economic success of our Country & the turnaround that my Administration has caused.” Raimondo was on WPRO Friday morning, and responded to Gene Valicenti’s question. “I’m pleased that the President agrees Rhode Island has had an economic turnaround because we have. The national economy is doing better, but I spend a lot of time protecting Rhode Islanders from him,” said Raimondo. And she would not give him any credit for economic gains in Rhode Island. Mike Stenhouse from the Rhode Island Center for Freedom and Prosperity thinks she’s wrong.’
Ah yes – some bozo from the Center for Freedom and Prosperity is another Trump sycophant. The cable news show gave the Governor a chance to respond. She noted her state has been moving away from the ancient manufacturing base that Trump wants to hold onto with infrastructure investment and training for a more modern Rhode Island economy. Trump’s tax cuts for the rich are reducing Federal funding of these efforts.
But wait a second – back to FRED. It seems a lot of the decline in Rhode Island’s unemployment rate occurred from 2012 to 2016 when that Kenyan Socialist known as Barack Obama was President. Yes – the President was calling Obama’s America “garbage”. Both Trump and Raimondo need to stop taking credit for the progress made during Obama’s 2nd term. As far as Mr. Stenhouse, could someone give this clown better talking points?
Hi PGI,
FRED has an unemployment data set for Rhode Island (RIUR) I see a seasonally adjusted unemployment rate of 11.2% as of January 2012, January 2016 of 5.4% and 3.6% as of June 2019. Take a look and see if you agree.
That’s my reading.
We saw significant upward revisions to income with real personal income net of transfer receipts at a cycle high. No sign of recession in that indicator.
Although, I am rooting for no recession, the positive Y/Y percent change in real personal income excluding transfers may not be a reliable indicator of no recession on the horizon.
Starting with 1960 data, I computed the Y/Y percent change in real personal income excluding transfers (FRED series: W875RX1). As of June 2019, the Y/Y percent change in W875RX1 is 3.2% and the average (GS10-TB3MS) June 2019 gap is -0.10%.
While this 3.2% seems to be an optimistic Y/Y change for W875RX1, it may be less than a sure bet that a recession is not on the horizon. For example, the August 2007 Y/Y percent change in W875RX1 was 3.2%, and the average (GS10-TB3MS) gap was 0.47%. The Great Recession started December 2007.
The March 2001 Y/Y percent change in W875RX1 was 3.3% and the average (GS10-TB3MS) gap was 0.47%. The recession began in the same month, March 2001.
The July 1990 Y/Y percent change in W875RX1 was 2.4% and the average (GS10-TB3MS) gap was 0.85%. The recession began in the same month, July 1990.