Today, we’re fortunate to have Willem Thorbecke, Senior Fellow at Japan’s Research Institute of Economy, Trade and Industry (RIETI) as a guest contributor. The views expressed represent those of the author himself, and do not necessarily represent those of RIETI, or any other institutions the author is affiliated with.
Last year Donald Trump tweeted “Oil prices are too high, OPEC is at it again. Not good!” President Trump’s tweet reflects the conventional wisdom that higher oil prices reduce growth and lower stock prices in oil-importing nations like the U.S. The IMF (2014) similarly forecasted that a 20 percent increase in oil prices would raise inflation in advanced oil-importing countries by between 0.5 and 0.8 percentage points, lower GDP by between 0.4 and 1.9 percent, and decrease aggregate equity prices by between 3 and 8 percent.
However, American shale oil output has exploded since 2010. As Figure 1 shows, this has caused total U.S. production to soar. Oil prices may affect the U.S. stock market differently after the shale revolution (SR) than they did before.
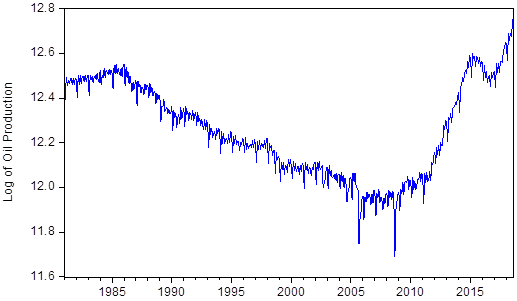
Figure 1. U.S. Crude Oil Production. Source: U.S. Energy Information Agency.
Demand- and supply-driven changes in oil prices
When investigating how oil prices affect the stock market and the economy, researchers confront an identification problem. Oil prices not only impact the economy, but weakness in the global economy reduces oil demand and thus oil prices. To control for this, Hamilton (2014) employed several variables whose short run changes are correlated with changes in global growth and thus global oil demand but uncorrelated with changes in global oil supply. One such variable is the price of copper. It tends to fall when the global economy slows. However, over a week or less changes in oil supply do not affect copper prices. Two other variables that Hamilton used that are also correlated with global growth but not with oil supply over the short run are the ten-year Treasury interest rate and the trade-weighted dollar exchange rate.
Bernanke (2016) used Hamilton’s method to investigate the relationship between demand- and supply-driven changes in the daily price of West Texas Intermediate crude oil (WTI) and daily changes in the Standard & Poor’s 500 (S&P 500) stock price index over the June 2011 to December 2015 period. He found a correlation of 0.68 between oil price changes driven by demand factors and stock prices. He also reported a correlation of 0.05 between oil price changes driven by supply factors and stock prices. He questioned why supply-driven oil price changes are positively correlated with stock prices, given the conventional view that oil price increases harm the U.S. economy.
Why oil price increases raise stock prices after the shale revolution
To answer this question I investigated how WTI oil prices affected U.S. aggregate and industry stock returns before and after the SR (Thorbecke, 2019). For the pre-SR period I employed data from 3 January 1990 to 1 June 2007. For the post-SR period I employed data from 1 June 2010 to 28 September 2018. I excluded the Global Financial Crisis period between June 2007 and May 2010 because it contained wild swings in both oil prices and stock returns that could cloud inference.
The results indicate that after 2010 oil price increases driven by both demand and supply factors increase aggregate stock prices in the U.S. Before the SR, price increases driven by demand reduce aggregate stock prices while increases driven by supply have no effect. To shed light on why these responses differ before and after the SR I examined how oil shocks affect industry stock returns. Supply-driven price increases reduce industrial machinery and industrial engineering stock returns before the SR and increase them after. As domestic oil production has increased, spending by oil producers and other firms on industrial machinery and other capital goods has increased. Melek (2018) reported that higher capital expenditures by oil producers triggered increased capital expenditures by non-oil producers after the shale boom but not before. The coefficient on the chemical industry also changed from negative and significant to positive and significant, reflecting the growing importance of the petrochemical industry within the chemical sector and of chemicals as inputs to shale oil production. The coefficients on commercial vehicles (e.g., buses and energy saving devices) and marine transport changed from negative and significant before the SR to positive and significant after. The coefficients on oil industry stocks, while positive and significant in both periods, increased after 2010.
For demand-driven oil price shocks, consumer-oriented stocks such as personal goods, household goods, and food and beverage were much less harmed by demand-driven increases in price after the SR than before. This may indicate that consumers’ marginal propensity to spend windfall gains from lower oil prices has dropped in recent years.
Investigating oil price shocks using Kilian and Park’s and Ready’s approaches
Kilian and Park (2009) employed data on world crude oil production, dry cargo bulk freight rates, and oil price changes and used Cholesky decompositions to disentangle supply and demand effects on oil prices. I also used this approach and monthly data over the pre-SR (January 1990 – June 2007) and post-SR (June 2010 – June 2018) periods. The results indicate that positive oil price shocks decrease aggregate stock returns before the SR but do not affect them afterwards. Many of the sectors whose coefficients on supply-driven oil price increases change from negative to positive using Hamilton (2014) and Bernanke’s (2016) approaches also have coefficients on oil price shocks that change from negative to positive using Killian and Park’s approach. These include industrial machinery, industrial engineering, chemicals, commercial vehicles and marine transportation. In addition, many consumer-oriented stocks such as leisure goods, hotels, food & beverage, and travel & tourism are much less exposed to positive oil price shocks after the SR than before.
Ready (2018) reasoned that oil producers would benefit from price increases due to oil demand, but have a natural hedge against supply difficulties. If oil becomes more difficult to produce then producers would sell less but sell at higher prices. These two effects tend to offset each other. He used this logic to identify oil demand shocks. He then took oil supply shocks to be the portion of oil price changes that could not be explained by oil demand shocks and by unexpected changes in the Chicago Board Options Exchange volatility index (VIX).
Using Ready’s approach and daily data, the results indicate that before the SR the coefficients on oil shocks driven by both supply and demand factors are negative and insignificant for the aggregate stock market and after the SR these coefficients are both positive and are statistically significant for demand shocks.
Examining industry stock responses, before the SR 26 sectors are harmed by supply-driven oil price increases and eight sectors benefit. After the SR six are harmed and six benefit. Among the industries that are harmed before the SR but not after are industrial machinery, industrial engineering, commercial vehicles, and many consumer-oriented stocks such as retailers, food & beverage, and restaurants & bars
Conclusion
This work investigates how oil price increases driven by supply and demand factors affect U.S. stock returns. Results from several identification strategies indicate that supply-driven increases in oil prices reduce stock returns over the 1990-2007 period, but have attenuated effects or even raise returns over the 2010-2018 period. Industries that provide inputs or services to the energy sector such as industrial machinery and marine transport, industries in the oil supply chain such as petrochemicals, and industries producing energy-saving devices such as buses gain from higher oil prices after the shale revolution. In addition, in many specifications consumer-oriented stocks are harmed less by oil price increases after the SR than they were before.
These findings imply that the conventional view that oil price increases harm the overall U.S. stock market no longer holds. President Trump should be careful about seeking lower oil prices. Otherwise, he may reduce stock prices and damage large swathes of the U.S. economy.
References
Bernanke, B., 2016. The relationship between stocks and oil prices. Web blog post. Ben Bernanke’s Blog, February 19.
Hamilton, J., 2014. Oil prices as an indicator of global economic conditions. Web blog post. Econbrowser.com, 14 December.
IMF. 2014. World Economic Outlook. Legacies, Clouds, Uncertainties. International Monetary Fund, Washington.
Kilian, L., Park, C. 2009. The impact of oil price shocks on the U.S. stock market. International Economic Review, 50(4), 1267-1287.
Melek, N.C., 2018. The response of U.S. investment to oil price shocks: Does the shale boom matter? Economic Review, Federal Reserve Bank of Kansas City forthcoming.
Ready, R.C. 2018. Oil prices and the stock market. Review of Finance, 22(1), 155–176.
Thorbecke, W. 2019. Oil Prices and the U.S. Economy: Evidence from the Stock Market. RIETI Discussion Paper 19-E-003, available at: https://www.rieti.go.jp/jp/publications/dp/19e003.pdf . forthcoming in the Journal of Macroeconomics.
This post written by Willem Thorbecke.
This is an interesting post, and I think there is a lot to it. It was striking in 2017 that when oil prices rose the US economy accelerated with a major driving force being surging investment in the oil and gas sectors, between them responsible about half the increase in capital investment.
A loose question I see coming out of this why those sectors that shifted did so. It would seem that some such as industrial machinery might be driven by rising demand coming directly the oil and gas industries themselves. Others such as food and beverages may reflect broader increases in income.
Of course, wondering what Jim Hamilton has to say about all this, if anything.
“American shale oil output has exploded since 2010. As Figure 1 shows, this has caused total U.S. production to soar. Oil prices may affect the U.S. stock market differently after the shale revolution (SR) than they did before.”
That higher oil prices might increase shale oil investment demand has been noted before by the likes of Krugman. This post is interesting as it puts evidence behind this new wrinkle in U.S. macroeconomic theory. It would be nice if the White House had actual economists who could explain this to the Dummy in Chief.
I don’t have much insight to add here. Other than I think low oil prices have been beneficial to donald trump’s popularity and MAGA’s popularity. I think if we are only looking at this one single factor alone —low oil prices have been good for the general economy. What “price point” (say at the pump, which is what I am thinking of here mainly, although I’m sure others will harp in this is not the best barometer) is where low oil prices become harmful to the general American economy?? Right now it is $2.57. So….. we can hypothesize. I am only guessing an average national price of say $2.10 might start to hurt.
https://gasprices.aaa.com
But let me put it this way, although I respect this post and view Mr. Thorbecke’s post as a contribution to the general dialogue— I don’t think LOW oil prices are going to be any kind of factor, between now and November 2020. And yes—since you are asking, and since Nancy Pelosi is busy right now getting luxury curtains installed in her room at the hospice—Nov 2020 is the “lens” I am viewing many things through right now. Thanks for asking.
Moses, I generally agree with your assessment that “low oil prices have been good for the general economy.” I think the counter argument presented in this post is that because low prices restrain investment and oil company stock prices, that it has a spillover effect on the general economy.
” I am only guessing an average national price of say $2.10 might start to hurt.”. If we look at the annual average price of gasoline for recent history (since 1992), one has to ask is the price of oil is the tail wagging the economy dog or vice versa. https://www.eia.gov/dnav/pet/hist/LeafHandler.ashx?n=PET&s=EMM_EPMR_PTE_NUS_DPG&f=A . Since 2005, there have only been two periods when the average annual cost of gasoline was below $2.50/gallon… 2005 (when the trend was increasing gas prices), 2009 (the middle of the “great recession”), and 2015-16 (when the economy had stalled a bit). Given that, I’m inclined to say that the general economy is more the driver of prices than vice versa. So far, in 2019, gasoline prices have remained above the $2.50 per gallon level (except the winter “lull” in January and February) which probably indicates that the economy is doing reasonably well and supply and demand are fairly balanced.
As I recall, about 50 or so years ago, the price of oil/gasoline was the tail that wagged the economy dog. But with the breaking of the OPEC monopoly (or at least oligopoly) through the shale revolution, we have not been subjected to those kinds of “oil price shocks” very often. Which brings me to the absolute stupidity of Bernie Sanders’ comments about throwing oil execs into prison (https://www.foxnews.com/politics/bernie-sanders-criminal-prosecution-oil-executives) for the “climate crimes”. Would he send the army after the OPEC oil ministers, too?
“As I recall, about 50 or so years ago, the price of oil/gasoline was the tail that wagged the economy dog. But with the breaking of the OPEC monopoly (or at least oligopoly) through the shale revolution, we have not been subjected to those kinds of “oil price shocks” very often. ”
Single statistic Bruce “no relationship to Robert” Hall strikes again. I guess you forgot how high oil prices reached some 8 years ago or so. Any more really, really dumb comments for our entertainment Brucie?
Or is it that OPEC collapsed only after that? I guess you are too dumb to know how low oil prices were in 1998. Or the fact that oil prices are once again rising. Geesh!
pgl, you are correct that the price of oil did peak temporarily several years ago, but I was using annual average data rather than a temporary spike (you can check the data from the links).
OPEC’s effective monopoly in dictating oil supply and prices did collapse as shown by it’s inability to push its agenda since the U.S. became the world’s largest supplier of oil. Certainly, OPEC has a large influence on oil prices and supplies… as does the U.S. … but it’s not the only game in town anymore. I’ll let you an Moses duke it out about whether or not our present pricing level is good for the economy and whether or not oil prices have been driving economic activity or vice versa.
But thanks for the inquiries.
Again you fail to note the date of your alleged collapse of the OPEC cartel? I guess I should draw in crayons for you what the real problem with your babble happens to be this time.
When did OPEC collapse? Was it when the “shale oil revolution” started as Bruce “no relationship to Robert” Hall suggested? Well let’s plot inflation adjusted oil prices and actually THINK (OK Brucie is allergic to both thinking and actual data but never mind):
https://www.macrotrends.net/1369/crude-oil-price-history-chart
Ah yes – we see that massive price increase during the 1970’s. OPEC. But wait – we had a commodity bust during the 1980’s and 1990’s. OPEC? Give me a break! Now we did see an oil price boom after the turn of the century. That was driven by China not OPEC. Now shale oil is part of the story as far as oil not being well over $100 a barrel right now. But even Mr. Magoo can see that real oil prices today are as high as they were in 1977. But Bruce Hall is even blinder than Mr. Magoo!
pgl that’s a very nice chart. I’m sure you also remember that the U.S. was pretty much self-sufficient in oil through the 50s and into the 60s, but that it let its oil production tail off and relied on its OPEC “cheap oil partners in trade” to be the supplier… sort of like what we’ve allowed to happen with China “cheap labor partner in trade” (I know you’ll take exception to the word “allow”, but you have to look at the political aspects that enabled China to become the supplier to the U.S.).
https://www.cnbc.com/video/2019/06/14/the-history-of-us-oil-and-gas-production.html
That’s a cute little film there but as usual you totally missed the point. Yes – the U.S. led the world in finding ways to use oil aka the demand side. Yes, we also had the early oil discoveries. But I bet this oil was expensive to extract. Hey Bruce – I know you have ADD but do try to view this film starting around the 4:30 mark. It clearly notes that the large oil reserves were in the Middle East not in the US. And cost of extraction in Saudi Arabia is around $5/barrel whereas extraction of shale oil costs about 10 times that. As such we imported oil from the Saudis as they had the comparative advantage in producing. Oh I’m sorry to use an economic term like “comparative advantage” as now this discussion is way over your head.
I swear reading your comments is sort of like going in the backyard and beating my head against the tree.
pgl, may I suggest a hickory tree? They are sufficiently strong enough for your hard head.
The U.S. (and Britain) found it easier to go after the cheap oil in Arabia than the vast oil reserves in North America much as we have found it easier to go after the cheap labor in China. It makes perfect economic sense until it doesn’t… when politics such as the Arabs getting pissed at our support of Israel comes into play. But popular economics (like Popular Mechanics) doesn’t like to look at the strategic aspects of trade with the likes of Islamic fundamentalists or hardline Communists. If it’s cheap it must be good.
It didn’t work out too well when our “oil partners” decided to turn the screws; let’s see what happens when our “cheap labor partner” decides to use its new-found wealth against us. It’s not as if we haven’t been warned. https://www.cnn.com/2018/07/20/politics/china-cold-war-us-superpower-influence/index.html
Meanwhile, I agree with Moses and the gist of this article that increased oil prices (to a point) don’t harm the U.S. economy… as long as the U.S. embraces its role as a major or the major producer of oil in the world so that wealth returns to the U.S.
Since you live in New York City(?) and like to play the markets(?) here’s a long term play for you: https://phys.org/news/2019-08-scientists-hydrogen-gas-oil-bitumen.html? You might have to become a shill for Toyota to make it pay off.
According to the STEO, the US will become a net oil exporter in November. Presumably, net exporters benefit from higher oil prices.
On the other hand, most of the major economies — almost all of Europe and almost all of Asia — are major oil importers. Therefore, the US could follow the rest of the world into recession in the event of an oil shock, even though the oil sector does well.
So the post’s basic conclusion would appear to be correct: As a whole, the US is best served by ‘Goldilocks’ prices, not too high and not too low. Right now, though, we’re setting up for a round of substantial higher oil prices, at least for a period, sometime next year.
Oh gee – Princeton Stevie and “the STEO”. I guess Mr. Know It All is above the rest of us and too good to tell us STEO stands for the Short-Term Energy Outlook.
Let’s see what Census told us per exports/imports of oil and natural gas during 2018:
https://www.census.gov/foreign-trade/statistics/product/enduse/exports/c0000.html
$185.7 billion in exports.
https://www.census.gov/foreign-trade/statistics/product/enduse/imports/c0000.html
$227.0 billion in imports.
And this $40 billion per year deficit will flip this year? Come on Stevie – are you so damn arrogant you cannot provide a link? OK – I will:
https://www.eia.gov/outlooks/steo/
Lots of interesting information but Princeton Stevie is incapable of pointing out precisely what he is referring to – as usual.
“On the other hand, most of the major economies — almost all of Europe and almost all of Asia — are major oil importers.”
You sort of forget that countries like Russia and Saudi Arabia are major oil exporters. Which would follow as world consumption = world production. Or does the vaunted Princeton Policy model have Martians exporting oil to Earth? Basic concepts Stevie boy. Oh wait – you are above basic economic concepts. Never mind!
And yes – we might get the Saudis and the Russians to buy stuff from us – especially military hardware. After all Trump works for them and not the Western alliances.
Hello Steven Kopits,
I am just an agricultural science technician. I do not have any experience in the oil/petroleum industry, so I’m probably doing something wrong in my calculations.
Sorry to be such a dumb-dumb, but, after looking at the EIA data, I do not understand how the USA can be a net crude oil exporter. I do, however, understand how the USA can be a net exporter of other petroleum products.
I was going through the weekly “Petroleum Status Report” from the EIA ending August 23, 2019:
http://ir.eia.gov/wpsr/overview.pdf
At the top of the page is petroleum stocks table and petroleum supply table under that.
From what I can tell
Line 4 Crude oil net imports 2909
Line 21 Other net imports (9) -2667
= = = = = = = = = = = = = = = = = = = = = = =
Line 33 Net crude oil and Other 242
Footnote (9) Includes finished petroleum products, unfinished oils, gasoline blending components, fuel ethanol, and NGPLs and LRGs.
To me, there seems to be something fishy in Line 33 of the EIA Weekly Petroleum Status Report. Line 33 could go negative in November, but, looking at Line 4, it seems to me that the USA is a large net importer of crude oil.
If I were not paying close attention, I might make a mistake and assume that crude oil made Line 33 go negative. Given the way EIA presents Line 33, it would be an easy oversight. With all the news about fracking, it would be easy to assume that the USA exports more crude oil than it imports.
I am just an agricultural science technician with zero experience with crude oil/petroleum, so I may have made a mistake in going-over the EIA Petroleum Balance Sheet.
Cheers,
Frank
Guns don’t kill people – teaching evolution kills people?
https://talkingpointsmemo.com/news/fox-news-guest-evolution-mass-shooting?fbclid=IwAR3WhlFErcijiu-zva7QUmUnpWYeKbypT8_3sVjXnF4yFv9hvaZ3TdRmIbE
You heard it on Faux News so it must be true (I guess). Damn – nutcase alert!
If these miscreants had been allowed to pray in school. If marriage was allowed only between heterosexuals. If women having abortions were tried for murder. If science teachers could be tried (and drawn and quartered) for heresy. God would be pleased instead of p——ed.
Forgot. If only everybody had a gun….
An aspect of this that has long been a serious issue to the point of it showing up in debates at FOMC meetings between regional Fed presidents from certain locations is that oil price changes do not affect US economy similarly throughout all regions. Those that produce and export oil do well when its pric e is high and not so well when its price is low, and vice versa for the oil importing regions.
So during the 1970s-early 80s oil price surge, Texas boomed and had a problem of “black tag people” living in cars under bridges, their black tags being their black-colored license plates from depressed Michigan. But in the 90s when oil prices were down, Texas slowed down while Michigan did well.
Of course today some regions that were oil importers are now oil exporters, e.g. North Dakota, so at the aggregate level it has indeed become quite the close call.
“Bruce HallSeptember 3, 2019 at 3:41 pm
…. If it’s cheap it must be good.”
OK I skipped over Brucie boy’s usual babbling and got to his point. He thinks it is a mistake to buy oil at say $20 a barrel when you can produce it at $80 a barrel. Just wow.
Look – oil is oil. Shale oil is not better than Saudi oil. Hey I know where I can buy a Big Mac for $3 but I’m sure Brucie enjoys paying $12 for each of his Big Macs. I guess that is why we taxpayers have to subsidize the likes of Brucie boy as they are really, really foolish!