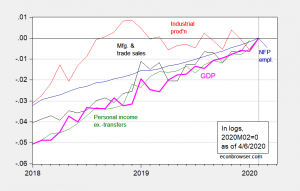
Five key indicators followed by the NBER BCDC, as of today:
Figure 1: Nonfarm payroll employment (blue), industrial production (red), personal income excluding transfers in Ch.2012$ (green), manufacturing and trade sales in Ch.2012$ (black), and monthly GDP in Ch.2012$ (pink), all log normalized to 2019M01=0. Manufacturing and trade sales for February assumed to be at stochastic trend for 2018-2020M01. Source: BLS, Federal Reserve, BEA, via FRED, Macroeconomic Advisers (3/26 release), and author’s calculations.

And now we know why trump is pushing hydroxiqulorocline
https://www.huffpost.com/entry/donald-trump-stake-company-hydroxychloroquine_n_5e8c41d7c5b6e1d10a696280
Snake oil salesman promoting unproven drug of company he invested in.
at under a buck a dose, HDC is not worth all that much cash even if it was an effective treatment to COVID19 — go with the simpler explanation that Trump is an expert bullshit salesmen of miracle cures and this seems to be a miracle cure to solve all your problems and don’t listen to the pointy haired scientists who insist on evidence… trust him!
“Sanofi’s largest shareholders include a mutual fund company run by major Republican donor Ken Fisher, the paper said. Trump’s three family trusts, as of last year, each had investments in a mutual fund whose largest holding was Sanofi, according to the Times. Commerce Secretary Wilbur Ross also had ties to the drugmaker, the Times reported.”
Ah yes Wilbur Ross who has been doing a lot of insider trading based on this advanced notices of Trump’s trade tweets. It is not just Ken Fisher, Trump, and Ross. RUDY G. has been involved on this scam. BTW Sanofi is a French company whereas many of the other players including Gilead are American companies.
Did not realize that industrial production has been essentially flat since the start of 2019. That’s disturbing.
Actually industrial production fell in 2019. We were already in a manufacturing sector recession. Of course Trump should be using the Defense Production Act to get these facilities to start making equipment for our medical professionals.
MAGA Didn’t work? Shocking!!
I don’t know if anyone saw this before I did or what. But I kept hearing about these “peak” projections, but never seeing any actual numbers. I found this link on NPR. After the link jump look for the relatively large green horizontal line at the top of the screen, in that you’ll find a pulldown menu with a list of states, pick your state, and boom!!!! you will have graphs and numbers for your state or whatever state you chose. How credible they are is anyone’s guess. I’m guessing, they will be on the low side just looking at the numbers for my state, but you never know.
https://covid19.healthdata.org/projections