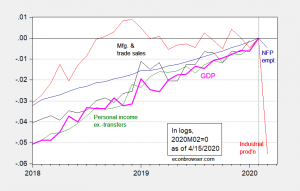
Here are some key indicators followed by the NBER’s BCDC as of today:
Figure 1: Nonfarm payroll employment (blue), industrial production (red), personal income excluding transfers in Ch.2012$ (green), manufacturing and trade sales in Ch.2012$ (black), and monthly GDP in Ch.2012$ (pink), all log normalized to 2019M01=0. Manufacturing and trade sales for February assumed to be at stochastic trend for 2018-2020M01. Source: BLS, Federal Reserve, BEA, via FRED, Macroeconomic Advisers (3/26 release), and author’s calculations.
