From Goldman-Sachs today:
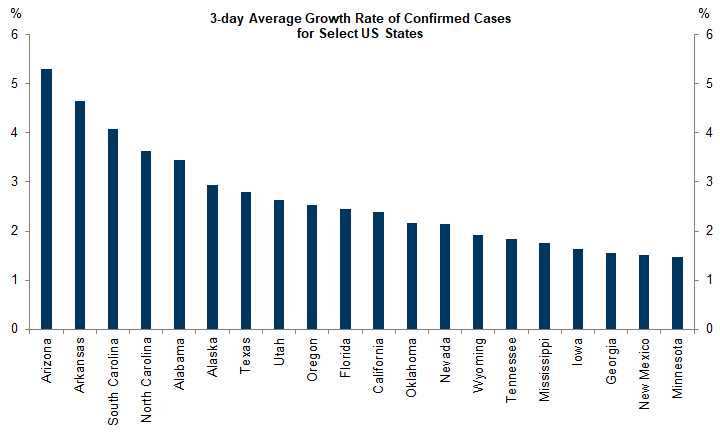
Source: Goldman-Sachs, “Global Economics Comment: Tracking Coronavirus,” June 13, 2020.
Now consider fatality rates, since several governors seem blithely unconcerned about rising cases. From FT:
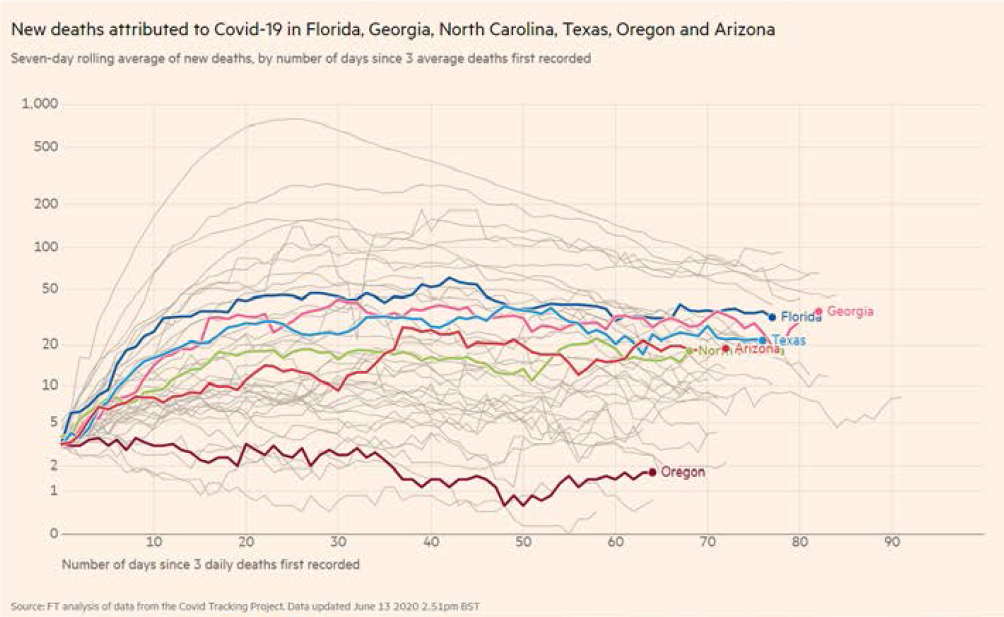
Source: FT, “Coronavirus tracked,” accessed June 13, 2020.
Oregon has already put a pause on further re-opening. These states accounted for 22.4% of US GDP in 2019. The shift to a more upbeat outlook going from May to June might be reversed should lockdowns be reimposed.
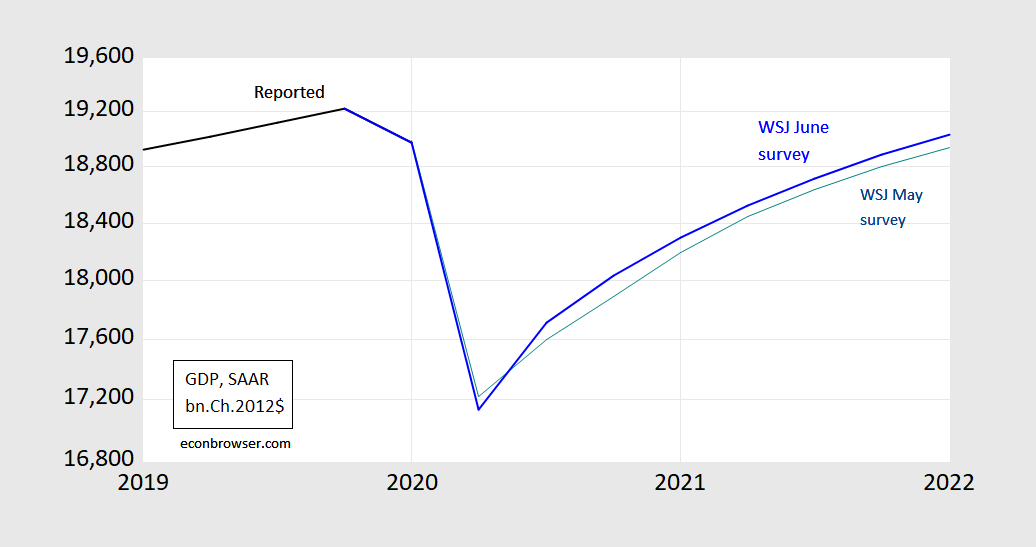
Figure 1: GDP, bn. Ch.2012$ SAAR (black), mean, from WSJ May survey (teal), and from WSJ June survey (blue). Source: BEA, WSJ.
Whether the shutdowns induce a “W”, a “tilde”, or just a more prolonged swoosh remains to be seen.
Update, 6/14: Here’s a graph focusing on the most pronounced “W” recovery in the WSJ June survey (Daniel Bachman/Deloitte – also the most pessimistic over the 2 year horizon), and the most optimistic (Stephen Stanley/Pierpoint Securities).
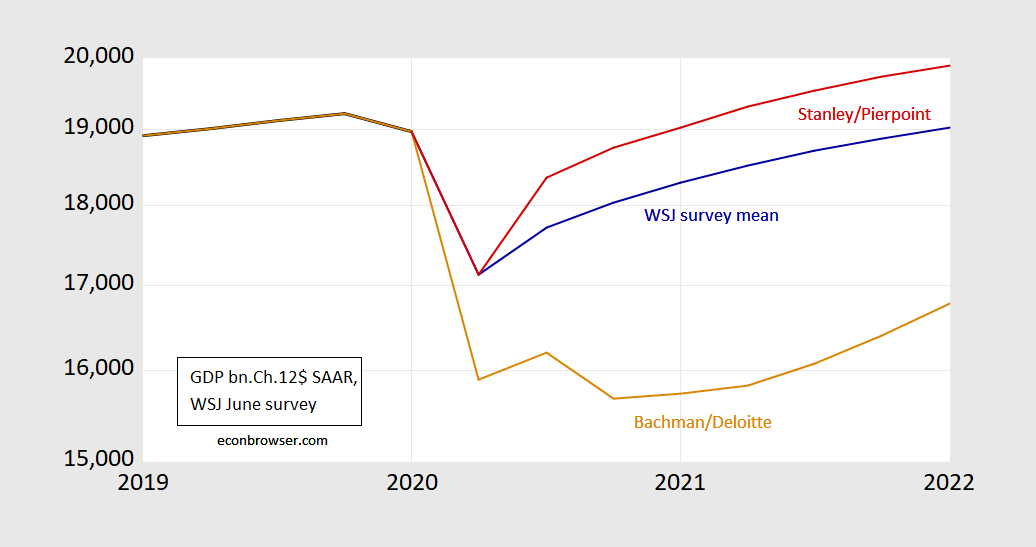
Figure 2: GDP in billions of Ch.2012$, SAAR, reported (black bold), WSJ June survey mean (blue), most “W” from Daniel Bachman at Deloitte (tan), and two year most optimistic from Daniel Stanley at Pierpoint Securities (red). Source: WSJ June survey, BEA, and author’s calculations.
As an 84 year old man the shape of the recovery curve has no interest.
I will be in semi isolation and wearing a mask in public for the rest of my life. If I get infected I might as well just take the fast way out.
We have 3 grandchildren under the age of 3 and our connections with them are severely limited and that really sucks.
Born at the pit of the great depression. Grew up during WW2, the Cold War and the threat of nuclear Armageddon, Vietnam and now the virus and tRump. What did I do to deserve this???
You did nothing to deserve this but a little optimism might help your loved ones. It’s up to us elders (I’m 68 and my spouse 72) to bring a positive outlook so our children and grandchildren can do as well as they can. This is awful but they have a future; ours is not so bright. I remember the polio epidemic; at least in this they are not as vulnerable.
As one who has been reading all the research literature over the past three months, I am becoming a little more optimistic (newsletters are here: https://agoldhammer.com/covid_19/ ). Chances of recovery from severe COVID-19 are better today than at the outset. Regions both here and abroad that follow good public health practices have lower infection rates. It is so simple to wear a mask when going out in the public.
But you have trump and his followers refusing to wear masks because the liberal cdc recommends it. Just like republicans understand pollution hurts the environment, but cannot embrace cleaner approaches because democrats supported it first. Tribalism.
Kudlow the Klown alert!
https://talkingpointsmemo.com/news/kudlow-unemployment-checks-benefits-disincentive
The Klown says no more unemployment compensation because of incentives. YEA we need to give the money to rich billionaires and not average people because of incentives. Listen – Kudlow the Klown knows nothing about economic incentives except for the incentive of being a cheerleader for the rich. After all – the only way this Klown can pay the rent is to shill for the rich.
pgl I have to disagree. Kudlow is right in pointing out that (at the margin) generous unemployment benefits discourage people from working…assuming of course that jobs are available. Kudlow’s problem is that he seems to think that’s a bad thing. In normal times we want unemployment benefits to be generous enough to allow people time to search for jobs that earn a higher value of marginal product. We don’t want people to just accept the first job that comes along. At the same time, we don’t want unemployment benefits to be so generous that they discourage people from looking for work. But that’s in normal times, and we’re not living in normal times. In places where COVID outbreaks are happening we want to actively discourage people from working, so not only should unemployment benefits be generous, they should also include a premium that makes idleness very attractive relative to job offers that might come along as employers offer “hero pay” bonuses, as we saw with the April hourly wage data. Kudlow wants to force workers back to work because idle capital hurts the GOP donor base. In Kudlow’s view workers in meatpacking plants are expendable as long as they keep capital humming along 24/7. And we definitely want to discourage work in the leisure and hospitality sectors. Not only are those sectors dangerous for the workers themselves, but they also encourage customers to behave in dangerous and reckless ways. We’ve seen what happens when Trump’s base is given the opportunity to hit the bars & beaches. It’s like an episode of “Trumpers Gone Wild” except the shirtless and scantily clad revelers aren’t nearly as young and attractive.
One lesson from all this ought to be that state unemployment agencies are a poor vehicle for distributing relief monies during a pandemic. State unemployment agencies are all about finding ways to make it difficult to apply for unemployment and even more difficult to receive it. Those agencies are organized around the idea of denying benefits as often as possible. That’s a bad fit when facing this kind of pandemic when the goal should be to keep people from not working.
BTW, here’s a useful site that shows the Rt transmissibility factor for each state complete with 95% confidence intervals.
https://rt.live/
To no one’s surprise, states along the west coast and in the Old Confederacy are in the red. Bruce Hall may not like Gov. Whitmer’s policies, but those policies are likely keeping him alive. Michigan has the fifth best Rt factor and the 95% CI is below 1.00.
“It doesn’t make any difference whether a country makes computer chips of potato chips.”
— Reportedly said by Mike. Boskin, economic advisor to G. H. W. Bush
Many Republican politicians and policy makes seem unable to see labor as anything but a commodity to be bought and sold. The Kud is certainly among them. He and people like him will never, perhaps can never, think beyond the simplistic “incentives” story when thinking about aid to workers and their families. Bankers? That’s different.
The need to provide income assistance during the Covid epidemic has raised the profile of basic income as a policy option. What I’ve read of the history of basic income experiments shows that many of the social problems we spend money to treat are ameliorated with basic income payments. The incentive story, as told by people like The Kud, is simply wrong when it comes to basic income. I have a $5 bill that says Andrew Yank will be bouncing his grand kids on his knee before the party of the rich allows anything like a basic income program to become law.
No surprise. Washington state is seeing an uptick in cases. I have some ideas about why, and it’s not protests yet. Infections resulting from protests will turn up in another two weeks or so. What’s happening now is agricultural worker communities getting hit. This is going to cause some major disruptions, as we are already seeing in the meat packing supply chain. None of this can be good for the economy.
https://www.msn.com/en-us/news/politics/trump-tries-to-explain-his-slow-and-unsteady-walk-down-a-ramp-at-west-point/ar-BB15sYWZ?ocid=spartandhp
‘The walk in question came at the conclusion of Saturday’s commencement exercises at West Point, where Trump was the guest speaker. As he exited the raised platform by descending a ramp alongside Lt. Gen. Darryl A. Williams, the academy’s superintendent, Trump was visibly tentative and took short, careful steps…“The ramp that I descended after my West Point Commencement speech was very long & steep, had no handrail and, most importantly, was very slippery. The last thing I was going to do is ‘fall’ for the Fake News to have fun with. Final ten feet I ran down to level ground. Momentum!” Elements of Trump’s explanation strained credulity. Trump’s claim that the ramp had been “very slippery” was inconsistent with the weather, which on Saturday in West Point, N.Y., was sunny and clear-skied.’
Watch the video as the ramp was short and not very steep. But the social media ridicule of Trump is “very unfair”. I bet what really happened was that Lt. General Williams asked Trump how he got a doctor to give him an excuse to dodge the draft during the Vietnam War. So Trump decided to show off what was like to walk with bone spurs!
Maybe Princess Ivanka will get her dad a new rollator for Father’s Day.
https://www.amazon.com/Drive-Medical-Rollator-Removable-Support/dp/B005S1CHKC
Personal gripe with the media. The correct form of address for a 3-star general is LTG and not Lt. Gen.
That’s the Army’s way. The Navy has another, the Airforce another. The AP style guide simplifies by using only Lt. Gen.
No, the services have all gone to a uniform style. The Navy equivalent of a Lieutenant General is a Vice Admiral, abbreviated as VADM.
Here’s the official Navy style guide for all ranks:
https://www.navy.mil/navydata/ranks/officers/o-rank.html
bunker boy walked down the ramp like he is an old man. which is true.
He is an old man, and he walks down ramps like an old man who has spent his entire life thinking that exercise means riding in a golf cart and cheating on the score.
texas is having a record number of hospitalized every day for nearly a week now. these are not a result of the protests. these are a result of a reopening that occurred several weeks too early. the memorial day holiday had pockets of people that were a mess. they are now arriving in the hospitals. all so that the republican governor could stay in the good graces of bunker boy. over the past two weekends, you could drive around and find several bar/restaurants that were simply packed like sardines. this is a problem. icu beds are filling up. in houston, they will soon need to use the field hospital that has been build near nrg stadium for covid patients. houston had the virus under control, until the republicans forced the reopening without proper precautions. now houston will not see a dip, but a continued rise right into the flu season. daycare down the street just had a covid case. it is getting harder and harder for working families. they are being forced to send their children into the virus in order to keep employment. kudlow can go screw himself. this compassionate conservatism is continuing to kill people and sicken children. all so kudlow can keep his stock profits.
My son and (I hope) future daughter in law are currently in Dallas. They live in LA but are in Texas to be daycare for her sister while neither of them can work. They are both musicians. The odd thing is that they feel safer from the virus there than they do in LA or even when they were with my wife and me in Seattle.
I do not know what they will do when unemployment benefits run out.
One of the things I am a doing is funding musicians I know and like through Patreon and other websites. To be sure these are small contributions but if all of us who are in a position to do so, it can help keep the arts alive. I have also been impressed with the large number of pandemic recitals. for those with a classical bent, these Goldberg Variations by a number of different artists provides some solace: https://www.youtube.com/watch?v=O2QqWC7CKeI
Alan Goldhammer: For excellent music and insight:
Thank you. Every little bit helps. She’s a young oboist who may or may not work her way into a position in an orchestra. She is showing signs of wanting to do something else for a change. He’s a jazz and funk trumpet player for now. He’s spent the seven years since he graduated from college with a music degree getting himself established as a first call trumpet player for a variety of things. And, once he started really getting somewhere, COVID happened.
Sometimes events bigger than all of us remind us that we are not as important as we thought we were. I’m hoping he can recover and have the career he wants when this pandemic recedes. There’s no doubt he will find a way to get by when push comes to shove. But, he may not be able to do what he’s worked so hard to be able to do. And he’s far from the only one in that position.
@Willie – my younger daughter is a bassoonist and went into music therapy. She’s at a west coast children’s hospital working hard and still plays her instrument in a community orchestra (currently on hiatus)
That’s fantastic, Alan. All the best to her and may she do a whole lot of good in this world.
Alan,
Patreon is a clear case of “every little bit helps”. Metrics on the site allow rough estimates of monthly income from memberships. Some of the folks I pay make a few thousand each month, gross, anyhow. One of the internet’s nicer ideas.
willie, i am afraid your son in dallas is in for a long summer. texas cases are increasing steadily, because trump and the governor reopened the state a few weeks too early. they published all these guidelines on when to reopen the states and then ignored them. texas was still increasing cases and deaths when it reopened. that is a very poor decision because it enables an exponential growth. this early reopening is going to cost much more in money and lives than if we had waited a few more weeks. latest info i have is the leadership in the texas medical center in houston are going to shut down the medical center again within a couple of weeks. the rest of the city will probably shut down as well if that occurs. a new shutdown will be devastating, and could have been avoided had the republican governor not been so eager to please trump. this was a stoooopid economic plan pursued by abbott. people not wearing masks is certainly not helping the situation in the least.
Points taken – the part of Dallas where they are is apparently paying attention. They tell me the supermarket is less crowded and nearly everyone wears a mask. Texas is not 100% knee jerk MAGA-land. But, even in a relatively attentive area, it could easily come crashing down it the virus takes off like it appears to be doing.
It is a concern, and I would be happier if they were – I do not know where might be better now. LA is far worse and it is where they usually are.
willie, in the houston area the behavior is as much socio-economic as it is partisan. if you go to the wealthy parts of town and enter a whole foods, almost everybody has a mask. there are a few wealthy magatards that go without, but it is standard to wear a mask. and the supermarket is not very busy. most people (who can afford) have food delivered or curbside. if you go to a very working class part of town, you will find the local heb (texas supermarket) much busier. there is a mix of mask/no mask. but more people and limited social distancing.
interestingly, many of the wealthier restaurants are still closed or not very busy. but in the poor and minority areas, there are “popular” spots that are filled at night, no masks nor social distancing. this is not helping those minority communities that have already been hit hard by the virus. and if you drive by the local twin peaks or hooters, the parking lot is filled with pickup trucks. i am sure they are not wearing a mask to distort their view. interesting, almost all the construction workers (especially highway) are wearing masks even during the heat of the day. young and middle age white males seem to be the worst violators of mask wearing in public, from what i have seen.
The second wave of C-19 is going to be centered in the Trump states of the old south and the southwest.
It will probably get many Trump supporters to at least stay home and the republican tactic of voter repression is likely to backfire on them.
You’re giving Trump’s Old Confederacy base too much credit for intelligence. I suspect that they will be eager to show up at polls without a face mask because that’s the manly thing to do. They might be dead two weeks after voting, but they will have done their Fox News duty and voted to re-elect a law-and-order President who will make America safe for “good people on both sides.” Like good soldiers, they will follow the orders of Sean Hannity and Tucker Carlson and Laura Ingraham and Mark Levin. Even Rush Limbaugh will leave his cancer hospice in order to vote in person.
The electoral college protects Trump from the risk of excess deaths due to poor Covid policy in “his” states. Only if Covid suppresses Republican turn-out more than Democratic turn-out in those states is it likely to change presidential election results. Excess deaths alone cannot change the electoral vote result. Nor Senate races, for that matter.
you voted for the morons that listened to the epidemiologists with models with no grounding in reality.
https://www.aier.org/article/the-modelers-thought-of-everything-except-reality/
Very primitive analysis.
The right way to do this is to estimate R0 by state using an SIR model, which is what I do. Then, you estimate the equilibrium R0 consistent with a states opening policy. Once you’ve done that, you can then predict future deaths, hospitalizations, etc.
Rick Stryker: Well, it wasn’t an analysis per se. Happy to publish your analysis, including *documentation and code*, on Econbrowser as a guest post. I am very interested in how your analysis incorporates thresholds for states re-imposing shutdowns. We can then subject your analysis to critique.
Menzie,
Thanks for the offer, but I’m using the modeling for other purposes that would not benefit from disclosing it here.
I haven’t looked too much at the problem of how to impose thresholds on shutting down states again since I don’t think the shutdowns were justified in the first place. I got into this modeling because I wanted to benchmark the dire predictions of the epidemiological models. What I found was very weak modeling that was dramatically overestimating the problem.
Rick Stryker: Well, would you then be willing to point us to a paper that you think does a reasonable job of incorporating a SIR in a model? I am curious what you view as a plausible model and plausible parameters.
Hi Menzie,
For policy analysis purposes, I think the best SEIR analysis out there is the paper by Chad Jones and Jesus Fernandez-Villaverde. They also maintain a dashboard that shows statistics, including most recent estimates of R0, by state and country. The only problem with the dashboard is that it is not updated frequently.
When I started modeling early in the epidemic, I was using econometric methods on logistic-type functional forms, and comparing my estimates to IHME. However, I quickly recognized that that approach would not work once the restrictions were lifted, so I transitioned to the SIR model formulated so that I could estimate the parameters from the data. Then I discovered that Jones et al were doing something similar. I use a different version of the model from Jones et al and some different assumptions, but I get results that are pretty similar to them nonetheless. To estimate the model, a key step is to reformulate the differential equation form of the model into difference equations.
I think their parameter choices are pretty reasonable. The one important place we depart is on the choice of the infection fatality rate (IFR), which can’t be estimated from the data but must be imposed in the model. They use a benchmark IFR of 0.8% which I think is too high in general, based on the antibody evidence, although it’s a reasonable choice for some cases such as NYC. For reference, the CDC’s current estimate of the IFR is 0.26%. The IFR is a critical parameter when considering re-opening versus shutdown policies.
Econometric versions of the SIR model are much better and more realistic than the versions constructed by mathematical epidemiologists, which assumed for example a constant R0 that was estimated outside the model and then imposed into a simulation. This is a new area for economists–the economics of pandemics. Jones et al are imposing behavior econometrically by allowing R0 to vary, but a number of people have started to put optimizing behavior into SIR models. These are not practical for policy purposes but interesting results come out.
In terms of data, I would suggest using the Johns Hopkins github covid data source . If you want to focus on Wisconsin, for example, you can get a time series of infections and deaths by county and city, estimate your own model and compare to Wisconsin’s public health model, etc. I did an early (late March, early April I think) analysis of Wisconsin and compared to their model, which I was convinced substantially overestimated the epidemic in WI. That has turned out to be accurate. Wisconsin is not alone–state public health models failed badly across the board. Academic models failed badly too. Columbia University’s model, that Cuomo was using, predicted something like 136K hospital beds needed at the peak of the epidemic in May.
Rick Stryker: Fivethirtyeight has a nifty tool with forecasts and actuals. Seems to me IHME has been more undershooting than overshooting (admittedly the current IHME is not the same as late March IHME) — curious what models were egregiously wrong, especially as we’ve gotten more data.
Rick Stryker This is a new area for economists–the economics of pandemics.
Not all that new. The SIR model template is used across a lot of disciplines, to include certain kinds of dynamic combat models. Marketing and advertising analysts use the SIR template to model customer growth and how many customers they might lose. For example, it’s the kind of model that Apple and Microsoft use when launching new product lines.
The Jones model (like all SIR models) assumes that recovered but not dead individuals are permanently removed from the susceptible population. That’s not an unreasonable assumption, but it is only an assumption. We don’t actually know whether or not a person develops immunity after having been infected, and even if they do we don’t know how long that immunity lasts. It’s entirely possible that a person who develops mild symptoms doesn’t develop an effective immunity. After all, that is why recovered patients are still asked to wear masks. And obviously the fatality rate depends on age, so if you have a relatively young population it’s possible that many of the infected will not actually be removed from the susceptible population. If you contract COVID-19 and you’re over age 60, you have about a one in seven chance of dying. That doesn’t make any difference in terms of the “removal” rate since the fatality rate is just the complement of the recovery rate, but it surely makes a moral difference. Another problem with the Jones model is that it assumes the virus observes political boundaries, so the number of susceptible individuals is only affected by the number of previous infections. People do move unless stay-at-home orders are established.
I don’t understand you comment: I haven’t looked too much at the problem of how to impose thresholds on shutting down states again since I don’t think the shutdowns were justified in the first place. Whether or not you think the shutdowns were justified or not is irrelevant in terms of modeling the facts on the ground. States did impose shutdown orders and presumably those shutdown orders had and continue to have some effect on the transmission rate of the virus. So I’m at a loss to understand what you were getting at.
On the subject of Chad Jones, I’ll note that one of his former grad students and sometime co-author (Dietrich Vollrath) argues that governments should focus on sector-by-sector Domar weights as a tool for reawakening sectors of the economy while keeping other sectors in a state of suspended animation. I agree with him. That’s the smart approach. The problem is that the Trump base is demanding that governments open up exactly those sectors with the lowest Domar weights, and too many red state governors are doing just that.
There is an entire literature on the use of SIR models in advertising research. This one has a perfect title:
https://arxiv.org/pdf/1507.06986.pdf
Viral marketing as epidemiological model
In epidemiology, an epidemic is defined as the spread of an infectious disease to a large number of people in a given population within a short period of time. In the marketing context, a message is viral when it is broadly sent and received by the target market through person-to-person transmission. This specific marketing communication strategy is commonly referred as viral marketing. Due to this similarity between an epidemic and the viral marketing process and because the understanding of the critical factors to this communications strategy effectiveness remain largely unknown, the mathematical models in epidemiology are presented in this marketing specific field. In this paper, an epidemiological model SIR (Susceptible Infected-Recovered) to study the effects of a viral marketing strategy is presented. It is made a comparison between the disease parameters and the marketing application, and simulations using the Matlab software are performed. Finally, some conclusions are given and their marketing implications are exposed: interactions across the parameters are found that appear to suggest some recommendations to marketers, as the profitability of the investment or the need to improve the targeting criteria of the communications campaigns.
Rick Stryker In my earlier comment I failed to mention something else about the Jones model. It’s hardly unique in this regard, but the way he treats stay-at-home and shutdown orders is by not only including normal contact interactions (e.g., hand washing, social distancing, wearing masks, etc.) but also policy actions that directly affect both the number of susceptible individuals (“S”) and the total population of interest (“N”). They all get dumped into the “beta” interaction term. If you econometrically estimate the “beta” term using the entire population of NYC, but forget the fact that a large percentage of the city is under a stay-at-home order and might as well be on the plant Mars, then you’re incorrectly estimating “beta”. It gets worse. If you’ve got phased re-openings, then the “S” and “N” values in the first differential equations could very well be a different than the “S” and “N” values in the second differential equation. The values of “N” would not be the same across all three differential equations. That’s a problem.
My sense is that these kinds of models are useless for making unconditional forecasts, as is true of most models. All I ask of a model is that it give reasonable projections of what could happen given a set of conditions. This isn’t about placing a wager on how many deaths there will be between now and Labor Day. What we want out of a model is something that tells us which policy actions are likely to minimize welfare losses, with welfare losses including both deaths and the considerable pain & suffering of people who contract COVID-19 but don’t necessarily die. A few days ago there was a report that someone got the good news of being released from the hospital after recovering from COVID-19. The bad news is that the hospital sent him a 181 page itemized bill. That’s a welfare loss that tends to get ignored when we only focus on deaths.
“They use a benchmark IFR of 0.8% which I think is too high in general, based on the antibody evidence, although it’s a reasonable choice for some cases such as NYC. For reference, the CDC’s current estimate of the IFR is 0.26%. The IFR is a critical parameter when considering re-opening versus shutdown policies.”
rick, this parameter is NOT a constant. it varies significantly based upon the number of infections in a community.
“Econometric versions of the SIR model are much better”
jones disagrees with this statement in the paper.
“I’m using the modeling for other purposes that would not benefit from disclosing it here.”
This is so John Bolton of you. In your case I bet you are on the payroll of the Trump White House, which requires a misleading analysis. Having it reviewed here would likely undermine your “purposes”.
” I got into this modeling because I wanted to benchmark the dire predictions of the epidemiological models. What I found was very weak modeling that was dramatically overestimating the problem.”
this is not an accurate statement. as the models and predictions were made, public policy changed (social distancing, lockdowns, etc). therefore we did not achieve the more dire predictions. this is a good thing. it is not a flaw in the models, as you are insinuating. those models were also dealing with much more uncertainty in how the virus behaved in a population, compared to the knowledge today. you know these things, but choose not to acknowledge them publicly.
“Thanks for the offer, but I’m using the modeling for other purposes that would not benefit from disclosing it here.”
you are using them to create political propaganda and sow doubt into the scientific results.
dick stryker, if you want credibility in this area, then publish your results in a peer reviewed journal. otherwise all of your comments on this topic simply amount to fear mongering.
“dick stryker, if you want credibility in this area, then publish your results in a peer reviewed journal.”
There may be a slight problem here. Once the reviewers see Rick’s paper, they will likely file it in the trash can. So it will not be published in any respected journal. Maybe THE Rick can put it up over at the National Review.
The SIR model Rick? Do you even know what SIR means? Or was it the SEIR model? OK, THE RICK loves to show off with words he cannot be bothered to explain so here is one paper that might help:
https://www.researchgate.net/profile/Andrei_Korobeinikov2/publication/23236301_Global_Properties_of_SIR_and_SEIR_Epidemic_Models_with_Multiple_Parallel_Infectious_Stages/links/5e8323cf4585150839af8c78/Global-Properties-of-SIR-and-SEIR-Epidemic-Models-with-Multiple-Parallel-Infectious-Stages.pdf
pgl,
I guess I constantly forget that when I’m talking to you baizuos that I have to define my terms. I just assume too much knowledge–I should know better.
I do mean SIR. I have not found that I need the (E)exposed state. I see that you can google. But I’d venture you know nothing at all about mathematical epidemiology.
You object to having to define your terms? Come on Rick – everyone who wants an honest and informed discourse would welcome such an opportunity. But if you think you are above the rest of us – go right ahead and babble on incoherently.
Los Angeles represents about 47% of California cumulative Coronavirus cases. As of June 14, LA records 73,932 cases while California shows 151,452 cumulative cases. During lock-down a Gompertz model seemed to track closely with CA cases, but about mid- May, cumulative cases started an inflection that out-distanced the forecast. For the past couple weeks or so the Gompertz model forecast has jumped each day by about 10,000 cases. Trying to model when the forecast increase will flatten, it seems to me CA may experience about 400,000 cases by December 2020, up from current reported cases of 151,452. During the same time period, the forecast of deaths seems to increase to about 8,000 from current reported deaths of 5,089. If the forecasts hold, then the cumulative death rate will be about 8,000/400,000 = 0.02 or 2.0%.
Since, current cumulative cases are reported at 151,452 as of June 14, 2020 and cumulative deaths are reported at 5,089. If the 400,000 case forecast and the 8,000 death forecast are somewhat close, then the death rate from new cases will be about (8,000 – 5,089) / (400,000 – 151,452) = 0.0112 or about 1.2%. This is still considerably higher than the flu death rate.
California provides a good source of data from CHHS. If you click on the CHHS link, an authorization screen will appear. Close the screen and the data should appear for download.
https://data.chhs.ca.gov/dataset/california-covid-19-hospital-data-and-case-statistics
I notice that an authorization screen did not appear when I clicked on the CHHS link. An authorization screen does appear when I click on my Excel spreadsheet that has a link.
2slugs,
I meant that the use of SIR models among economists is new. I agree that they’ve been used in a lot of other areas as well. I think economists have significantly improved these models very quickly.
I get the feeling that you are in that over-60 age category. Just to relieve some anxiety, you have much lower than a 1 in 7 chance of dying if you contract the coronavirus if you are over 60. The CDC’s current best estimate is that the IFR is 1.3% for those over 65 and 0.2% for those between 50 and 64. The 1.3% in the over-65 category is dominated by the tail, which is people 80+ in nursing homes and people with significant co-morbidities. If you are 85+ and in a nursing home, then you might indeed have a 1 in 7 chance of dying if you contract the coronavirus.
When I said that I wasn’t focused on re-opening policy, I just meant that that wasn’t the focus of my attention. I’m doing the modeling to understand better where the economy might be going.
Rick Stryker Yes, I am in the 60+ category. In my state those over 60 account for only 17% of all confirmed COVID-19 cases, but 86% of all deaths. If you contract COVID-19 there is a 13.7% chance of dying if you’re in that age group.
As to modeling the economy, I would recommend buying a copy of the BEA’s RIMS II model. It’s an I/O based model broken out by sectors. You can ask the BEA to tailor it by region/state/county.
https://apps.bea.gov/regional/rims/rimsii/
2slugs,
It sounds like you are dividing fatalities by reported cases. But reported cases are just a subset of all infections. To get the IFR, you have to estimate true infection rates, which are done by antibody studies. There are now many studies that have done that estimation, and they find IFRs to be much lower. Nothing like 1 in 7, which is at least an order of magnitude too high.
I’m dividing fatalities by confirmed cases. I’m also assuming that all still in recovery will survive, which is almost certainly not true. It turns out that the serology tests for antibodies add almost no value…well over 90% of serology tests of people who thought they might have had COVID-19 are negative and the total number of positive serology results is also less than 10% of confirmed cases. Also, over 7% of everyone in my state has been tested, so we probably have a pretty good idea where things stand. The IFR numbers that you’re using are simply not credible.
One of my sisters lives in Paris…her husband is a bigshot at the OECD. A few months ago Paris was a hotspot and they both came down with COVID. They probably should have gone to the hospital, but at the time the hospitals in Paris were overwhelmed. Paris imposed a very strict lockdown regime and eventually got things under control. When I talked to her earlier this week she said that Paris was starting to reopen. But just like here, Parisians seem to have a short memory because they were returning to their old ways.
In another post you said:
As we know, hospitals cancelled elective procedures to gear up for covid patients who didn’t arrive. They ended up furloughing workers and taking a huge financial hit. The motive for “bending the curve” was to make sure the hospital system was not overrun, and in that regard the models failed pretty spectacularly.
That was not the only reason hospitals cancelled elective procedures. Another reason was that they were critically short of PPE and hospitals did not want to consume dangerously low stockpiles of PPE on elective procedures. For example, my niece is a Navy doctor at Bethesda. When they sent her out into COVID-land they issued her one N95 mask and told her to make the most of it. Here aunts and uncles had to scrounge around to find masks and gowns. The primary reason for curtailing medical procedures was to conserve PPE. A secondary reason was that they wanted to segregate COVID patients from other patients needing hospitalization. The PPE problem was an example of Trump’s incompetence. In some parts of the country PPE supplies were adequate and states had plenty of ventilators, but other states were desperate. Trump decided that each state should go get its own PPE and ventilators. That’s just godawful logistics. Any multi-echelon logistics model will tell you that PPE should have been centrally procured, stored and issued. Instead we ended up with a suboptimal distribution. It’s exactly the same mistake that “killer” units used to make under the Army’s old war reserve policies in the bad old days before anyone heard about MIME models.
“It sounds like you are dividing fatalities by reported cases. But reported cases are just a subset of all infections.”
Tell that to Trump. He is saying that if we stopped testing, this virus will just go away.
Menzie,
Yes, I’ve looked at a number of the models that 538 follows.
During the shutdown phase of the epidemic, up until early May or so, I thought IHME had the best model, although they sometimes had to issue large re-statements, given that they estimated the model too infrequently. I would estimate my versions daily and I could often predict when they’d need to revise their results significantly. However, IHME was very wrong in its projections of hospital beds needed, ICU beds, ventilators, etc. Depending on the state they could be off by factors of 5 or higher. Other models designed to predict hospital utilization got it even more wrong, however. The DC government was using the Penn hospital model, which overestimated hospital resources needed even more. As I mentioned, Columbia’s model projected that NYC would need 136K hospital beds at the peak, by early May, and order of magnitude too high. The modeling estimates that Cuomo was getting led to him panicking about the number of ventilators he thought he would need, which was 30-40K. Of course, the actual numbers were an order of magnitude smaller.
When looking at projecting hospital utilization, all the models failed dramatically. As we know, hospitals cancelled elective procedures to gear up for covid patients who didn’t arrive. They ended up furloughing workers and taking a huge financial hit. The motive for “bending the curve” was to make sure the hospital system was not overrun, and in that regard the models failed pretty spectacularly.
The model that started it all, the Imperial College Model, was the basis for the coronavirus task force saying that 2 million people in the US and 500K in the UK would die in the absence of a shutdown. I looked at that model in detail. It’s a bad model that dramatically overestimated the true situation. For similar examples of bad models that misled policy makers, I would refer you to some of the state models. I already mentioned Wisconsin’s model , which overestimated the epidemic. Minnesota’s model did the same.
“rick, this parameter is NOT a constant. it varies significantly based upon the number of infections in a community.”
Baffling, you need to take up your complaint with Jones and F-V, since they use 0.8% across the board. I already said in my comment 0.8% is a reasonable estimate for NYC, but is too high across the board, so I’m not treating it as a constant everywhere.
“Econometric versions of the SIR model are much better”
“jones disagrees with this statement in the paper.”
Really Baffling? Care to quote from the paper to back up your assertion
“The first thing to (re)emphasize about these simulations is that we are economists, not epidemiologists. These are speculations based on estimation and simulation of a relatively simple and standard model. We find them helpful for thinking about the dynamics of the pandemic, but great care should be taking in using these numbers to inform any policy discussion.”
this is a quote from jones. only in the strange world of dick stryker would this be construed as stating they are “much better”. perhaps you need to improve on your reading comprehension dick.
” I already said in my comment 0.8% is a reasonable estimate for NYC, but is too high across the board, so I’m not treating it as a constant everywhere.”
are you treating it as a constant over time for a given location in your analysis?
Rick i must assume your silence is an admission you were wrong but not man enough to own up to it.
“The motive for “bending the curve” was to make sure the hospital system was not overrun, and in that regard the models failed pretty spectacularly.”
dick, in houston the hospital and icu beds are filling up once again. why? because dear leader abbott has not tried to “bend the curve” over the past two months. now we are getting exactly what the predictions indicated. so once again, rick stryker, your analysis is incorrect.