Today, we’re fortunate to have Willem Thorbecke, Senior Fellow at Japan’s Research Institute of Economy, Trade and Industry (RIETI) as a guest contributor. The views expressed represent those of the author himself, and do not necessarily represent those of RIETI, or any other institutions the author is affiliated with.
Japan has taken several steps to limit the spread of COVID-19. In March Prime Minister Abe requested that Japanese schools close. In April the Japanese government imposed a voluntary lockdown. This included asking people to work from home, requesting that non-essential businesses close, and demanding that crowds not assemble at ballgames and other large events. The government also imposed restrictions on travel from abroad. By the end of May it lifted the state of emergency and eased some of the restrictions. How are the pandemic and the government’s attempts to control it affecting Japanese businesses?
One way to investigate this is to examine how Japanese stock prices have responded. In theory stock prices equal the expected present value of future cash flows. They thus indicate how investors believe companies will be affected. Stock prices are also forward-looking, implying that they provide information about how market participants expect companies to perform in the future. Although prices may be influenced by excessive optimism and pessimism, the relative performance of different sectors sheds light on how they are faring relative to their peers.
Aggregate Stock Prices in Japan
Figure 1 plots stock prices for the entire Japanese stock market from 1 January 2020 until 29 May 2020. It shows that prices fell about 30 percent between 24 February and 16 March. Prices have since rebounded and at the end of May were down about 6 percent relative to their value on 24 February.
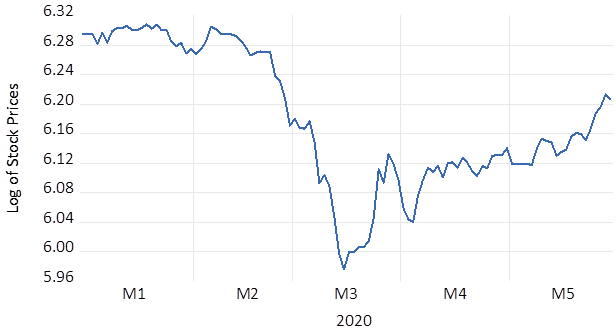
Figure 1. Japanese Aggregate Stock Prices. Source: Datastream database.
Examining Japanese Sectoral Stock Returns
To see how individual sectors have performed, daily returns on each sector can be compounded from the beginning of the Japanese stock market fall on 24 February 2020 until the end of May 2020. Returns can also be decomposed into the portion due to macroeconomic variables and the portion due to sector-specific factors. This decomposition sheds light on whether sectoral differences in performance are driven by the macroeconomic environment (e.g., the slowdown in the world economy) or by idiosyncratic factors affecting individual sectors (e.g., travel restrictions).
A regression equation is used to estimate how macroeconomic variables affect returns. Daily stock returns for Japanese sectors are regressed on 1) daily returns for the overall Japanese stock market, 2) daily returns for the world stock market, 3) the daily percentage change in the yen/dollar exchange rate, and 4) the daily percentage change in the dollar spot price of Dubai crude oil. These data come from the Datastream database. The sample period extends from 1 January 1993 to 29 May 2020.
This framework is what economists call a four-factor model of stock returns. The four right-hand side variables capture the effects of conditions in the Japanese economy, conditions in the world economy, exchange rates, and oil prices on stock returns. The portion of returns not explained by these four macroeconomic variables (the residuals) then captures sector-specific responses.
Results
Table 1 presents the findings for Japanese sectors. A value less than one implies that one yen invested on 24 February had lost value by 29 May and a value greater than one implies it had gained value. Column (2) presents the results for the overall stock return in a sector, column (3) for the portion of the return driven by macroeconomic factors, and column (4) for the portion driven by idiosyncratic factors.[1] The rows of the table are ordered from the sector that performed worst during this period to the sector that performed best.
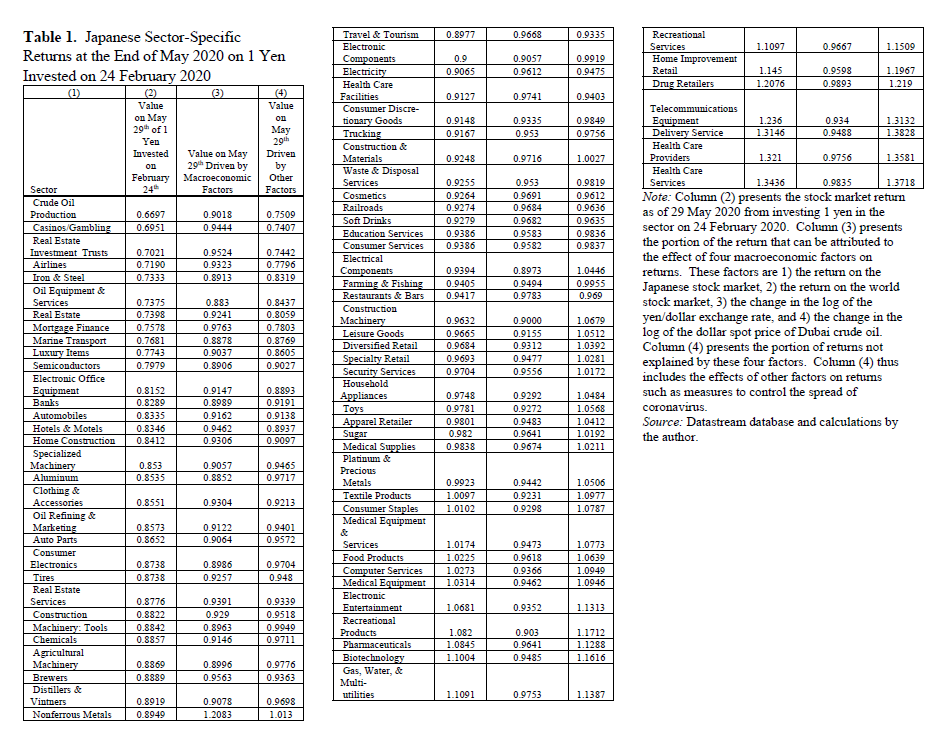
Sectors related to real estate have suffered. The value for real estate investment trusts (REITs) in column (2) is 0.7021, the value for mortgage finance is 0.7398, the value for real estate is 0.7578, and the value for home construction is 0.8412. To understand these numbers, the value of 0.7021 for REITs indicates that 1 yen invested in real estate investment trusts on 24 February 2020 was worth only 0.7021 yen on 29 May 2020. Examining columns (3) and (4) indicates that real estate has suffered not primarily because of the macroeconomic environment but rather because of other factors. The state of emergency in particular has interfered with real estate transactions.
Sectors related to travel and leisure have also been damaged. The value for casinos and gambling in column (2) is 0.6951, the value for airlines in 0.7190, the value for hotels & motels is 0.8346, and the value for travel & tourism is 0.8977. Column (3) indicates that these losses were not driven primarily by macroeconomic factors. Rather they reflect restrictions on travel that have plagued the industry and also the postponement of the Tokyo Olympics.
The oil sector has also performed poorly. One yen invested in crude oil production decreased to 0.6697 and one yen in oil equipment & services to 0.7375. Columns (3) and (4) indicate that while macroeconomic factors such as low oil prices have contributed to these losses, more of the contribution has come from other factors. Lockdowns and travel bans have caused demand for oil to collapse and decimated the industry.
The automobile sector and related industries have also been hit. The value for automobiles in column (2) is 0.8335, for automobile parts 0.8652, for iron & steel 0.7333, and for tires 0.8738. For automobiles both the macroeconomic variables and other factors have contributed equally to the losses. On the macroeconomic front exports have collapsed. On the sector-specific front many dealers remained shut during the emergency.
The electronic office equipment sector has lagged. Its value in column (2) is 0.8152. This reflects the fact that many offices have been closed.
The machinery sector has also suffered losses. One yen invested in specialized machinery stocks decreased to 0.853, one yen in tool stocks to 0.8842, and one yen in agricultural machinery to 0.8869. Columns (3) and (4) indicate that these losses were driven by macroeconomic factors. The slowdowns in Japan and the rest of the world have frozen demand for machinery.
On the other hand, sectors related to peoples’ health have done well. The value in column (2) for pharmaceuticals is 1.0845, the value for biotechnology is 1.1004, the value for drug retailers is 1.2076, the value for health care providers is 1.321, and the value for health care services is 1.3436. Columns (3) and (4) indicate that these gains were not driven by macroeconomic variables but entirely by idiosyncratic factors. The COVID-19 Crisis has been a boon for health-related industries.
Businesses that provide entertainment and distractions at home have also gained. The value in column (2) for telecommunications equipment (including smartphones) is 1.236, the value for recreational services is 1.1097, the value for recreational products is 1.082, and the value for electronic entertainment is 1.0681. These gains were not driven by macroeconomic variables but entirely by other factors. As people have huddled at home, their demand for entertainment products has soared.
Delivery services have also benefitted. Its value in column (2) is 1.3146. Again these gains were not driven at all by macroeconomic factors. Delivery services have provided a critical lifeline for those forced to stay at home.
Results from the U.S. Stock Market
For comparison Table 2 presents analogous results for U.S. sectors. Daily stock returns on U.S. sectors are regressed on 1) daily returns on the overall U.S. stock market, 2) daily returns on the world stock market, 3) the daily percentage change in the dollar spot price of West Texas Intermediate crude oil, 4) the daily change in the spread between the 10-year and 3-month Treasury rates, 5) the daily change in the 5-year breakeven inflation rate calculated from Treasury securities, 6) the daily change in the spread between Moody’s Baa corporate bond yield and the yield on 10-Year Treasury securities, and 7) the daily change in the interest rate on three-month Treasury bills. These data come from the Datastream and Federal Reserve Bank of St. Louis FRED databases. The sample period extends from 3 January 2003 to 5 June 2020.
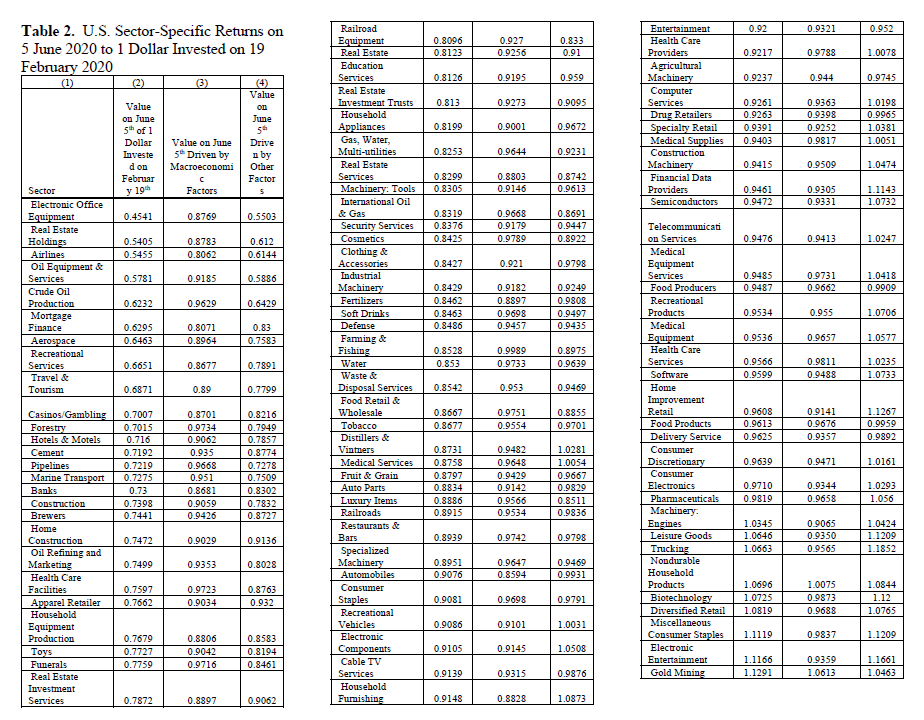
Note: Column (2) presents the stock market return as of 5 June 2020 from investing 1 dollar in a sector on 19 February 2020. Column (3) presents the portion of the return that can be attributed to the effect of seven macroeconomic factors on returns. These factors are 1) the daily return for the overall U.S. stock market, 2) the daily return on the world stock market, 3) the daily percentage change in the dollar spot price of West Texas Intermediate crude oil, 4) the daily change in the spread between the 10-year and 3-month Treasury rates, 5) the daily change in the 5-year breakeven inflation rate calculated from Treasury securities, 6) the daily change in the spread between Moody’s Baa corporate bond yield and the yield on 10-Year Treasury securities, and 7) the daily change in the interest rate on three-month Treasury bills. Column (4) presents the portion of returns not explained by these seven factors. Column (4) thus includes the effects of other factors on returns such as measures to control the spread of coronavirus. Source: Datastream and Federal Reserve Bank of St. Louis FRED databases and calculations by the author.
The U.S. stock market began falling on 19 February 2020. Table 2 thus presents the return on 5 June 2020 to one dollar invested in a sector on 19 February. As with Japan, businesses related to real estate, travel & leisure, oil, and electronic office equipment have suffered. The losses have been larger for U.S. sectors than for Japanese sectors. As with Japan, the primary driver of these losses has not been the macroeconomic environment but rather sector-specific responses during the crisis. The machinery sector in the U.S. has also done badly largely because of macroeconomic factors. Also like Japan, the biotechnology and electronic entertainment sectors have done well and these gains have been driven by sector-specific responses. Unlike Japan, however, the pharmaceutical sector has not gained. Consumer staples in the U.S. have done well during the crisis, supported by hoarding behavior.
Conclusion
This column has investigated how Japanese sectoral stock returns have performed during the Coronavirus Pandemic. It has also investigated whether these responses were driven by macroeconomic or by sector-specific factors. The Japanese machinery sector was harmed by the macroeconomic environment, as the slowdown froze demand for capital goods. The real estate and travel & leisure sectors were harmed by specific influences such as the effects of the voluntary lockdown and travel restrictions on these industries. Electronic office equipment and automobiles have been hit by both the macroeconomic environment (e.g., the slowing world economy) and by idiosyncratic factors (e.g., the closing of auto dealerships). On the other hand, sectors related to peoples’ health and their ability to obtain entertainment and goods and services at home have done well. Their gains have been driven entirely by sectoral characteristics and not by macroeconomic changes. U.S. sectors have exhibited many of the same patterns. These findings may provide information for policymakers as they seek to promote recovery from this devastating crisis.
[1] Because of the effects of compounding, the loss or gain in column (2) is not simply the sum of the losses or gains in columns (3) and (4).
This post written by Willem Thorbecke.
People say that the COVID death rate is 0.40% ! This was circulated in several news channels also !
Me Thinks the death rate is beyond 10%,on aggregate count,and for some nations it is way beyond.
As per – https://www.worldometers.info/coronavirus/#countries = there are 7.5 million cases and 420000 dead.Simple numerics place it at proximating 6%.
Wrong me says ! dindooohindoo
India,Brazil,Russia have seen a sharp rise in cases,in the last 30 days.40% of their cases came in the last 30 days,and for India,it will worsen exponentially.If you see the kill data of the RIB in the BRICS – it has increased sharply,in the last 30 days (which proves my thesis)
People dying today,were in the quasi morgue (hospitals) 30-60 days ago.Let us take it,at 30 days.
So we rewind to 30 days ago,and exclude the jump in RIB of BRICS,in the last 30 days. So we have say 4.5 million cases and the kill quant is 420,000
Rate proximates 10% ! But that is also wrong,as the infected are NOT solely on RTPCR mode.Many nations cannot afford it and are doing antibody tests.An antibody positive may be RTPCR negative,and the vice versa is less likely. If you exclude these specimens from the infected tally,the % rises further.
Also have to exclude the recovered cases – as those with immunity will recover in 30 days – AS THE VIRUS was DESIGNED THAT WAY.Unlike HIV and Cancer – where patients are NOT likely to recover- on a generic mode.But those who recover from COVID -WILL (in part) come back again,and then die.That will double count the infected cases.Hence,we exclude the recovered cases (which are 4 million,as per site stated above).
These Johnnies who recouped,may have been infected,say 15 days ago – and if you rewind to 15 days ago,and deduct the spike in the RIBs of the BRICS – you will have an infected base of,say 6 million.If you remove the recovered (4 million),and then ratio it,to the dead of 420000 – then you have a kill ratio of 21% !
Cannot compare the dead to the entire population – as of this instant – as it would include billions of aged,morbid and asymptomatics – who will get infected very soon.
If we take a 1 year horizon – then post the 1 year – you could take the global population – as that by that time,the virus would have had enough time,to spread,evolve and mutate (across the latitudes and seasons).At that stage,a ratio w.r.t the population,would be a meaningful statistic – to benchmark intra and inter se,with other diseases.By that time the death rate will mature and the complete breakdown of the health imfrastructure will be apparent (to explain the future geometric rise)
This article is well worth a look, but is missing a couple of qualifications. One is conventional – “the stock market is not the economy”. Given the problems with projecting future economic performance from current economic data, the value of equity-based estimates of future economic performance is quite probably higher now than in normal times.
The other qualification that is needed is that the two equity markets are not directly comparable as indicators of future economic activity. Two obvious differences are differences in domestic policy intervention and differences in exposure to foreign revenues,
Not to say we should not include the results of this piece in our thinking, just that we should be aware of its limits.