Reverse radical or V-ish (or W?)
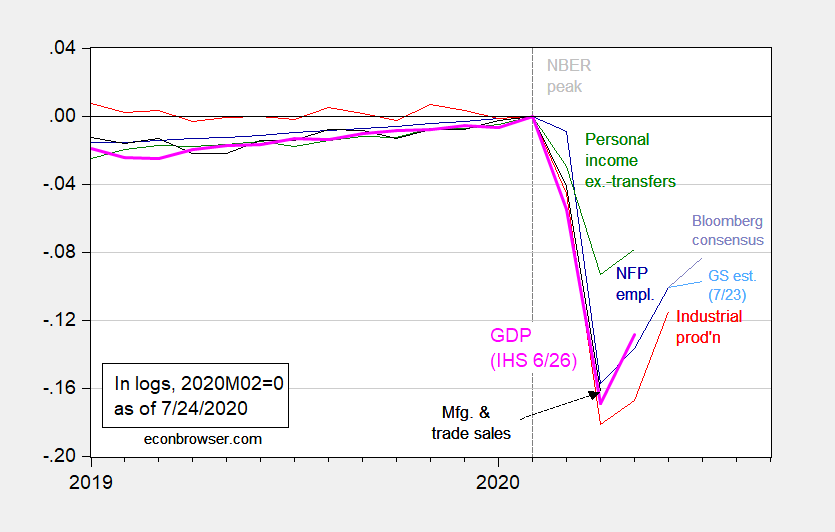
Figure 1: Nonfarm payroll employment (blue), industrial production (red), personal income excluding transfers in Ch.2012$ (green), manufacturing and trade sales in Ch.2012$ (black), and monthly GDP in Ch.2012$ (pink), Bloomberg consensus estimate at 7/24 (blue gray), Goldman Sachs Employment Tracker estimate based on data thru 7/7 (sky blue), all log normalized to 2019M02=0. Source: BLS, Federal Reserve, BEA, via FRED, Macroeconomic Advisers (6/26 release), Bloomberg, Goldman Sachs (7/23/2020), NBER, and author’s calculations.
https://www.youtube.com/watch?v=O6rHeD5x2tI
Uuuuuuuuhh, NOT a V.
I’ll take Twin Bing candy trivia for $1000 Menzie.
Some of the components so not look V-ish, such as industrial production, which has already been noted in a previous post here. But the GDP estimate looks more like a V than any other letter or symbol. Do you really want to insist on making this nonsense claim here just because it fits with claims you have previously made? I realize that you are still frustrated at having mischaracterized the behavior of consumption in May.
Of course this whole exercise in labeling a pattern by a letter is strictly subjective, so there is no way to prove or disprove if a certain pattern resembles a V or not, in contrast to your simply false statements regarding consumption in May, which involved actual numbers.
How does the quarterly measure of GDP get determined? Monthly moving average? June vs Sept total for Q3?
Because I could see the moving average being low for Q2 because April/May are do bad, and Q3 being higher due to the artificially low Q2, but Sept could be less than June.
Am I reading that right, Prof Chinn? Or is it done some other way?
Jake formerly of the LP: BEA compiles data sources for all sorts of economic activity — for GDP (as opposed to national income), spending in various categories, for each quarter. These are added together. For the first release, some data are not available yet (e.g., trade), so there is some estimation involved. Monthly GDP is estimated in a variety of different ways, depending on the firm. Often, correlations between various indicators (not always spending) and GDP are exploited. In general, the monthly GDP is scaled eventually to match quarterly GDP (which is itself expressed at *annual* rates).
So quarterly GDP is not literally a moving average; it is (or should be) an average of the corresponding three months worth of monthly GDP.
What I really need to know is, if I’m making/prepping my own shrimp on a semi-happy Friday evening, and I take out that black string digestive tract with the shrimp poo in it, is the labor and toil I am using to take the shrimp poo out counted as part of national GDP??
Moses Herzog: No.
Was hoping to give you a chuckle out of that. : )
I am the last hold out on creepy uncle “Uh, that’s not that funny”) humor. Who knew??
There have been some arguments for/from “stay at home Moms” on that, yeah?? I think there’s a argument there, but I have to confess I don’t feel that strongly about it, other than the people in the immediate social circle showing their appreciation for that labor or “output”. In a pragmatic way though, I don’t think it’s terribly helpful to the statistics themselves.
Kudlow alert!
https://talkingpointsmemo.com/news/kudlow-covid-19-v-shaped-recovery
He was on CNN with more happy talk. Listen to this interview. First he suggests any figures from the BLS cannot be trusted. Then he says most economists agree with Kudlow’s happy talk about 20% growth next quarter. Ah yes – we all trust Kudlow the Klown and if the official numbers are not so happy – these numbers must be cooked.
Did you catch this part with Wolfers?? That you and others might enjoy it:
https://www.cnn.com/videos/politics/2020/07/26/economists-kudlow-v-shaped-recovery-coronavirus-nr-vpx.cnn
*Thought you and others…… Wow, I don’t know how I did that one. phonetics??
Is this obvious extreme bigot trying to get himself ostracized AND fired??
https://twitter.com/haralduhlig/status/1286086897467641857
I think this Uhlig tweet is actually a “teaching moment” both for the economics profession, and for society in general. In some very narrow but very important ways donald trump has done us all a favor. Why would I say that?? Where could I be going with that statement??—that donald trump has done us a “favor”??? Because we sometimes assume racism is a thing limited to the deep south USA, and not only do we sometimes subconsciously “compartmentalize” racism to certain regions (“regions” read as rural or south) but we also think that racism is confined to certain education levels. The assumption is the higher one’s education the less apt they are to be racist. Generally this is in fact true. But economists and/or other white collar professions shouldn’t assume that even in their high education stratosphere—flaming racists like Harald Uhlig do not “walk amongst them”.
Would Harald Uhlig have made these statements under President Obama, instead of now, when he thinks the atmosphere is an advantageous time for him to exhibit his racism out in the open?? That is a debatable question. I leave it to the reader to weigh the evidence for themselves as timing and situation now stands. As far as I know Uhlig’s first questionable comment came in a letter to NYT January of 2016. Yes, roughly 1 year before trump took office. But Uhlig’s comments get much bolder after January 2017.