Some idle speculation as we head into more closures: What if hospitality and leisure and retail employment dropped back to May levels, and the rest of nonfarm payroll employment increased by 2 million (it increased by 1.972 million in June). Then what would overall employment look like?
Monthly Archives: July 2020
Even Before the Recession, Employment Was Slowing
Quarterly Census of Employment and Wages data show the divergence from the establishment survey measurment of total employment in the months before the peak.
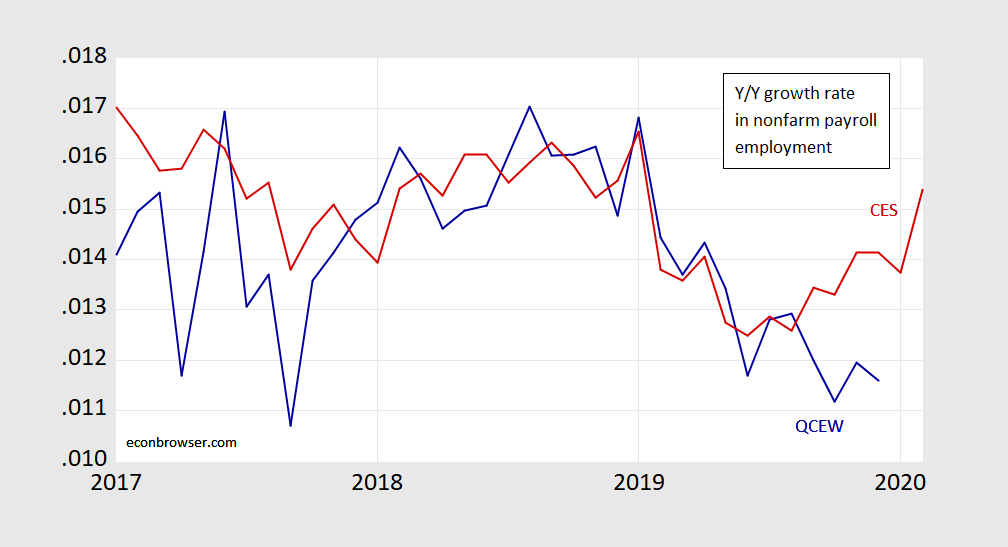
Figure 1: Year-on-year growth rate in nonfarm payroll employment from establishment survey (red), from Quarterly Census of Employment and Wages (blue), both calculated as 12 month log differences. Source: BLS, author’s calculations.
NBER identified peak is 2020M02.
Business Cycle Indicators as of July 2
Nonfarm payroll employment continues to rise in June (although it remained over 10% below peak, in log terms). Here is a graph of some key variables tracked by the NBER’s Business Cycle Dating Committee.
Excess Deaths, March-May 2020
CDC Criteria Not Met (out of 4), by State
CDC has defined 4 criteria for relaxing restrictions (called “gating criteria). Only two states now meet all the criteria, a lot meet 0 or only 1 — 11 states.
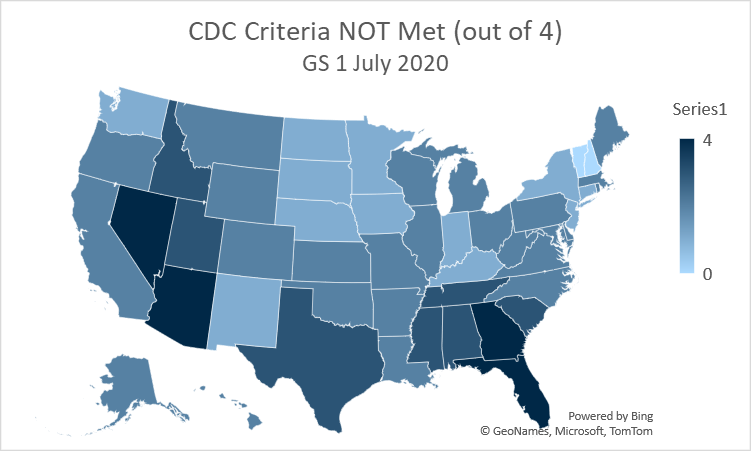
Source: Goldman-Sachs, 7/1/2020.
Florida meets none; Texas meets 1, but is just teetering on slipping into none.
Declining Mobility in TX, FL
From Wells Fargo’s mobility trends report, today (for Google data thru 27th, Apple data thru 29th):
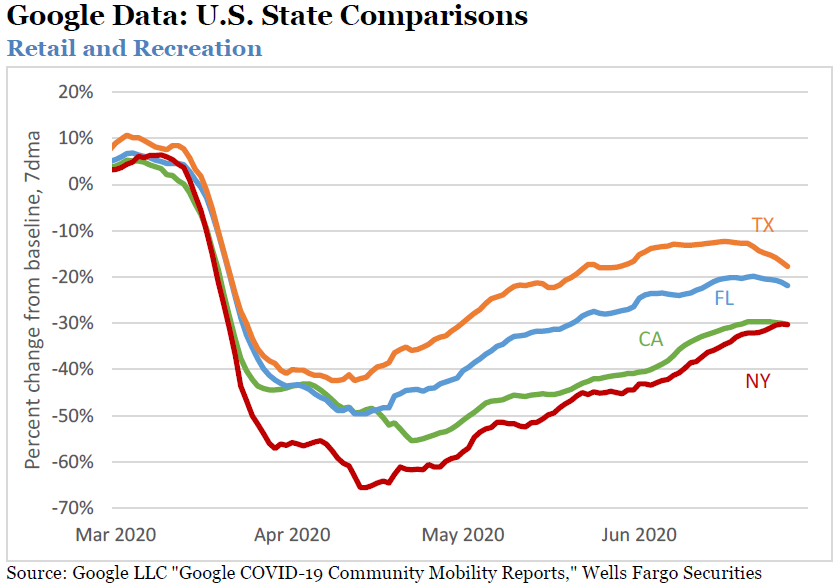
These types of data are used to infer economic activity at the regional level. Note that this data is not seasonally adjusted.
Continued Recovery in June (II)
ADP releases its figure for private nonfarm payroll. Bloomberg consensus is for BLS is for an increase.
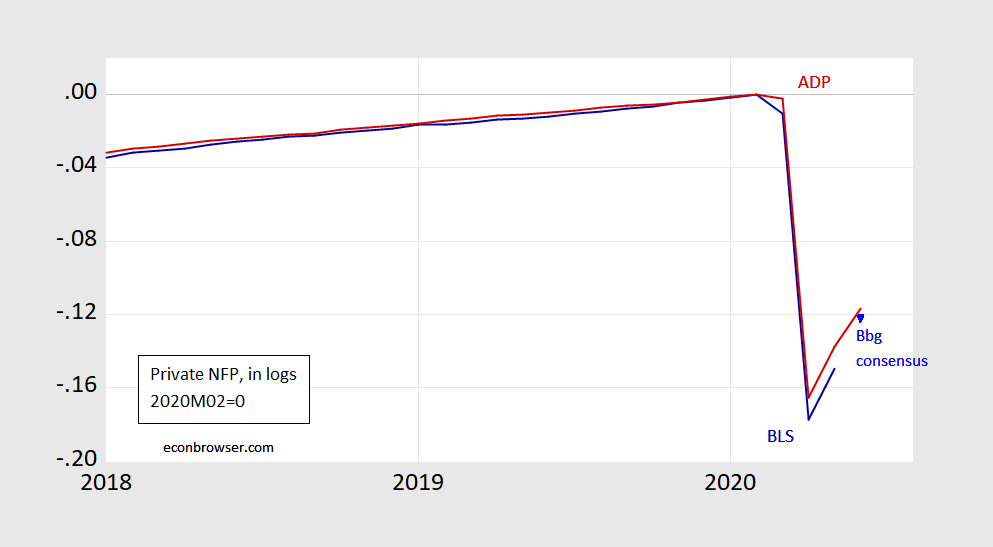
The obvious question: will July register an increase, as restrictions are re-instituted?
Continued Recovery in June?
The New York Fed’s Weekly Economic Index suggests yes.