With today’s employment situation release, here are five key indicators referenced by the NBER’s Business Cycle Dating Committee in Figure 1: Nonfarm payroll employment (blue), industrial production (red), personal income excluding transfers in Ch.2012$ (green), manufacturing and trade sales in Ch.2012$ (black), and monthly GDP in Ch.2012$ (pink), all log normalized to 2019M02=0.
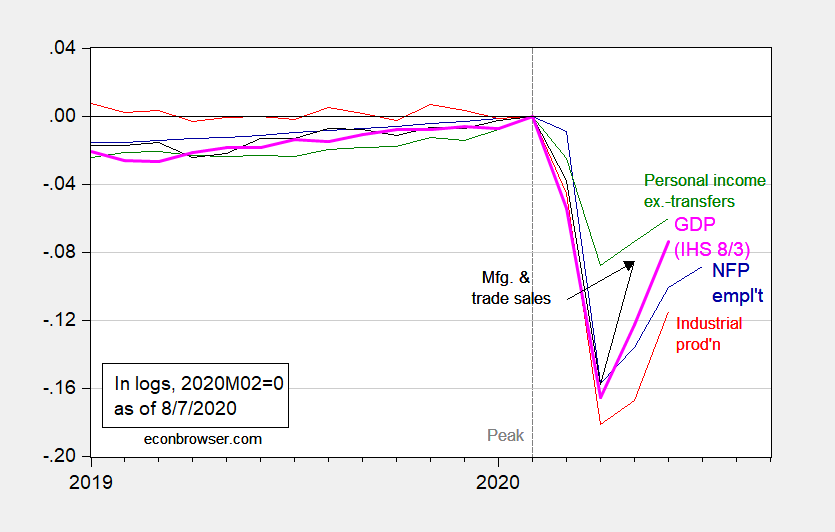
Figure 1: Nonfarm payroll employment (blue), industrial production (red), personal income excluding transfers in Ch.2012$ (green), manufacturing and trade sales in Ch.2012$ (black), and monthly GDP in Ch.2012$ (pink), all log normalized to 2019M02=0. Source: BLS, Federal Reserve, BEA, via FRED, Macroeconomic Advisers (8/3 release), NBER, and author’s calculations.
Since the graph is in log-deviations, one can read off the slope the growth rate. Nonfarm payroll employment has clearly decelerated substantially, matching pretty closely the Bloomberg consensus, and above the implied level gleaned from the Goldman Sachs employment tracker. Employment is now 11.2% below peak (in log terms).
Update, 8/8:
rjs notes the special role of consumption. Here are some consumption specific indicators, normalized to NBER peak.
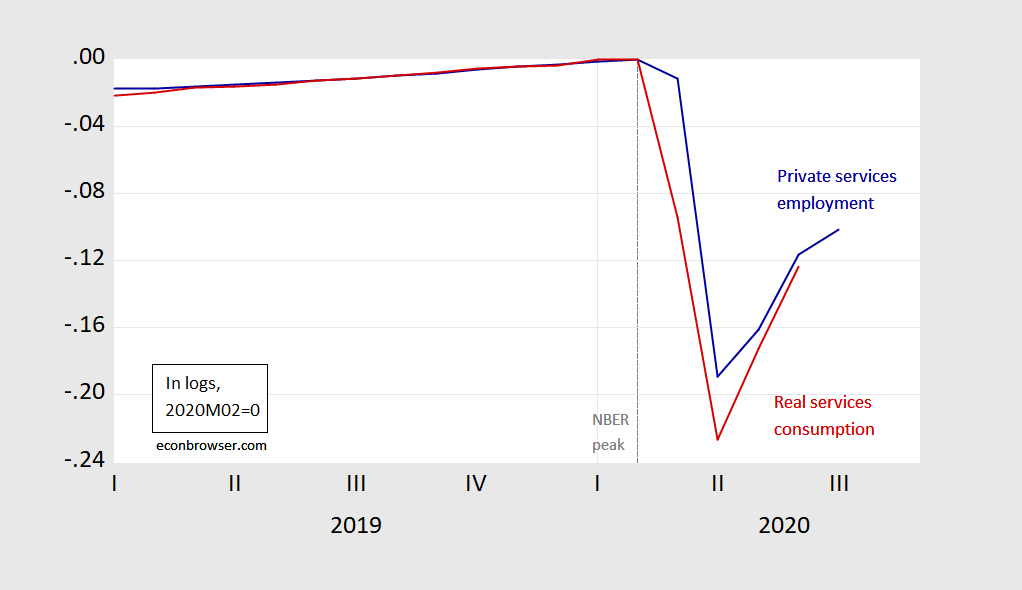
Figure 2: Private services employment, 000’s, s.a. (blue), and services consumption expenditures, bn. Ch.2012$ SAAR (red), both in logs, 2020M02=0. Source: BLS, BEA, and author’s calculations.
I am beginning to get surprised we are not seeing that GDP pattern start to flatten yet. Still looks like a V moving up as fast as it was in May. But while the newly unemployed numbers were down a bit this week from last, the new hires numbers are much further down, and the retail sales growth has also sharply declined, although still positive. It would seem from these figures that after a slow takeoff industrial production and manufacturing sales are what are keeping that V in the GDP pattern going for now, although especially the employment numbers do not sound like they are consistent with it.
But then, I have noted several times that normal relattionships are broken down now, and there is an enormous amount of noise in all this data.Really hard to pin down what is gong on.
The hypnosis trances Larry Kudlow has been doing on Barkley Junior are amazing. Did you guys know Larry had that power??
This “thing” going on with Barkley Junior’s mind is very intense, and reminds me of the time David Letterman and some of his staff went to visit hypnotist Ruth Roosevelt. That….. or some of the people hanging out drinking strawberry flavored punch in Jonestown.
Moses,
I am just looking at the figure that Menzie posted here. I and the CBO and many others have all been agreeing with each other that the GDP curve will flatten, but that is not what Menzie posted here. I am just looking at what Menzie posted, not listening to Kudlow.
This is getting weird. I promised to shut up but you keep saying things that are just so off the wall. We just had a thread where I noted that the pattern looked like a V, but I have been forecasting since sometime in June that the clearly evident V would flatten. In that thread, while you continued to babble about SAAR numbers a bunch of people declared that indeed it looked like a V, but would probably flatten.
The news is that it has not flattened yet, which is what I was expecting. But somehow you somehow are still pretending that what we are not looking at a V. Just when are you going to get real with what the discussion is about here? It is not is it a V, it is how long will it continue to be a V.
As a visual analysis kind of guy, I will say without hesitation that it looks like an asymmetrical V to me. I also expect the short leg to flatten out sooner rather than later. But here we are. It sure is a V so far.
Employment was way up in Leisure and Hospitality. This is the sector that saw the largest employment bump. That’s the good news. The bad news is that hourly earnings collapsed:
https://fred.stlouisfed.org/series/CES7000000003
And to add to the pain, average weekly hours fell significantly as well.
https://fred.stlouisfed.org/series/AWHAELAH
Working fewer hours for less money per hour. A MAGA success story. Imagine how much worse things would be if workers didn’t have that extra $600/week as leverage against employers.
And in the Retail sector hourly earnings were up a bit to almost April 2020 levels, but hours worked fell back to where they were in April.
https://fred.stlouisfed.org/series/AWHAERT
Average hourly wages fell slightly in the Professional & Business sector.
https://fred.stlouisfed.org/series/CES6000000003
The increase in government employment was largely due to the seasonal effects of the pandemic on teachers and census employment.
At a guess, the swings in hospitality wages are because the lowest paid were laid off in droves, then rehired. It’s a composition thing. Lay off lots of low-wage workers while keeping managers and the average wage rises. Rehire and the average falls.
The workweek has its own issues. Not running a restaurant myself, I’d guess that the kitchen was run by people working long hours during the carry-out phase. Once seating resumes. part-timers are rehired to wait tables.
The ability to guess at what’s driving the swings doesn’t change the fact that it’s a terrible sector for workers.
macroduck It’s a composition thing. Lay off lots of low-wage workers while keeping managers and the average wage rises. Rehire and the average falls.
That’s a plausible (and likely) explanation. Unfortunately, that also implies that the return of those marginal workers to the workforce means the employment boom in Leisure and & Hospitality won’t have much effect on GDP. Part-time workers earning minimum wage don’t contribute a lot to GDP.
Yep, but they do contribute to hospital income – mostly face-to-face work.
Some stats Mr. Paul Krugman linked to:
https://d3n8a8pro7vhmx.cloudfront.net/prosperousamerica/pages/5561/attachments/original/1596512047/Cornell-JQI-RIWI_Poll_Report_-_Second_Wave_of_Layoffs_Well_Under_Way_-_080420_FINAL.pdf?1596512047
Make certain to read ALL of Tedeschi’s connected comments in the thread as you scroll down, not just the first comment:
https://twitter.com/ernietedeschi/status/1290971597508169729
As Krugman states, the unemployment numbers (ADP and “official” employment for July) are from the second week of July. That’s 3 weeks ago. Now…… you have heard the phrase “Age in doggy years”, yes?? What would you gauge 3 weeks of economic stats “In COVID-19 time”??
The politics of employment in the political sphere are on display for all to see. Somewhat less obvious is the politics, or anyhow the power dynamics, of the private sphere. Management is, in many cases, threatening workers with job loss if they refuse to risk Covid infection. That risk is for themselves and there families, along with the wider circle of people they necessarily come into contact with outside of work. Management gets a huge lever if the federal unemployment supplement is not reinstated. The first wave of unemployment included a lot of people sent home by management. The second wave is likely to rely mostly on government orders, because management has had time to rethink its reaction to the pandemic. Mask up or don’t, but get your backside to work.
Progressives seem likely to have a shot at institutionalizing worker protections and (fingers crossed) counter-cyclical fiscal tools which benefit households directly. The lack of humanity displayed by some business managers and owners, as well as by Republican politicians, requires a big, difficult-to-skate-around change in labor laws.
The demand to eliminate workplace liabilty to covid is a damning assault against the working class. Not only are republicans trying to force minimum wage workers back to dangerous environments, they want to refuse any liabilty for management Misconduct during the pandemic. Insulting.
A new congressional investigation implicates Trump’s ace trade negotiator Peter Navarro in a $500 million coronavirus fiasco. It seems that Navarro re-negotiated an Obama era contract with Dutch medical company Philips to provide 43,000 ventilators at five times the previously agreed price. Well, at least they weren’t Chinese, so there’s that going for Navarro’s deal.
https://oversight.house.gov/sites/democrats.oversight.house.gov/files/Economic%20and%20Consumer%20Policy%20Subcommittee%20Staff%20Report%20on%20Ventilators%20Contract.pdf
Editorial CORRECTION: In his criminal escapades he strictly goes by the name Ron Vara. Not to be confused with Doris Kearns Goodwin. Or, as Oprah Winfrey calls her during Kearns’ tours on the pro-wrestling circuit “Dorry the Super-Plagiarizer”.
Lately I’ve been digging deep, to find what conservatives’ and Republicans’ true core definition of “family values” is, after the Reagan and Newt Gingrich years. After much study and earnest searching, I think I’m getting closer to what Republicans’ fundamental meaning of “family values” is:
https://www.politico.com/news/2020/08/07/falwell-indefinite-leave-liberty-university-392607
https://www.wsls.com/news/local/2020/08/07/gop-lawmaker-former-liberty-university-instructor-calls-for-jerry-falwell-jr-to-resign/
My favorite part is Falwell Junior’s explanation in the last paragraph of the WSLS story where they quote Falwell Junior’s radio interview on WLNI near Lynchburg Virginia:
“Yeah, it was weird. She’s pregnant. She couldn’t get her pants zipped and I was like trying to like… I had on a pair of jeans I haven’t worn in a long time and couldn’t get zipped either. So, I just put my belly out like hers. She’s my wife’s assistant she’s a sweetheart. I should have never put it up and embarrassed her. I’ve apologized to everybody. I promised my kids I will try to be a good boy from here on out.”
Oh, bless that poor Fundamentalist Christian man’s heart. She’s his wife’s assistant. There’s nothing bad going on here. This poor, dear man. Bless his Fundamentalist Christian heart. Next stop for Falwell Junior, White House liaison to southern Evangelicals and Stormfront???
He should not be embarrassed to take a picture with the mother of his unborn child. The beer was just a prop. Its really bourbon.
Lots of people get sauced on bourbon and choose not to embarrass their wife and children on a public platform. Nevermind those enrolled at his Jesus Freak Community College Home for Wayward Losers. Let’s not blame this on bourbon, the man had a 53′ trailer’s worth of stupid before he took a single sip of alcohol. Was he sauced on the radio interview also?? Kudlow is generally sober now, does it seemed like soberness is helping a lot there??
*seem
I thought of both Jerry Falwell and Jerry Falwell Junior, along with many other TV evangelists while reading this, Matthew 15 :8-9:
“These people draw near to Me with their mouth,
And honor Me with their lips,
But their heart is far from Me.
9 And in vain they worship Me,
Teaching as doctrines the commandments of men. ”
Joel Osteen. The list is endless.
https://www.theguardian.com/commentisfree/2017/aug/30/houston-megachurch-shut-out-flood-victims-twitter-storm
” ‘It is easier for a camel to go through the eye of a needle, than for a flood victim to enter into Joel Osteen’s church,’ tweeted one critic. ”
I am constantly reminded of the ending that came to John the Baptist, among many of Christ’s more fervent believers, when Joel Osteen goes on TV and tells people life is going to be a big gigantic bowl of cherries, and just a big frat party, all you have to do is purchase Osteen’s next book and “believe” (“believe” in what I don’t know, because Osteen has nothing to do with Christ). The truth is, guys like Osteen are a prime example, of why absolutely nothing is surprising about white trash America’s obsession with MAGA dreams.
it just struck me that the “business cycle indicators” that you’ve posted here don’t include personal services, except through the proxy of employment…that’s a big omission, especially in today’s context…PCE services usually accounts for ~47% of GDP, and Covid-19 is a personal services recession…
this might be the case where none of the usual indicators tell us much, Menzie…
rjs: Agree that this recession is different. That’s why I included services consumption (as did Jim) in my GDP post. But I’ll add.
2 minutes and 40 seconds. No vulgarity:
https://www.youtube.com/watch?v=H5h1pskjhtM
The arguments are very obvious, but they need to be stated and designate who they hurt.
https://www.npr.org/sections/health-shots/2020/08/06/900000671/300-000-deaths-by-december-9-takeaways-of-the-newest-covid-19-projections
“By Dec. 1, the U.S. death toll from COVID-19 could reach nearly 300,000. That’s the grim new projection from researchers at the University of Washington’s Institute for Health Metrics and Evaluation — one of the more prominent teams modeling the pandemic. The new forecast, released Thursday, projects that between now and December, 137,000 people will die on top of the roughly 160,000 who have died so far.”
Wait – I thought Trump said we would have only 1 death. OK – 50 thousand deaths. And we the death count past 120 thousand Trump sycophants started telling us that was it for the death count.
300 thousand by December 1? “It is what it is” is the new mantra now.
PGL, that estimate seems a little high. Using you numbers the monthly average March through July was ~32,000/month. The 137K estimate averages to ~34.5K/month while the death rate has been going down. https://www.motherjones.com/wp-content/uploads/2020/08/blog_covid19_case_vs_death_august_7.gif
Your reference is an analysis of 26 models with this comment:
“9. Not all forecasts are as pessimistic as IHME’s
Nicholas Reich is a biostatistician at University of Massachusetts Amherst who has set up a system for making apples to apples comparison between 26 different national U.S. coronavirus forecasts. He notes that most of them are shorter-term forecasts — with only a handful projecting months ahead the way IHME’s team does. Among these, IHME’s predicted death total is the highest. For instance, researchers at Iowa State University are forecasting 236,000 deaths by Nov. 29 — 55,000 fewer deaths than IHME’s forecast for that date.”
CoRev: IHME highest? Middle of the pack for 538 https://projects.fivethirtyeight.com/covid-forecasts/?cid=rrpromo
What’s that have to do with my comment re: PGL’s reference and the time frame it covers? If you disagree with the quote take it up with the author.
Hey CoRev – go READ Menzie’s new post on this topic. Death count per day has started trending back up.
CoRev If you compare historical forecasts with actual deaths you’ll see that the IMHE forecasts tend to (slightly) understate actual deaths. You can easily do that by comparing each week’s forecast against actual deaths.
By necessity all long range forecasts have to incorporate some intervention assumptions. One of the models included in the fivethirtyeight site is the COVID-19 Simulator, which can be found here:
https://analytics-tools.shinyapps.io/covid19simulator06/
I like it because it allows you to impose different intervention regimes and then specify how long each intervention regime will be in place. But wait…there’s more! It does more than just project deaths, it also projects the number of infections, the number of active cases at any point in time, the projected number of hospital admissions and the number of people in ICUs. You can drill down to the state level. In other words, it doesn’t just make unconditional forecasts, it allows the user to make conditional forecasts, and those are a lot more useful. The only downside with the simulator is that it’s very data intensive and data isn’t always refreshed as often as you’d like.
2slugs, also not relevant to my comment.
Yea it was. But then you pull this garbage every time someone calls you on your BS.
The white house estimated we would have less than 60,000 deaths in total. Pretty poor prediction by the trump administration.
CoRev links to a chart Kevin Drum posted on August7 but he failed to note what Kevin wrote:
https://www.motherjones.com/kevin-drum/2020/08/when-will-covid-19-deaths-start-to-decline/
During the first round of COVID-19, the death rate started to decline about two weeks after the case rate began falling. If the same thing happens this time around, deaths have already peaked and will start to decline in about a week or so. I’m not saying this is what will happen. There have been too many surprises already in the COVID-19 numbers, and the actual death rate will depend a lot on how seriously everyone is taking the recommended countermeasures (masks, social distancing, etc.). I can’t predict that—and neither can anyone else—which means I can’t predict the death rate trend either. Still, if the second round of COVID-19 is like the first round, late July would have been a decent baseline guess for peak deaths—which turned out to be the case—and mid-August is our best guess for the start of the decline.
If one actually looks at Kevin’s chart, the case rate went back up and the death count went up with a lag. So when CoRev says the death count has been falling, he is either lying or proving he is Mr. Magoo. Kevin’s hope that we can get the death count down depends on people wearing masks and doing social distancing. Alas Trump sycophants like CoRev are telling people to ignore these sensible recommendations.
PGL, also an irrelevant comment. Furthermore within all your references the ends of the Covid death trend lines are going downward, but you continue to hope MORE PEOPLE DIE?
CoRev you continue to hope MORE PEOPLE DIE
If that were true, then we should keep silent about Trump’s handling of the pandemic. Let Trump be Trump and deaths will increase. The reason we’re waving the bloody shirt is because we don’t want people to die. You’re the one who supports Trump’s death march over the cliff, so I can only conclude that you’re the one who wants more people to die. Except that you just want those deaths concentrated among non-whites.
CoRev:
NOONE is hoping that more people die. Your ideology has truly poisoned your mind.
They are simply looking at the entirety of the dataset, which includes the history of the virus/disease (including the exponential growth and the typical time lags between cases, disease onsets, and deaths) and correlation with adoption of public health measures. They’re describing the most likely course of the pandemic in the U.S. over the next few weeks. In other words, they are engaged in data analysis, not confirmation of biases.
Furthermore, in refutation of your protests, everyone’s comments are directly relevant to your first sentence, to wit: “PGL, that estimate seems a little high.”
My God, you have had many opportunities to learn about data analysis on this blog, not to mention economics and statistics, and you have refused to take advantage of every one of them. Your belligerent ignorance is your fault, and yours alone.
CoRev You are misunderstanding Kevin Drum’s chart. The point that he has been making all along is that initially there was a spike in deaths, then death per million started a slow decline similar to what we saw with other European countries. And now the death rate per million has started to trend up. We were down to around 2 per million and now we’re around 3 per million.
You also said this: researchers at Iowa State University are forecasting 236,000 deaths by Nov. 29 — 55,000 fewer deaths than IHME’s forecast for that date
I think my point about the difference between conditional and unconditional forecasts is quite relevant. Each of those models is working under one or more assumptions regarding intervention regimes. Most of those models don’t just offer a single projection. If you can be bothered to compare the Iowa State forecasts with actual forecasts you will see that Iowa State has consistently underforecasted actual deaths. It’s Iowa State that is the outlier, not IHME.
2slugs, of course you think your comment is relevant, but it doesn’t address my points, 1) Death rates are trending down, and 2) They are not for the same period.
Yes, modelling usually must use assumptions for dirty data. So????
As for estimates, here’s the Worldometer estimate for the same period of US deaths: https://covid19.healthdata.org/united-states-of-america Notice that they range from +250 to +500K depending on their conditionals. Again, so????
CoRev Death rates are trending down,
Since when do you know how to estimate a trend? Not only can you not do the statistics, you can’t even understand the data visually. The very MotherJones chart that you linked to shows that the trend is increasing. There’s an inflection point in early July. Just a very simply deterministic trend (i.e., the kind that even you could do in Excel) and daily periodic dummies shows a positive trend from 1 July through 9 August. The R-sq is 0.855 and the trend variable is significant to 8 standard deviations. The only downward trend is from 1 May through 30 June.
modelling usually must use assumptions for dirty data
You don’t get it. It’s not about regime interventions being used to account for dirty data. Interventions are how you model the effects of policy changes. Didn’t you learn anything during your enforced absence?
2slugs, there you go again with the statistics versus logic. The Mother Jones chart showed that cases peaked in the mid-July time frame. In all instances when reporting has been reasonably quick/good peak deaths have lagged cases by approximately 2 weeks. Unless there are sudden differences in data reporting going on, the death/day inflection point would be around August 1. Drum’s chart shows the start of such an inflection.
But we’ve had another 8-9 days of data since, and that deflection appears to have been confirmed. I refer you to the Daily Cases & Deaths chart from: https://coronavirusbellcurve.com/ We both understand that the newest data is most prone to revision, so time will tell.
I also understand that trends are sensitive to start and end dates. Your selected dates do not match the LOGICAL inflection dates. If you’ve graphed the 1 July through 9 August data tell us the slope since early August. As the data is revised we can see if that slope continues.
CoRev: “deflection”?
Menzie, made a mistake typing.
CoRev The Mother Jones chart showed that cases peaked in the mid-July time frame.
Huh? Take another look at the chart. It shows a TROUGH at in early July. Are you blind?
quick/good peak deaths have lagged cases by approximately 2 weeks.
I’m not talking about confirmed cases. I’m talking about daily deaths.
A summary of how well the HCQ_+Zpac+Zinc and how the TDS sufferers may have affected US deaths: https://www.washingtontimes.com/news/2020/aug/7/how-trump-derangement-syndrome-is-literally-killin/?fbclid=IwAR18YZ3BTPZ_8VDJYpYq1tJfOl5ef694lQh3OYbvuu3bOyuxi7rsdv4-iuM and don’t forget this study: https://hcqtrial.com/ IIRC ~60% of the HCQ studies have shown positive results.
We still have months before the bulk of the voting takes place. Are you so sure that you are correct? Are you really willing to take the blame if you are wrong?
It is what it is.
– covid donnie
Kudlow fessed up that he gets his economic tutoring from casey mulligan. Mulligan is a turd wrapped up in this slices of bull sh!t. He is the prime example of why economists get a bad rap today. Kudlow goes on air and misquotes a study he did not even take the time to read. Poppy harlow made jim look like the old pathetic crank he really is.
Remember Robert Novak – the Cheney clown that outed Valerie Plame? He used to go onto the TV shows lecturing everyone else how he knew economics and they didn’t. And of course his only class in economics was reading Kudlow’s National Review nonsense. The blind leading the blind.
https://www.eenews.net/stories/1063621509#:~:text=In%20his%20forthcoming%20book%2C%20%22You%27re%20Hired%3A%20Untold%20Successes,for%20Trump%20and%20is%20light%20on%20his%20failures.
President Trump’s former Chief Economist Casey Mulligan blames some Republicans, including Transportation Secretary Elaine Chao, for hindering the president’s deregulatory agenda by catering to the shipbuilding lobby.
In his forthcoming book, “You’re Hired: Untold Successes and Failures of a Populist President,” Mulligan offers a behind-the-scenes perspective from his year in the White House from 2018 to 2019. The book is saturated with adulation for Trump and is light on his failures.
A University of Chicago economics professor, Mulligan has long promoted conservative attitudes toward regulations and the role of government. He once opposed sick leave because he said it encouraged people to needlessly take time off.
In his sixth book, Mulligan boils down wonky regulatory issues, including some energy and environmental rules, and also appears to enjoy writing about Fox News and Twitter.
To the extent Mulligan does discuss Trump “failures,” he directs his criticism toward the politics at play, blaming conservatives with protectionist ideologies on regulatory issues, including the Jones Act.
An age-old shipping law intended to promote U.S. vessels hauling natural gas, the Jones Act has actually benefited international shippers and hurt American consumers, Mulligan argues.
The act requires that all domestic shipping occur on vessels built and crewed in the U.S. But since all ships currently equipped to carry natural gas have not been built in the U.S., the regulation effectively bans shipments of natural gas from, for instance, Georgia to Massachusetts.
This upends transportation logistics, he writes, and creates routes that are akin to “Russian bootlegging.”
“President Trump hates the Jones Act,” he says, adding it’s one of the few “harmful” regulations he does not overturn.
The issue has pitted the shipbuilding lobby against free-market conservatives, like Mulligan. He claimed that Transportation Secretary Chao and her husband, Senate Majority Leader Mitch McConnell (R-Ky.), received millions in a gift from her family, shipbuilders who own the Foremost Group, which benefits from the Jones Act.
Mulligan says Trump resisted pleas from Chao and his trade adviser Peter Navarro, known to be a protectionist advocate, and instead held a White House meeting.
He does not name the lawmakers, but as E&E News reported at the time, they included Republican Sens. Dan Sullivan and Lisa Murkowski of Alaska, John Kennedy and Bill Cassidy of Louisiana, and Roger Wicker and Cindy Hyde-Smith of Mississippi, along with Rep. Steve Scalise of Louisiana
He believed “President Trump was taken aback by their willingness to spend political capital to perpetuate such a broken system. He decided, for the time being, not to pick a fight with them.”
In other words, the shipping lobby won.
“The reality is that regulations protect special interests, of which environmental groups are just a small fraction,” Mulligan writes.
After the White House meeting, Chao was named the inaugural “American Maritime Hero” by a lobby firm that states its purpose is to defend the law.
A Transportation Department spokesperson refuted Mulligan’s narrative, saying “there is no evidence backing these baseless claims.”
“When some of these anti-Jones Act advocates claim it’s about principle, it’s actually about money, paying clients, and trying to sell books,” the spokesperson wrote in an email.
McConnell’s office did not respond to a request for comment.
[This story continues with Mulligan going off on Obama ending with how Trump loves to listen to Lou Dobbs (who is even more insane than Mulligan]
https://www.cnbc.com/2020/08/08/feds-kashkari-advocates-six-week-economic-lockdown-to-defeat-the-coronavirus.html
“If we do this aggressively, the testing and tracing capacity we’ve built will support reopening the economy as other countries have done, allow children to go back to school and citizens to vote in person in November. All of this will lead to a stronger, faster economic recovery, moving people from unemployment to work,” they said.
finally somebody at the bank steps up and says what needs to be said. if we don’t get the trump virus under control, all the sacrifices that were made during the too short march lockdown will be for naught. wasted. the summer is now gone. we should have shut down over the summer so that we could return to schools in the fall. now most schools are going virtual. this is hindering an economic return. we could have bounced back economically much more quickly if we took seriously the efforts to contain the virus. this is not rocket science folks. the sooner we do what must be done, the sooner we have a return to our normal lives.
Does anyone else think it’s interesting, that Lee Stranahan, a man who used to work for Breitbart News and Daily Kos (which I guess is one of Barkley Junior’s favorite websites), now works for Rossiya Segodnya spreading Russian propaganda on American radio airwaves??
I have never even heard of Lee Strasnahan, but if he was forecasting that GDP would follow an “L” pattern, Moses, then he is your kind of guy, not mine.
@ Barkley Junior
I never forecast an “L” pattern. Saying something looks like an L-shaped recession, rather than a V-shaped recession, is not forecasting an L-shaped recovery. (The graph referred to in that archived comment Menzie linked back to was not the current recession.) Even with you trying to restate other people’s arguments, and Menzie’s attempt at equivalating your horrendously bad 2nd Quarter SAAR GDP prediction with my saying an extended recession would more closely resemble an L-shaped recovery than a V-shaped recovery, you’re going to play hell finding anywhere on this blog I predicted an L recovery. I never predicted any of these, I only predicted the 2020 2nd Quarter SAAR GDP number—for ONE very simple reason–it is the ONLY thing of those two I felt confidence enough to predict.
However, some extended time ago, probably around back in late April, I DID say that anyone predicting a V-recovery was an idiot jacka$$ (or words to that effect). While I may regret calling someone an idiot jackass, I don’t regret the sentiment on that statement.
Yes, Moses, we got it that you never did make a clear forecast of the shape of the GDP pattern, although that statement Menzie pulled up certainly looked like you were leaning to forecasting an “L” pattern. You are now claiming that you were referring to some past recession, although as I noted at the time that no past recession has looked like an “L” so if you were doing so, you were wrong. Care to apologize for your horrendous error on that?
I never made an SAAR forecast for the official BEA quarterly nuumber, although you kept demanding that I do so. You were pretty close on yours, as I have congratulated you on. My only statement on the official BEA number was that I would be surprised if it was worse than -30% measured not by SAAR but quarter to quarter, which would have equivalent to worse than a -107% annualized rate, which did not happen, so I was not surprised. You simply have no claim at all about me making a “horrendously bad” second quarterly prediction, although Idid accurately forecast that you would go on and on and on and on as you have about whatever I did say, trying to claim, falsely as a matter of fact, that I made a bad prediction.
I did make an error, now admitted and apologized for here numerous times, in at an earlier time thinking quarterly changes were measured by looking at end of one quarter and then looking at end of next quarter, when in fact, as has also been noted here many times, the official BEA number reflects average of one quarter compared to another. When I suggested we might see positive GDP growth in the second quarter I was using the earlier erroneous definition, and indeed according to that measure there was positive GDP growth, of 9% on an annualized rate, something I have not seen you admit. I leave it to anybody still wasting time reading this to judge whether this earlier mistake later admitted and corrected is “horrendous” or not;
In the meantime, Moses, while you are now claiming you never made a forecast about the shape of the GDP pattern, you have spent enormous amounts of space here ridiculing the V vorecast. You have continued to mock it, presenting it as yet more evidence of how horrendous my remarks are here, even as every single person who has chosen to comment on it agrees with me that the darned thing sure looks like a V. When are you going to admit that you have been horrendously wrong about this matter and apologize for all you unjustified insults connected to your false claim?
Oh, I must admit that you have here apologized for “calling someone an idiot jackiass,” while also you “don’t regret the sentiment on that statement”? Why not, given that your claims about the V pattern (essentially a forecast it would not be a V, even if you never hung your hat on any other particular pattern), has proven to be screamingly and obviously wrong? Indeed, you still avoid admitting you were and are just horrendously wrong on this, to use a word you have been throwing around without a shred of justification.
Ooops! The amount of second quarter to quarter decline measured quarterly I said I would be surprised at seeing worse than was -20%, not n-30%. It is -20% that generates an annualized -107% rate.
Barkley Rosser I believe a 20% quarterly drop results in a 59% annualized drop.
1 – (1 – .20)^4 = 1 – 0.41 = 0.59
If you remove 20% of GDP growth in the first quarter, then you begin the second quarter with a smaller economy, so another 20% drop from that lower level doesn’t have quite the same punch when measured in levels. And so on with the third and fourth quarters.
That’s why the BEA shows 2020Q2 as a 32.9% SAAR drop based on a 9.5% quarterly drop.
1 – (1 – 0.095)^4 = 1 – 0.671 = .329
I think that you might have been taking 1 – (1.20)^4 = 1 – 2.07 = 107% drop
The details about bunker boy’s executive orders to solve the Senatorial intestinal blockage over continued relief are leaking out now. It appears to be a failure looking for a place to happen. And the leg of the V will flatten in the next few weeks.