There’s been some debate over how low GDP is relative to peak. One has to be particularly careful in calculations because the monthly peak is different than the quarterly peak, according to the NBER BCDC.
For instance, monthly GDP (unofficial, from IHS-Markit) peaks in February 2020, but quarterly GDP (official, from BEA, 2nd release) peaks in 2019Q4. It happens that these dates coincide with NBER defined peaks; they don’t have to as NBER uses more indicators in addition to GDP to determine the business cycle chronology.
Taking into account these peaks, what is GDP “now” relative to “peak”?
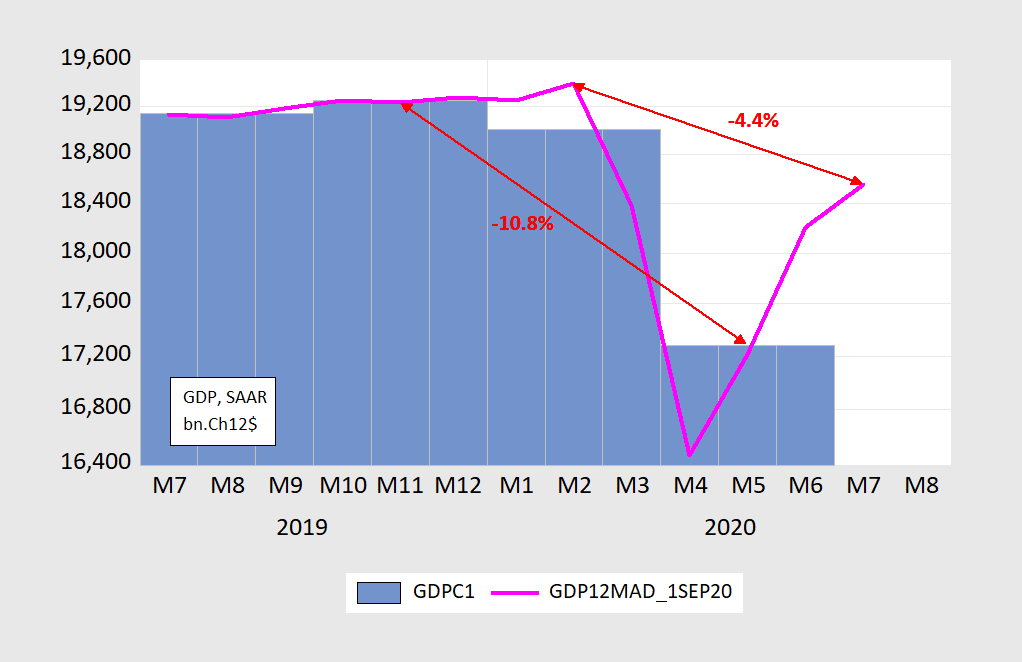
Figure 1: Official Quarterly GDP (blue bar), IHS-Markit monthly GDP (pink line), in billions Ch.2012$, SAAR. Source: BEA, 2020Q2 2nd release, IHS-Markit release of September 1.
More on y/y, q/q, annual growth rates in this post.
Just eyeballing the chart, the June level was about 6% higher than the Q2 average (not annualized) – a super-strong base from which to start Q3. Growth slowed in July, but the strength of the quarter-end base put July up about 7% from the Q2 average. An extreme example of what goes into the calculation every quarter. The opposite effect was seen a quarter earlier, when the March plunge killed Q2.
This is a great teaching example.