Why do reported growth rates differ for the same variable? Refer to the last three years of GDP data to see… [this is an updated version of this 2018 post]
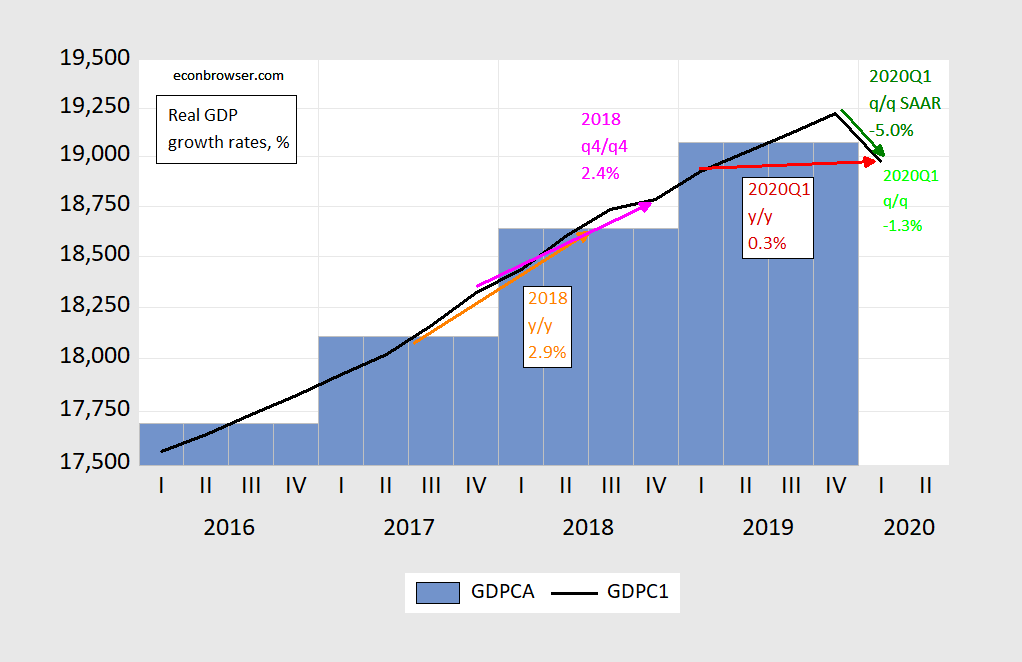
Figure 1: Quarterly GDP, SAAR, FRED series GDPC1 (black line), annual, FRED series GDPCA (blue bars), in billions of Chained 2012$. 2018 annual (quarterly) growth rate (pink arrow); annual 2018 y/y growth rate (orange arrow); 2020Q1 annual quarterly growth rate (red arrow); 2020Q1 q/q SAAR growth rate (green arrow). Source: BEA, 2020Q1 3rd release via FRED, and author’s calculations.
Note: SAAR denotes Seasonally Adjusted at Annual Rates.
Conventions in the US are to cite q/q SAAR or y/y quarterly data (i.e., 4 quarter changes). In Europe, q/q growth rates are typically not annualized.
So, there are several ways to calculate the growth rate over the course of the year. They will almost invariably differ, perhaps substantially, when GDP is either growing very rapidly or shrinking very rapidly. And there is no “right” way. If one wants to calculate the most recent growth experience, one might stress q/q. If one wants to look at a longer horizon, then one might want to use the quarterly y/y. If one thinks quarterly series are very noisy, one might want to look at annual y/y.
Additional Note: One could average the q/q annualized growth rates over the four quarters of 2017 to try to get 2017 q4/q4 growth rate. This calculation leads to an approximation, which gets worse the more variable growth rates are (unless growth rates are calculated as log-differences — which is part of the reason economists like to express variables in logs and log differences…).
By the way, 10% decline combined with a 10% rise does not bring you back where you started — unless you calculate growth rates in logs. Here’s Jim Hamilton‘s take (for some reason, people start calling me names when I try to defend the use of logs.)
I’m gonna say this as nicely as I know how. If you are an American economist and you quote GDP numbers, the assumption (without having stated otherwise) is going to be you are talking about SAAR numbers (the gold standard on that, or the most common measuring stick being BEA, and I don’t always agree with the BEA GDP number to the decimal point, but it is nonetheless the measuring stick). Especially if the numbers that economist is criticizing as being too low ARE SAAR numbers. You don’t criticize the quality of a specific batch of oranges by disucussing the taste of random batch of apples. You take another batch of oranges to compare to that batch of oranges. Now that is an analogy written for learning disabled children, but that is apparently where we are now.
Some economists (at least back in the old days when one could make jokes without upsetting someone) like to use pretzels and beer for examples. Now if I say “This 6 pack of Budweiser beer is especially bad compared to other batches of Budweiser beer. They don’t use enough hops in it” I DO NOT argue/explain “You know how I can tell this batch of Budweiser beer is bad and doesn’t have enough hops compared to other batches of Budweiser beer?? Taste this bottle of Beringer’s wine and you’ll know why”. NO. Nobody does that.
If you are an American economist and you quote GDP numbers, the assumption (without having stated otherwise) is going to be you are talking about SAAR numbers
I don’t think that’s true. If you’re quoting GDP growth rates, then it’s generally understood that you’re talking about SAAR; but if you’re talking about GDP levels, then you’re probably talking about the annual value.
2slugbaits: Although, to be entirely confusing, quarterly levels of GDP are typically reported by BEA as “seasonally adjusted at annual rates”, which can mean at the annual value. I.e., 2020Q1 nominal GDP is reported at $18,977.4, which is what GDP would be if that pace were kept up for the entire year…(alternatively, actual nominal GDP in 2020Q1 was $18,977.4/4 = $4744.35.
True, but when someone is comparing GDP levels (plural) they usually compare across years. As a practical matter the only time someone would use the quarterly GDP level is when they are talking about the current level of GDP and you want to use the most current estimate.
That reminds me, I believe you once wrote a paper that found the frequency (quarterly or annual) affected stationarity.
@ 2slugbaits
I think your parsing of what I said (no derogatory meaning in my usage of parsing) is correct and worth saying. So, I stand corrected.
However, if I can be allowed this personal amusement, I’ll let you and “the general reader” decide whether that economist (using the term in a generous way) I am referring to, was referring to levels or growth rates.
Menzie,
Only you yanks talk about annualised rubbish, the rest of the world talk about annual rates. I put it down to your poor education system.
Annualised rates simply make the changes more striking and are next to useless in understanding where the economy is.
do you annualise any other numbers bar GDP? If not why not.
If you annualsied monthly CPI numbers ( oh how I wish we had monthly CPI numbers) you would have no idea of what was happening to inflation!
Not Trampis: If you look at the second to last page of the Economist, you’ll see a column of last quarter growth figures…they’re annualized. Take it up with them.
I don’t know if it’s the better part of my German blood bubbling up to the surface, but I actually find these conversations on the “exacting” processes and descriptions of measurement to be highly entertaining. It’s like reading Leviticus or some sections of the Talmud. It’s like popping bubble wrap or something, it feels so “satisfying”. Or maybe the same feeling someone who’s sharper than me gets when they make both sides of a difficult equation to cancel out to an answer or something.
Not Trampis: We do annualize inflation rates. Interest rates are quoted in annual rates too…
“Annualised rates simply make the changes more striking and are next to useless in understanding where the economy is.”
Provincial much?
Maybe you find annualized rates hard to comprehend, but those of us who are accustomed to annualized data have no serious problem understanding what an annualized figure means. If GDP (or CPI or disposable income or profits….) rose 3% one year and rose at a 3.5% annualized pace in the first quarter of the next year, we can easily see that growth has accelerated relative to last year’s average. If, instead, quarterly growth is reported at a 0.86% pace, we connote immediately tell whether that is faster or slower than last year’s pace. But, then, knowing how the latest quarter compares with last year does not help understand the economy.
Comparisons between numbers are easier to understand if one has seen the comparison before. Regular readers of U.S. data have seen annualized rates of growth often and know how to think about them. You have been reading here long enough that you, too, have had time to make sense of the was we report our data. Perhaps willful ignorance is preventing understanding.
Of all the issues one can worry over in economics, annualization is yours?
“…(for some reason, people start calling me names when I defend the use of logs.)”
Lumber lover. Wood worshiper. Maple sucker. Oak ogler.
Menzie,
I do not read the Economist but do read Statistical releases. Can you tell me of any other country that uses them?
We have one of the best down under and we most certainly do not.
I do admit to remembering hearing how useless annualised figures were in I think my introduction to econometrics class. I have yet to hear from anyone on their uselfulness.
Copy/pasted from BLS’s FAQ:
When should I use seasonally adjusted data?
“By using seasonally adjusted data, some users find it easier to see the underlying trend in short-term price changes. It is often difficult to tell from raw (unadjusted) statistics whether developments between any 2 months reflect changing economic conditions or only normal seasonal patterns. Therefore, many economic time series, including the CPI, are adjusted to remove the effect of seasonal influences—those which occur at the same time and in about the same magnitude every year. Among these influences are price movements resulting from changing weather conditions, production cycles, changeovers of models, and holidays.”
I don’t think the issue here is whether or not we should use seasonally adjusted data. As I’m reading this thread the issue is about different ways to express data that is captured at quarterly frequencies and how that data is expressed at an annualized rate. In general you would want to use seasonally adjusted data; however, there are times when it’s appropriate to use non-seasonally adjusted data and then incorporate any seasonal adjustments as part of your analysis.
@ 2slugbaits
I think “Not Trampis” may possibly disagree with you. I was posting that for the edification of “Not Trampis” on why people would use that. I guess I should have “tagged” his user name in the comment but I thought it would be obvious who it was intended for.
I aid nothing about seasonally adjusted figures. Why should I.
It is using anuaised date V annual date the disagreement is about
@ Not Trampis
My apologies.
okay let me give a concrete example.
Way back in Obama’s term a person was arguing that the growth was over 3% and hence above trend and the budget should be in surplus.
I examined the figures and found out the annual rate was 2.6% and it was completely absurd therefore for the budget to be in surplus.
He did not understand the difference between annualised and annual figures.
A government would be examining the annual figures not annualised when discussing what to do with their structural part of the budget.
In CPI I only look at the Trimmed mean and weighted median which are in annual terms otherwise you would go bonkers each month.
your education system has a lot to answer to
What a hoot! “…I only look at…” and “your education system has a lot to answer to” in the same comment.
To paraphrase: I can only handle a limited amount of information, but it’s you who are poorly educated.
Provincial much?
And while we’re on the subject of education in the U.S., I think you are confused. Universities do most of the high level instruction in economics, and the U.S. university system has been the envy of the world at least until recently. The problem in U.S. education as at the primary and secondary level. Are you arguing that a bunch of grade school children stormed U.S. statistical agencies and took demand that data be presented in annualized form? Cause I’m starting to think, based on your arguments here, that the U.S. is not the only place where basic education is wanting.
I think he’s considering renaming his blog “Tribalism, Why It’s Been Unfairly Disparaged and How We Can Revive It”. I’m gonna have to recheck my sources on that. One thing you do have to respect though, the Australia of the year 2020 is not the type of country to get caught with its dance down:
https://www.theguardian.com/australia-news/2020/jun/19/australia-cyber-attack-attacks-hack-state-based-actor-says-australian-prime-minister-scott-morrison
Transparency is nice too “Uuuuuuhh, important government agencies have been attacked, people’s data has been stolen, and uuuuuuhh, we’ll tell you which agencies and which people and what data……… sometime later. By the way, I’m NOT donald trump. Goodnight Everybody!!!!”
*pance down Damn, maybe we need to look into American proofreading. Or is it me? It couldn’t just be my problem, could it??
pants, I’m gonna get it here sometime folks. remedial spelling possibly
silly me and I thought universities were part of the education system. They are in every oyther country
As to your other alleged beauty of annualised rates. No one quarter does not tell you that. you could annualise two quarters to get a better idea of whether the economy is slowing or growing but not one quarter.
how about a monthly CPI Are you seriously suggesting a month;s figure annualsied tells you anything at all?
Not Trampis: If you had an econometrics class, you would be more circumspect about what information was contained in monthly vs. quarterly vs. annual data. In point of fact, Dr. Hamilton’s Markov Switching model for determining recession dates, oft-cited on this blog, is calculated…in quarterly data.
Personally, I’m not tied to any horizon as being “right”. I use 5 year averages in my studies of medium term current account balances (Chinn-Prasad, JIE, 2001; 1146 google citations), but I’ve had serious applied econometricians take me to task for using averages instead of annual data, since averaging loses information.
Menzie,
you have completely missed my point.
If you go back to my example which one was correct about the state of the economy under Obama then.
Annualising data whether it is monthly or quarterly can give you a completely misleading picture.
Let us say the quartlerly GDP figures for two quarters were 1% and then 0,5%. That is a quite large change in the annualised growth rates.
Macroduck for example could well tightening and then loosening fiscal policy!
Not Trampis: I don’t know with whom you were debating, but in my one-year-plus in US government employment (including Executive Office of the President), I never encountered the confusion you mention with any of my interlocuters.
@ Menzie
I was thinking of my own mistake just now, in quoting the BLS explanation of “Why use seasonally adjusted data??” when Not Trampis’s complaint was on annualized data. Which was a bad error on my part and I didn’t intend to muddy the waters. But I am wondering, could the deal here be that Not Trampis is assuming that economic experts, CEA, CBO, FOMC etc are making decisions solely on these “official” quoted figures, what I think are sometimes called “Headline” economic figures, when often policymakers are not only using the “official” quoted numbers, that even experts are “reading in between the lines” and probably using a “mix” of different GDP measures, etc. to make their decisions.
Could this be the crux of the misunderstanding??
@ Not Trampis
I think you missed at least part of Macroduck’s point. He was conceding the point that America does have a problem with its grade schools, “K-12” if you like. In other words not coming across as “the Ugly American” or the stereotype (often largely true, as some stereotypes are) of the overly arrogant American with blinders on about the world around them. Yes, America can plead guilty on a lot of that. But Macroduck (and I would as well) is conceding America has fallen behind and comes up short in the K-12 education. But America’s university system is STILL generally admired.
There are many things Australia outdoes America at. Scenic beauty and natural beauty of the landscape is one Australia very well could lay claim to be superior to America. Possibly as yet untapped natural resources in the land. A lot of human capital and very high ability Asian immigrants are attracted to Australia. Annualized data is a little bit of a strange pet peeve to want to backstop an argument on related to America’s education problems (of which America has many disturbing and gnawing problems, but lesser so in the University system).
If you have an inferiority complex you need to vent off, I think you can find much higher ground to take America to task for, like how the hell we chose our current “President” for example. That would be the first one that rises to my mind.
At least you concede Universities are part of the education system
I’m getting a clearer picture now, but I still need you to clear something up for me. Your response that Universities are part of “the education system” suggests two things. Either you think I denied that universities are part of “the system”, which I did not, or you think universities have created the U.S. system of national data. What exactly is your point about the U.S. education system?
I am also still pretty sure that some other educational system has failed here. You have trouble extracting information from a single quarter of data, but others do not have that trouble. You seem to think that reading data that has not been annualized provides information, but the process of annualization removes that information or makes that information misleading somehow. This comprehension problem is yours, and you are a product of, what?, the Australian education system? So shouldn’t you be looking closer to home?
So, I really, really, really want to know…. Why do you think differences in data presentation is a product of education systems? And why are you blaming the U.S. system for your lack of comprehension?
macroduck I’m wondering if the problem to which Not Trampis is alluding isn’t so much the math needed to convert a quarterly rate into an annualized rate, but rather the difficulty and inherent errors associated with collecting and publishing data on a quarterly or monthly basis. For example, the BLS reports the monthly unemployment rate, but the survey actually only covers about the first half of the month. It’s not hard to see how that could introduce some bias that could be avoided with a lower frequency report. Of course, the obvious problem with lower frequency reports is that policymakers are flying blind. Even a biased one-eyed pilot is better than no pilot.
FRED gets them from World Bank, and I am assuming (but do not know) World Bank gets them from Destatis. OECD also has them:
https://www.destatis.de/EN/Press/2020/04/PE20_149_611.html
https://www.economy.com/germany/consumer-price-index-cpi
You’d be hard pressed to find another culture more neurotic about measurement than the Germans (I can think of one, but we’ll avoid that conversation). It says “seasonally and calendar adjusted”. I assume this is just another way to say annualized. It appears to be indexed to the year 2015.
What does 2020 America do to its heroes?? What does 2020 America do to people who put the needs of their country over their own interests?? What does 2020 America do to Americans who sacrifice their careers to see that America STAYS strong?? We have our answer to all those questions:
https://twitter.com/RepAdamSchiff/status/1280994079271092224/photo/1
If we keep going down this road, the great American experiment in Democracy doesn’t have a pretty ending. And where we stand right now, it’s a short road to that ending.
We have one (or two??) people on here quite, uuuuuh, testy about May consumption numbers. From my late night internet degeneracy to your personal reading joy:
https://twitter.com/LizAnnSonders/status/1280819941617340416?cxt=HHwWgIC1_fbWl8cjAAAA
Notice how high income folks’ spending is recovering more slowly vs the people who mainly worry about food and rent. Also, it’s probably safe to assume middle income is the largest group numbers wise, still not back to “pre-pandemic” levels, and most likely on a consistently downward trajectory since June 25 or before.
Mike Pence is learning from Bruce Hall!
https://www.azcentral.com/story/news/local/arizona-health/2020/07/08/pence-says-metrics-show-covid-19-improvement-state-data-doesnt-yet/5400640002/
“Pence says ‘early indications’ show COVID-19 improvements in Arizona, but state data doesn’t yet show that
Vice President Mike Pence said Wednesday that Arizona appears to be flattening the curve of COVID-19, although state numbers suggest a more troubling picture of ever-rising cases and hospitalizations.
Pence said “early indications” show improving metrics in Arizona, Florida and Texas, three states that have been hot spots for COVID-19 surges over the past several weeks.
He pointed to Arizona’s “flattening” of the percentage of positive tests and to “declining numbers” of emergency room visits as promising signs for the state. Recent data from the Arizona Department of Health Services do not yet reflect declining trends in those areas.”
In fact yesterday recorded the highest number of new cases for Arizona. It seems that Team Trump has a novel way of dealing with this pandemic. Just lie about it and pretend it is not a problem.
Supposed to be 110 today in Phoenix, maybe 117 on Sunday. Trump said when it warms up, the virus will disappear. Looks like Arizona Will be safe by this weekend.
Those temperatures will not exactly encourage people to use face coverings. Hopefully everyone stays home and gears up the AC!
How about Azar today practically scolding teachers who have concerns about how schools will provide proper instruction when and if they reopen. Mask up, socially distance, and do you job. He pointedly said health care workers take precautions and don’t get infected (other than the ones who’ve died?),so teachers should be able to do the same. Easy, peasy.
Well, sure. What works for a nurse or doctor should work equally well for a teacher instructing 15+ kids first through twelfth grades. And if we’re lucky, Azar himself will demonstrate how this can be done. I really, really would like to be there when he teaches the Jr.High special education kids and the beginning high school shop classes where students learn to identify and use tools.
Don’t forget Dr. donald also prescribes drinking 1/2 bottle of bleach. One time immediate dose should clear up the COVID~19. Deborah Birx has tried it, and she says it slightly increases the general blank look in her eyes and now she has a nervous twitch in her left shoulder that kicks in about every 7 seconds, but that it was all worth it.
Gov. Dullcey said it is ok to eat outside but not inside. MMMMM??? Eat outside at 100+ temperatures. Wonderful.
Data is messy at best. The revisions over time make perfect sense to me. As long as we all know where the raw data came from and how the various rates are calculated and what they are based upon, I don’t see any issue with slicing things up in different ways. All analysis works that way on some level.
Yes, yes, yes.
Different ways of slicing reveal different things. Looking at data in different ways helps to understand the data series in depth.
This business of “core CPI only matters for people who don’t eat or drive” and arguments over seasonal adjustment and y/y vs annualized data all look simple-minded. I have begun to wonder whether simple-minded skepticism is intended as an expression of machismo, a sort of tribalism. Can anyone actually believe that examining information from multiple perspectives leads to a loss of perspective?
I find annualized rates to be useful because they tell you the rate of change in a consistent manner. You want to know the slope of the function with a consistent denominator, not months or quarters on one hand and years on another.
If I’m driving to the store just five miles away I don’t want my speedometer to read 0.5 miles per minute. I want it to say 30 miles per hour whether I’m driving five miles or fifty miles.
What I find annoying is that financial media and even feds like the BLS are not always clear that they are reporting annualized rates. They just assume everyone knows that a 2% quarterly inflation number is an annualized rate. Why can’t they just simply say per month or per quarter or per year if that is what they mean?
And this q/q and y/y and quarterly y/y and annualized y/y is BS. Are you intentionally trying to be obscure for an insider only audience. Why can’t you use plain English and say “We’ve been driving at 30 miles per hour for the last 15 minutes.”
The point being, if economists weren’t intentionally obscure in their jargon, they might not have so many people arguing over the confusion.
This point is valid in most professions. I have worked in various disciplines. Many share the same math. None share the same terminology. It becomes a legacy issue. Old timers, who control a discipline, are not inclined to use better and more descriptive language for easier inclusion of “others” to the profession. I resist change in my own field, but also get frustrated when learning and interacting with other disciplines. Human nature I guess.
Resistance to the metric system is case in point. Construction would be so much easier using meters and centimeters and millimeters than it is using fractions of inches, inches, and feet. Just to make it worse, some earthwork and utility work is done to tenths of inches instead of eighths and quarters.
We all know what it means, but it sure would be easier to switch to a rational system that is the same from trade to trade and the rest of the world.
We don’t and I do not see it happening any time soon.
I haven’t checked the Tulsa dashboard recently, but I left the link here once and it’s not terribly hard to find if you’re curious. I would post it, but I’m exceedingly lazy and for me the general numbers are more central to my mind. The red line is the 7-day moving average, which (especially as I do not trust the OSDH quoted numbers, AT ALL) is one of the more important numbers to look at, because I trust this state’s numbers ZERO percent. There are too many numbers being quoted that are just flat out contradictory, including hospitalization numbers going down at the same time you have a 7-day exponential growth looking curve. NONE of that adds up. Neither do the death numbers, even if you account for better medical treatment now because of more knowledge.
https://twitter.com/pmonies/status/1281259502445223937
For the record, none of the sub-class intelligence Okie journalists (see I can use other descriptors for them than DUMB) are reporting the “Rt” number, after I have cajoled two of the better ones in the state just short if being a damned troll. We are now 1.19 on “Rt” in the nation, which puts us 15th worst on transmission, “behind” Wisconsin, who now have a higher transmission rate than Oklahoma at 1.27, which isn’t “impossible” but is another reason to distrust the OSDH numbers (which are what is used to calculate the “Rt” for Oklahoma).
Again, this appears to be a statewide issue, Yes, Tulsa a little more “concentrated” or “dense” with the virus, but it’s a statewide problem:
https://twitter.com/pmonies/status/1281380879345094656
Highest number since April 2 and I think many in rural areas are not being documented. Obviously I have no way of tangibly verifying that latter strong suspicion.
An update on the opinions of some economists we may be familiar with. At least two guys included on this goldstar panel seem like pretty cool guys. Yeh know, if you catch them on a good day, er something.
https://fivethirtyeight.com/features/economists-think-congress-could-create-an-economic-disaster-this-summer/