On Friday, the CBO released The Effects of Pandemic-Related Legislation on Output.
In March and April of 2020, four major federal laws were enacted to address the public health emergency and the economic distress created by the 2020 coronavirus pandemic. That legislation provides financial support to households, businesses, and state and local governments. In this report, the Congressional Budget Office estimates the legislation’s effects on economic output.
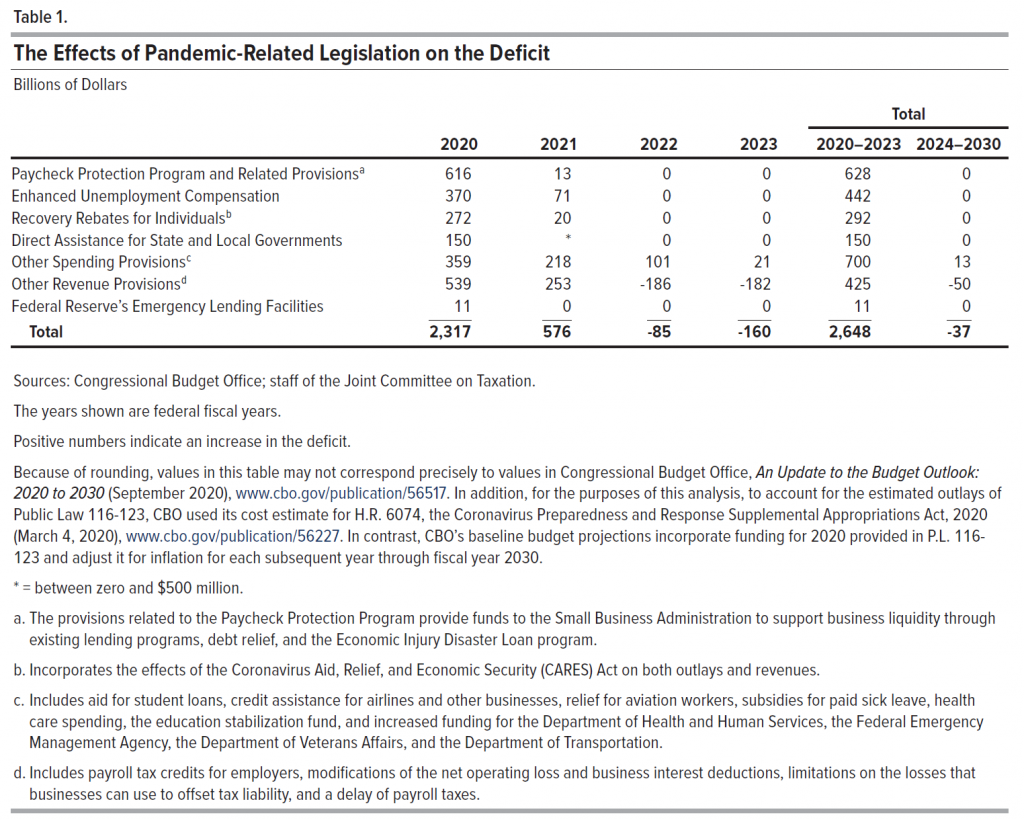
- Deficits. The legislation is projected to add $2.3 trillion to the deficit in fiscal year 2020 and $0.6 trillion in 2021.
- Short-Term Effects. CBO estimates that the legislation will increase the level of real (inflation-adjusted) gross domestic product (GDP) by 4.7 percent in 2020 and 3.1 percent in 2021. From fiscal year 2020 through 2023, for every dollar that it adds to the deficit, the legislation is projected to increase GDP by about 59 cents.
- Longer-Term Effects. By increasing debt as a percentage of GDP, the legislation is expected to raise borrowing costs, lower economic output, and reduce national income in the longer term.
- Uncertainty. The estimates in this report are subject to considerable uncertainty, especially because of factors associated with the pandemic.
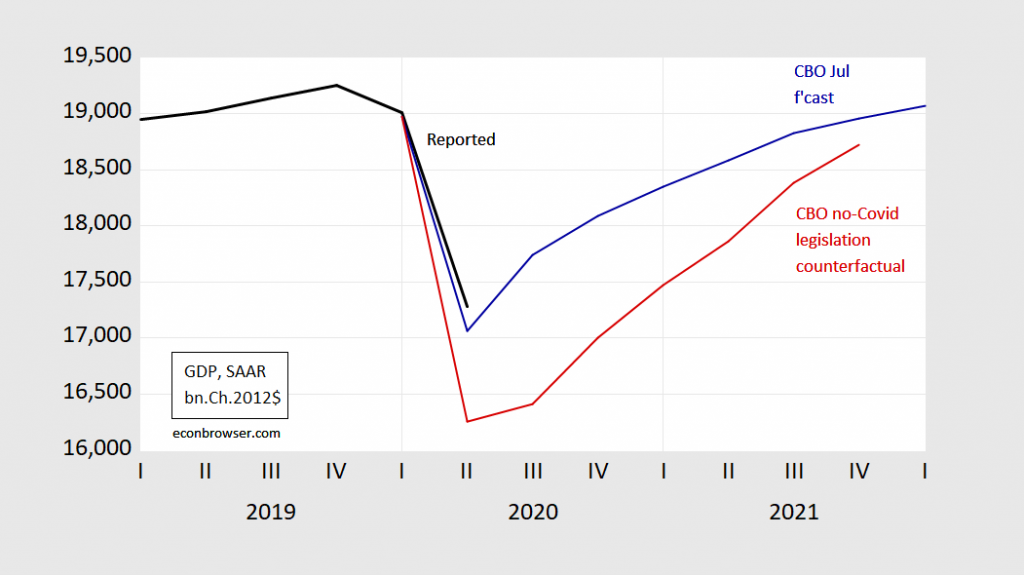
Here’s a graphical depiction of GDP’s trajectory under the counterfactual of no-Covid-19 recovery legislation:
Figure 1: GDP as reported (black bold), CBO July 2020 projection (blue), CBO counterfactual of no pandemic related recovery legislation (red), all in billions Ch.2012$, SAAR. Source: CBO, The Effects of Pandemic-Related Legislation on Output (September 18, 2020), and author’s calculations.
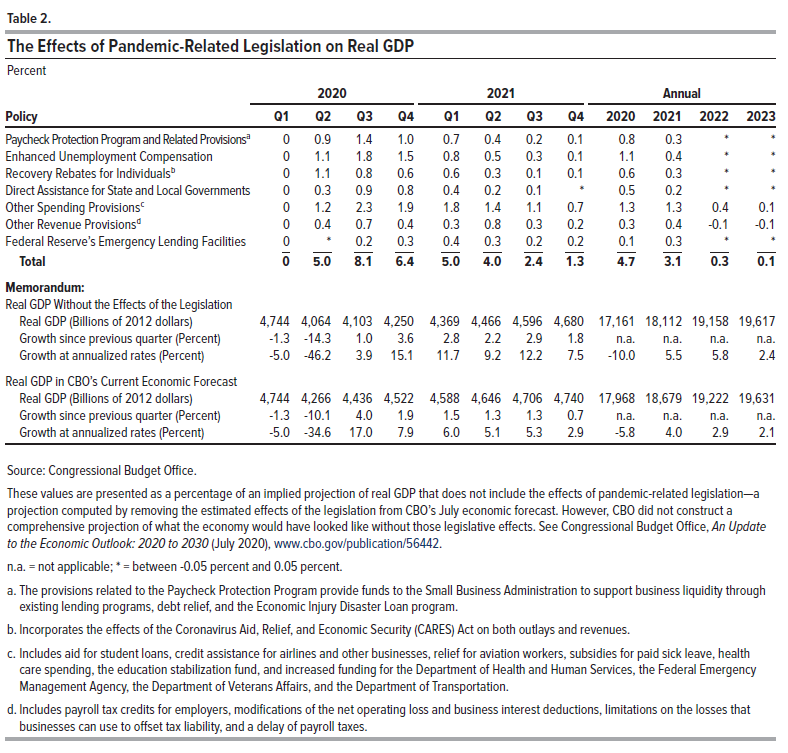
I based Figure 1 on the estimates of macro impact contained in Table 2:
Source: CBO, The Effects of Pandemic-Related Legislation on Output (September 18, 2020).
These estimated impacts in turn are based on the estimated spending levels associated with the legislation so far enacted.
Source: CBO, The Effects of Pandemic-Related Legislation on Output (September 18, 2020).
As discussed on many occasions in this blog, the multiplier associated with each of these spending provisions depends on a variety of factors (spending vs. transfers, for instance), and the overall multiplier effect in particular depends on the conduct of monetary policy (well, we know now that the Fed has committed to three years of essentially zero Fed funds rates) and whether there is slack in the economy. As noted in the report (page7):
In CBO’s assessment, the effects of changes in spending or revenues on output are larger when the economy is weak or when short-term interest rates are near zero and
are expected to remain there for several years, a situation known as being at the effective lower bound.12 At such times, the Federal Reserve would not respond, in CBO’s
view, by raising short-term interest rates to restrain the boost in overall demand. In contrast, if the increase in spending or the reduction in revenues occurred when output was at or above its potential level, the Federal Reserve would probably raise the path of short-term
interest rates to prevent inflation from rising above its long-term goal, thereby restraining the boost in overall demand and output.CBO expects the economy to operate considerably below its potential level over the next several years. The Federal Reserve is therefore expected to keep interest rates low
over that period. As a result, the legislation’s changes to federal spending and revenues—most of which are projected to occur in 2020 and 2021—will boost overall demand and output more than they would under normal economic conditions, CBO expects.
Footnote 12 contains a nice review of the literature. My treatment is here, quoting extensively from my New Palgrave Dictionary of Economics entry on multipliers.
Note that given the likely accommodative nature of monetary policy, substantial crowding out of investment seems unlikely (page 7).
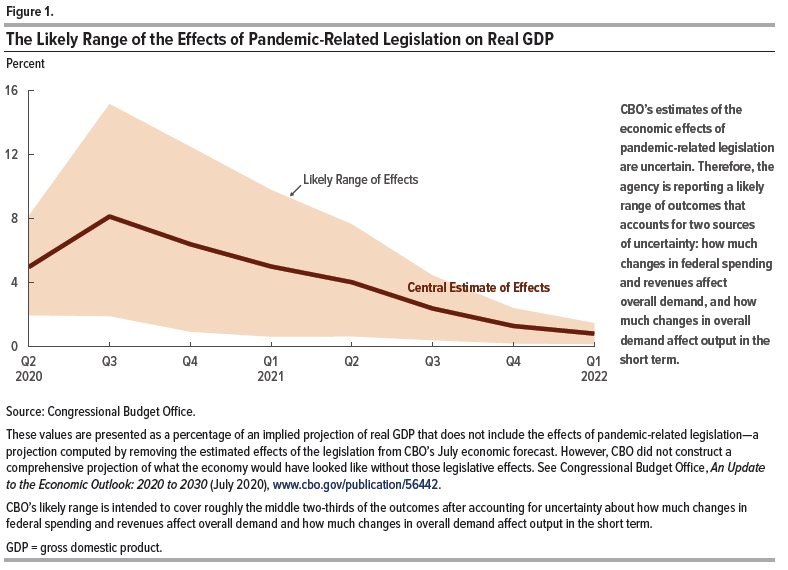
CBO highlights the uncertainty of the estimated impacts, given the unprecedented nature of current conditions (when did we last have a pandemic like this with such confused federal/state response?). This is done in the report’s Figure 1.
Source: CBO, The Effects of Pandemic-Related Legislation on Output (September 18, 2020).
Multipliers for each major category are:
- Paycheck Protection Program (PPP): 0.37
- Enhanced unemployment insurance programs: 0.68
- Recovery rebates for individuals: 0.61
- Direct aid to state & local gov’ts.: 0.89
- Other gov’t spending provisions: 0.89
- Other revenue provisions: 0.24


Can one infer that the CBO used a multiplier of 0.59 in making these estimates? (“ From fiscal year 2020 through 2023, for every dollar that it adds to the deficit, the legislation is projected to increase GDP by about 59 cents.”) Isn’t that rather low, given the range of multiplier estimates cited in your 2019 paper, and especially given high unemployment and zero interest rates?
Mb: Low end multiplier for transfer payments to individuals (a lot of the measures) is 0.4 in table I copied from a CBO working paper; as CBO notes in this report (excellent reading, I’m assigning to my macro students), as long as uncertainty is high, MPS likely higher (they don’t say “MPS”, but that’s what they mean).
Of course, if MPS is relatively high, then national saving is higher than it would have been if MPS had been low and the MPC high. To the extent that interest rates are sensitive to national saving, a high MPS means fiscal stimulus has less impact, but so does the resulting deficit. Those higher savings can always be clawed back in the future.
This stuff about higher MPS is baloney. I know for a fact a “mathematical economist” specializing in nonexistent skewed distributions from Shenandoah Valley way said that May consumption was a record number. Hahahahahaha!!!! “Got you” there didn’t I??? Consumption is killing it dude!!!! Did I mention he knows Copmala Harris’s Dad??
Moses Herzog: May consumption was a record number. It just didn’t take us back to where we started.
Hmmmmmph!!!!
BS Junior strikes out again.
Thanks, I’ll take a look. Though it seems a lot of weight to put on uncertainty, given the well-documented factors pulling the other way (zlb, unemployed resources, Liquidity constrained consumers) and the quite high upper value estimates for multipliers of 2 or more. Given the cross-currents, a more intermediate multiplier, say around one, might be more plausible.
Mb: The fact that the saving rate jumped so high in the months after the enhanced UI was implmented suggests to me a lower multiplier; there are a lot of low-income liquidity constrained consumers, but they don’t account for the bulk of consumption in the US.
“CBO expects the economy to operate considerably below its potential level over the next several years. The Federal Reserve is therefore expected to keep interest rates low
over that period. As a result, the legislation’s changes to federal spending and revenues—most of which are projected to occur in 2020 and 2021—will boost overall demand and output more than they would under normal economic conditions, CBO expects.”
Of course this means we should not be reigning in fiscal stimulus any time soon. But that does seem to be what McConnell wants to do. Mitch Herbert Hoover McConnell.
Their analysis is crap. Unemployment will likely be down to 7.5% by September and 7% by January. Both the Fed and CBO need to get a grip. Things are going to slow down in recovery, but that always was the case until a vaccine comes in 2021. My guess by the end of 2021, it will be 5.5%
Stimulus has already been done. The Government credit card stretched. Any new spending needs to be focused long term, over years.
Someone can correct me if I’m wrong, but I believe Jill Biden has been a longtime proponent of this course of action:
https://www.nytimes.com/2020/09/17/business/community-colleges-economic-recovery.html
I suspect (was I told a couple times??) some people on this blog do not appreciate my dry sense of humor. My attempts at David Letterman type sarcasm and Ernie Kovacs type comedic surreality. Now ALL of you must bow down before me, and give me my props. I demand worship after this. May I present to you, my comedic masterpiece. My great triumph of comedic orgasm:
https://www.youtube.com/watch?v=F2ooLZGVCKI
I haven’t done anything this epic in the annals of humor since asking Barkley Junior to forecast 2nd Quarter 2020 GDP. Good times……..
Bonus points for anyone who can spot under which piece of antique furniture Larry hides his 30 kilogram stash of cocaine. The one taped bundle labeled “Dried fruit to get through Jake Tapper interview” is now a collector’s item.
A product of public schools and a frequent patron of her local public library!?!?!??! Don’t anyone tell Bride of Satan Betsy DeVos this or she’ll have both of the buildings demolished and declared an environmental safety hazard and the local Chamber of Commerce will have to start a petition that both places are an eyesore to the local community:
https://www.nytimes.com/2020/09/20/nyregion/ruth-bader-ginsburg-brooklyn.html?action=click&module=Spotlight&pgtype=Homepage
The smallest multiplier is for PPP, money directed to private firms. The highest is for money directed to stae and local government and “other” programs. o of course we stinted on money for statss and locals. Supplemental jobless benefits have a higher-than-average multiplier, so they have ended. Idiots.
It is hard to know what assumption was made regarding hysterisis. The text on long-term effects cites negative factors – drags on future growth from thestimulusefforts. Nothing said about positive effects,suggesting hysterisis is ignored.
The higher multipliers are attached to programs which turn entirely or mostly into spending in the near term, which accords with what we know about getting policy as close as possible to the target – keeping leakage low. I wouldn’t say PPP was wasted, but we should face facts about the effectiveness of various policy efforts.
I do think the 59cents number is interesting, and I’ve always found the multiplier effect a fascinating topic. I get pretty opinionated on some things, try to get a “feel” for things. But I really don’t know if that 59cents seems correct or not. It’s pretty definitely under 1 but where to go from there I have no idea. I’m assuming there’s some way looking in the hind-view mirror to figure out if the 59cents was close to right or not,
Multipliers are always controversial. This is one of those areas in which salt water and fresh water guys cannot see eye to eye. One thing about hind-sight is that we atually know the monetary policy stance, so we don’t need to make an assumption about the biggest single reason to expect multipliers to be low. For policy making purposes, we do not strictly “know” the Fed’s response, but in fact we know that the Fed intends to remain accommodative for a long time, so the fresh water guys should give a bit of ground right now.
So if I am reading Fig. 1 correctly, for Q4 2020:
GDP without covid: cc $19.2 trillion
GDP covid + stimulus: $18.2 trillion
GDP covid, no stimulus: $17.0 trillion
Thus, GDP in Q4 would be down 11.5% without stimulus; and is down 5.2% with stimulus.
That right?
Steven Kopits: GDP for 2020Q4 according to CBO January 2020 projection was 19656, so (approx.) down 8% with stimulus, down 13.5% w/o stimulus (based on percentage of Jan 2020 projected GDP, not in log terms). This necessarily includes Fed action, since multipliers predicated on accommodative monetary policy.
Yes, thank you.
Put another way, it’s pretty bad.
I’d note that SPACs –blank check companies — are popular again. These are associated with financial crashes, that is, they appear in the last year or so before a financial crash. Given that the transactions costs are high — up to 30% of the transaction value including fees, the cost of the shell company and the sponsors’ carried interest — SPACs only make sense when there is a big differential between the public and private values of assets or businesses, ie, when stocks are over-valued.
COVID-19 cases continue to fall and states are loosening up their restrictions on many activities. However, risk assessment seems to be rather coarse. A lot of talk about the dangers of opening up universities, for example. The data would seem to indicate that is not a major issue. Probably because “cases” is too coarse of a metric. Any person with traces of COVID-19 or antibodies to the virus is deemed a case. Here is a sampling of cases, hospitalizations, and deaths at universities (including University of Wisconsin): https://twitter.com/andrewbostom/status/1308496346454913026?
For pgl, the weekly update: https://www.dropbox.com/s/gikhixkstxdxwhy/Covid-19%20Deaths%2C%20Cases%2C%20and%20Hospitalizations%20-%209-22-20.pdf?dl=0
The “second wave” peak for deaths was nearly two months ago; hospitalizations have dropped for seven weeks. As the CDC data shows, COVID-19 is an “old folks” disease risk because, by and large, they are simply not as healthy as younger people. Severe heart disease and COVID-19; COVID-19 is the cause of death. Terminal cancer and COVID-19; COVID-19 is the cause of death. Raging diabetes and COVID-19; COVID-19 is the cause of death. https://www.cdc.gov/coronavirus/2019-ncov/images/covid-data/hospitalization-death-by-age-lg.jpg
The politics and economics of COVID-19 may not be reflecting the present trends of the disease. Small businesses are still faltering under the restrictions of state executive orders. Larger businesses have been recovering faster with their greater resources and abilities to use technologies to their advantage.
The ships’ captains still have their anchors dragging while the “Coast Guard” is trying to get them moving again. So, the economy will sputter along.
No, Bruce, the 7 day average of new cases in the US stopped declining over a week ago and has been rising since, indeed that rise is accelerating. You are out of date.
So, no, your candidate with his “we have made the last turn” is just lying yet again. Don’t you know that?