While aggregate consumption has surpassed peak levels, it hasn’t returned to trend. Furthermore, the composition has changed drastically.
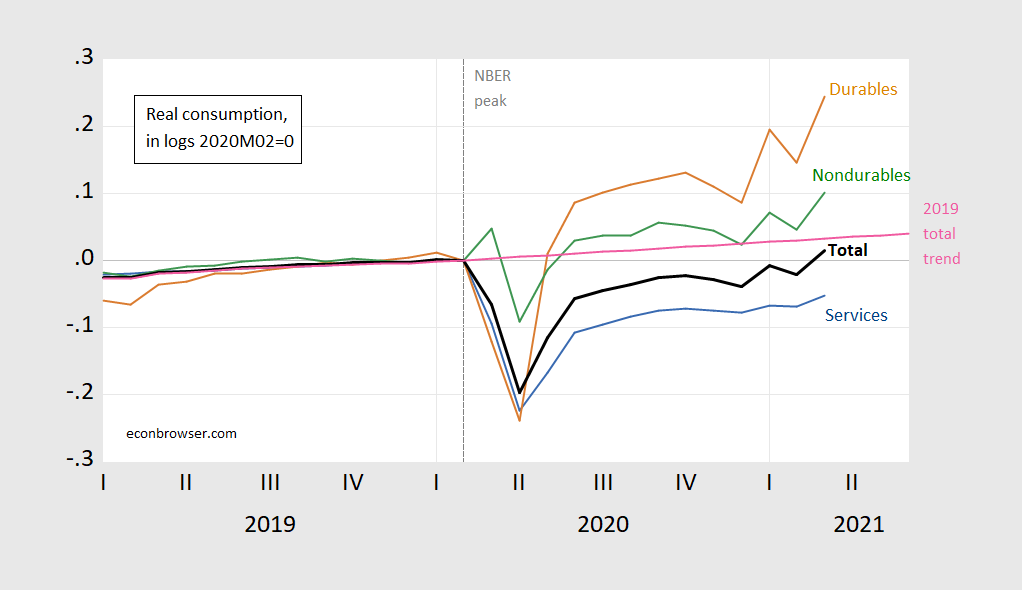
Figure 1: Total consumption expenditures in Ch.2012$ (bold black), services (blue), nondurables (green) and durables (brown), all in logs, 2020M02=0, and 2019 stochastic trend (pink). Source: BEA, NBER, and author’s calculations.
While durables consumption expenditures in March are 24% higher (in log terms) than at NBER peak, and services expenditures are only 5% lower, since services consumption is about 2/3 of total (as of 2012), then overall consumption is only 1.4% higher than prior peak. Total consumption is, incidentally, still 1.8% below 2019 trend.
The compositional effect is shown in Figure 2.
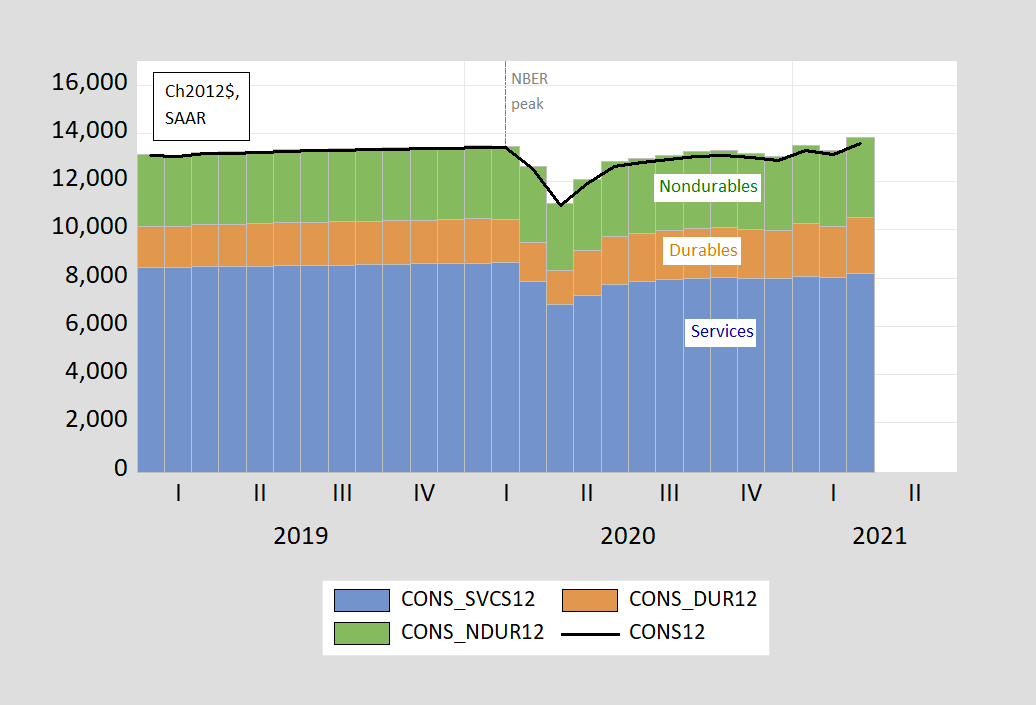
Figure 2: Total consumption expenditures in Ch.2012$ (bold black), services (blue), nondurables (green) and durables (brown). Source: BEA, NBER, and author’s calculations.
Irwin/NYT discusses the changing services/goods composition of GDP.
“There have been a lot of strange economic numbers over the last 14 months, as the world has been whipsawed by the pandemic. But one particular line of the first-quarter G.D.P. numbers released Thursday stands out even so. Americans’ spending on durable goods — cars and furniture and other goods meant to last a long time — rose at a stunning 41.4 percent annual rate in the first three months of the year. Enjoy your Pelotons and Big Green Eggs, everybody.”
Is this really strange? I have been saying for a while that a lot of us cook at home rather go out to restaurants. More groceries and some upgrades to the kitchen appliances. And yes – the gyms being closed have increased Peloton sales considerably but personal trainers have been out of luck. But something tells me that this is not a permanent thing as gyms and restaurants are reopening. Get the vaccine and keep wearing your masks!
Transportation equipment investment is down but we are buying more cars. Well we need to fixed those roads and bridges. And we also should be investing a lot more in the other forms of transportation equipment. Biden is on board but I guess Mitch McConnell thinks we should all be walking to work.
Returning to the surge in demand for cars noted by Irwin, CBS News was just talking to some car dealers who have sold a lot of cars of late when they turned to the semiconductor chip shortage Bruce “no relationship to Robert” Hall keeps babbling about. Never mind neither he nor his dumb sources get the vertically integrated semiconductor sector (like Samsung is nothing more than a contract manufacturer – how dumb is that).
What was apparent from this story was that it was an outward shift of the demand curve (more car demand means a higher derived demand for chips) not some inward shift of the supply curve which seems to be Bruce’s delusion. Investment in the chip sector is already underway and thanks to Biden a lot of this will be new US plants. Now if the MAGA hat wearing idiots were still in charge, we would be importing even more semiconductors.
Accompanying the good news is the announcement that real disposable income per capita reached an all time high in March.
https://www.advisorperspectives.com/dshort/updates/2021/04/30/real-disposable-income-per-capita-in-march-all-time-high
Of course, one always has to be circumspect when such announcements are made…whose income was it that rose? If the past decade is to be a guide, then the wealthy and most highly compensated were probably the ones who made out like bandits; the rest of us, hardly at all.
But there are indications that this time was different. Business Insider wrote: “Under President Joe Biden’s $1.9 trillion pandemic relief bill, poor Americans could expect a significant boost to their incomes, while the richest of the rich should expect, well, not much.”
https://www.businessinsider.com/poorest-20-of-americans-will-see-20-income-boost-under-stimulus-bill
Most likely it will be a one time blip, an anomaly. Soon we’ll be back to business as usual. The fat cats will continue getting obese. But who’s to notice? To my knowledge, statistics on the prosperity of income quintiles and on the top 1% are tracked only annually. Which begs the question, why? Why not track household income by quintile as often as other statistics? The simple, straightforward answer is that nobody cares.
And that begs the question: if statistics were readily available, would anyone notice? “In an article published April 12 in ‘American Political Science Review,” researchers found evidence that economics reporting “strongly and disproportionately” tracks the fortunes of the country’s richest households, likely because newspapers focus their coverage disproportionately on aggregate measures of economic performance, using data that, while plentiful, doesn’t track the financial fortunes of the vast majority of Americans.
https://academictimes.com/economic-news-reporting-suffers-from-bias-toward-richest-americans
With a media environment like that, it becomes easy to promote–with almost no pushback–policies that benefit the richest households at the expense of the rest, whose interest in the matter is considered irrelevant. Ditto their influence.
“Why not track household income by quintile as often as other statistics?”
Do you ever get tired of writing such false and stupid garbage? No one tracks the distribution of income? Give us all a break. My side hurts laughing at your incessant stupidity.
JohnH claims no one tracks US income by quintile. I thought the first thing that would come in a Google search would be Census doing just that:
https://www.census.gov/data/tables/time-series/demo/income-poverty/cps-hinc/hinc-05.html
Of course there was CBO doing the same and even the Tax Policy Center. Three seconds on Google and a bunch of this came up. JohnH – are you really this incredibly inept? A 3 second Google search. Damn!
What I said: “ To my knowledge, statistics on the prosperity of income quintiles and on the top 1% are tracked only annually.”
What pgl said: “ JohnH claims no one tracks US income by quintile.”
As proof of his false statement pgl linked to the Current Population Survey (CPS) Annual Social and Economic (ASEC) Supplement. Repeat ANNUAL survey.
And so it goes. Pgl needs to learn to read.
What a pointless counter. I guess you would not be happy until this is tracked minute by minute. You have no clue how much effort is put into this data and if you even tried to contribute, it would be seen as your usual unreliable garbage.
JohnH,
Aha, for once you have caught the usually correct pgl in an error. But then, we all make mistakes; I certainly do as your occasional ally Moses Herzog would be overjoyed to remind everybody here at great and exaggerated length for the umpteenth time.
That said there is a complication here that is not just a matter of government statisticians kowtowing to the rich. I am not aware of any nation on earth that tracks any measure of income distribution more frequently than the annual time period, including full-blown and half-blown socialist nations that are distinctly anti-capitalist. These are very hard and messy numbers to gather, and in the case of the US Census Bureau I do not think they track anything more frequently than annually.
You might argue somebody else should do it more frequrntly, BLS or BEA or somebody. But most of the things they track can be gotten from readiy available public sources, adding up sales figures by sector to get GDP or price level changes. Probably the only thing relying on surveying people is employment/unemployment, but the different surveys on this show different results, and this should be relatively simple, employed or not, although one gets into complications about part time, etc.
If you try to gather income (or the even more difficult wealth) data by survey you run into the problem of people lying. They do not want to report their true incomes (or wealth, if they even know it). There is an annual source, tax returns, although the IRS does not give that out all that readily, and, gosh, people lie on those as well, although probably less then they do to a cold-calling person making a survey.
I have spent quite a lot of time digging into and looking at income distribution data across nations and over time, usually Gini coefficients although sometimes quintile or decile data. This data is highly unreliable (and the wealth data is less frequently gathered and much less reliable). Go look at estimated Gini coefficients by nation and you will find substantially different numbers for given nations across different sources, World Bank, CIA, IMF, etc. Heck, which nation has the most equal income distribution in the world? Depends on which source yo u look at it. It is either Slovakia or Sweden or Slovenia or the Czech Republic or maybe even Finland on a sunny day. Is the Gini coefficient of China higher or lower than .40? Depends on the data source.
So this is much messier than I think you suspected. It might be a nice thing to have, but it would be expensive and hard to gather and probably so unreliable as not to be worth it, which, again, is probably why no nation on earth does it.
“I am not aware of any nation on earth that tracks any measure of income distribution more frequently than the annual time period, including full-blown and half-blown socialist nations that are distinctly anti-capitalist. These are very hard and messy numbers to gather, and in the case of the US Census Bureau I do not think they track anything more frequently than annually.”
Census explains what it does to produce this data and the basic data exists annually. After all we are talking income after net taxes. Ask JohnH if he files his income tax on a weekly basis. Most people do that annually.
On the matter of the messiness of income distribution data I just did a quick check on variations across sources, just looking at what Wikipedia lists, which is not a complete list. They have three different sources: World Bank, CIA, and UN (not IMF): The latter provides both decile ratios and quintile ratio estimates, the World Bank provides Gini coefficient estimates, and the CIA does decile ratios and Gini coefficients.
So I got the numbers for the 5 nations I listed as competing for being the “most equal income distribution” in the world. It turns out the UN and CIA agree on decile ratios, but the Gini coefficients differ.
So below I give 5 lists in order from most equal to least based on these three numbers: decile ratio, WB Gini and CIA Gini
Decile ratio:
Czech Republic: 5.2
Finland: 5.6
Slovenia 5.9
Sweden 6.2
Slovakia 6.7
World Bank Gini Coefficient
Slovenia 24.2
Czech Republic 24.9
Slovakia 25.2
Finland 27.4
Sweden 28.8
CIA Gini Coefficient
Slovenia 23,7
Sweden 24,9
Slovakia 25.3
Czech Republic 25.6
Finland 26.8
Quite a bit of variability across those lists. If one adds up their ranked positions across the lists to get a sort of average it goes like this:
Slovenia 5
Czech Republic 7
and the other three, Slovakia, Sweden, and Finland, all tied at 11.
If the movers and shakers really cared about having statistics sliced and diced by income group by month or by quarter, it works be easier than you think. There are roughly 143 million taxpayers. The IRS collects payroll taxes and income taxes withheld on a monthly or semi-monthly basis. Estimated taxes are due quarterly. In many cases payroll services like ADP do the grunt work. Individual Income data is all computerized, and individuals are clearly identified by Social Security number. There are even penalties for withholding/estimating too little.
Bottom line: it would not be that hard for companies to supply individualized data on a monthly basis instead of annually as they do now…if anyone cared to have monthly income data as frequently as we have for many other, popularly followed indices.
The key word here is popular. The movers and shakers (including economists holding prominent positions as government policy advisers) care about the stock market, interest rates, f-x rates, inflation, etc., so that is what gets tracked, no matter how complex the estimates.
But they don’t really care that much about knowing how the lower 80% are faring. After all, it’s the top 1% who overwhelmingly fund politicians. If they did, there would be data and reports.
Barkley:
Yes, all the points you raise are true; I have encountered each one in attempting to gather data, either domestic or international. I would add that, if you use a paper survey to gather data on income, a certain percentage (I forget the number) will not be returned and a similar percentage will be returned blank because they want you to pay postage and get no results. Of those surveys that are returned, ~10% (the percentage may be different now) will come back with a scrawled screed which uses every vile and nasty name they can think of to tell you that it’s none of your business (that’s the distillation of it using ‘nice’ words).
And these don’t even get at the fact that any survey which is meant to yield useful info is expensive to administer, both in treasure and time. Any new questions (which, for a new instrument means all of them) must be proofed and vetted by several to many different individuals, most of whom must have prior experience in conducting surveys. Even “old” questions must be reviewed using the notes from previous surveys to adjust them for any problems which arose.
Only then do you get to spend money, time, and effort to weed out nonresponses, obviously untrue or otherwise useless responses, etc. and start to construct a dataset. It should be blatantly obvious by now that this process cannot be repeated even on a monthly basis, let alone weekly.
So, yes, it’s readily apparent that JohnH knows absolutely nothing about collecting and using data. His complaints originate in yet another deep in his vast ocean of ignorance.
Sorry, JOhnH, your proposal will go nowhere and will not work. Way too many problems.
Lots of people do not make quarterly payments.
For fica there is that ceiling on wage levels above which people do not pay more, and it is those high income people you want to track.
Sorry, but this is just an utterly worthless suggestion. Nice try, but no can do (or if done will not provide anything close to what you want).
“But they don’t really care that much about knowing how the lower 80% are faring.”
JohnH, the lower 80% can be analyzed easily, as you stated. the upper 20% cannot be analyzed so easily. write-offs, capital gain harvesting, etc all contribute to a persons net worth and are most easily analyzed over the tax year, when documentation is submitted. this is not so easy to estimate during the middle of the year. and it is this group of people that has a pretty big impact on how wealth is distributed. donald trump has clearly indicated that this would be an impossible task for him to do monthly, as his financial situation is so complicated that the genius himself can sometimes barely grasp its complexity. if trump cannot do it, how could you expect any mere mortal to succeed with the same task?
https://www.cbo.gov/topics/income-distribution
“CBO regularly analyzes the distribution of household income before and after government transfers and federal taxes. The agency also studies federal programs designed to reduce poverty and increase income security.”
Regularly = annually. Ah but this is not good enough for Holier than Thou JohnH.
Of course no one reports on the distribution of income on a weekly basis. There are a lot of series reported annually. But if you are not doing this on a daily basis JohnH will accuse you of not caring about income distribution.
Of course such comments are beyond stupid and pointless. But this is standard faire for Holier than Thou JohnH.
Tax Policy reports on the real income of the lower quartile by year
https://www.taxpolicycenter.org/statistics/household-income-quintiles
Their real income has been rising for the last decade but according to JohnH this is nothing more than a blip. You see they are not reporting this monthly so none of care about income distribution according to Holier than Thou JohnH.
My apologies but JohnH started one of his patented pointless stupid tirades and I’m sure he will find another pointless way to continue it. He always does.
JohnH cares mostly about NOT being misrepresented, which seems to be what pgl loves to do. This time he got caught because the misrepresentation was so obvious and unambiguous.
Oh gee – repeating what you have said is misrepresenting you now. Yes – you are Trumpian to the core.
Thought this was interesting. It’s kind of hard to take Munger serious when his statements are so random and inconsistent. His comments are “all over the map”. At the same time these type of thoughts are interesting from someone generally considered to be part of the ultra-wealthy:
https://www.yahoo.com/news/charlie-munger-bernie-sanders-has-won-on-income-inequality-204749790.html
The terminology Munger uses also, is telling: “Bernie has basically WON on income inequality”. What happened to the George Wills, Charlie Mungers, David Brooks, Rick Santellis, and endless CNBC anchors posing as dissectors of society’s problems and that “class warfare and class identity is wrong and muddle-headed”?? What happened to “the world coming to an end tomorrow” if we listen to the working class’s worries?? No insults for the better elements of “popularism” today?? Where did all those guys run off to?? I guess they can’t sell enough balls to throw at targets for the poor to be duped they wanna gonna get that super-sized Tweety bird for their girlfriend at the traveling carnival if they repeated the script they were getting on business television and FOX?? Is “the right” in rebranding mode?? Memo to Republicans: Kristi Noem isn’t gonna do it for you in 2024, but by all means, please do:
https://www.nytimes.com/2021/05/02/us/politics/kristi-noem-south-dakota-republicans.html
“Vice Chairman Charlie Munger on Saturday declared progressive Vermont Senator Bernie Sanders (I-VT) the victor in the nation’s political fight over income inequality. The hot economy and loose monetary policy will end up narrowing the nation’s wealth gap, Munger predicted.
“With everything boomed up so high and interest rates so low, what’s going to happen is the millennial generation is going to have a hell of a time getting rich compared to our generation,” Munger says.
“The difference between the rich and the poor in the generation that’s rising is going to be a lot less,” he adds. “So Bernie has won.”
REALLY? Bernie won. No – according to your good buddy the fact we are reporting income distribution statistics on a weekly basis means no one cares about this issue. So Bernie lost.
Of course what I just wrote is bonkers. But hey this is the view of your good buddy.
@ pgl
See, and here all this time I thought you were getting rid of your negative energy in other places:
https://www.wsj.com/articles/andrew-cuomos-loudest-supporters-women-for-governor-cuomo-11619958600
Go team!!!!!
Don’t go against a molester of women if he’s the Democrat Governor of New York, because that would mean “You love donald trump”. Someone said those sentiments to me here once, that because I didn’t believe Cuomo’s death numbers that I “must love donald trump”. I forgot who it was now. Probably someone who can’t do simple subtraction of OAG death counts vs DOH death counts.
https://www.nytimes.com/2021/01/28/nyregion/nursing-home-deaths-cuomo.html
Hang tough pgl, remember #MeToo doesn’t apply to “sophisticated” and “tough” New Yorkers.
https://www.youtube.com/watch?v=Orjbwv8H9zM
Wait, pgl,are you in the special group in this blog who can’t be called out when you make FACTUAL errors?? Phone up Barkley Junior and let me know if you’re in that special group and then I’ll request Professor Chinn to rescind this comment.
How drunk have you been over the past 3 months? I am not supporting Cuomo for reelection so relax old pointless man.
@ pgl
Wow, it seems like a drastic change for you:
July 4, 2020 at 1:12 pm
https://econbrowser.com/archives/2020/07/an-employment-w-what-would-it-take#comment-238123
“A little good news from NYC on the restaurant situation. A lot of the Park Slope (Brooklyn) ones were serving food that people enjoyed sitting at tables outside. I’m just hoping our very careful governor does not freak out at what is happening in other states. We are pulling through and slowly reopening. Maybe the restaurant owners should demand proof that their customers are New Yorkers as we don’t need the damn mistakes being made in other states.”
pgl very soon after, claimed he never said “very careful governor”, even though the comment was literally two inches above in the same thread.
“he is trying to absolve Trump by attacking certain governors. The reality is that NY did not have enough testing in early April. We do know [sic].”
Honestly, I really thought pgl was going to momentarily lose control of his bladder muscles with this partly copy/paste comment from “DailyVoice”:
August 19, 2020 at 12:38 pm
https://econbrowser.com/archives/2020/08/why-do-we-care-about-retail-sales#comment-240219
While New York continues combating COVID-19, Gov. Andrew Cuomo has taken the time to write a book looking back at the state’s experience “climbing the mountain and coming down the other side” while dealing with the pandemic.
“American Crisis: Leadership Lessons From The COVID-19 Pandemic” is set to be released by Crown Publishing on Tuesday, Oct. 13, three weeks before Election Day.
The announcement of Cuomo’s book comes a day after he was a prominently featured speaker at the Democratic National Convention, harshly criticizing President Donald Trump, leading to a series of scathing tweets from Trump in response.
“I’m not entirely sure about the publication date but rumor has it coming out in October – just before the election.”
……
set to be released by Crown Publishing on Tuesday, Oct. 13, three weeks before Election Day
“Duh – that’s where I heard that!”
This prior pgl comment, the last sentence is a direct quote from pgl. As you read it, remember that over months pgl defended Andrew Cuomo’s policy on nursing homes, but said in another comment, his description of Cuomo as being a “very careful governor” was being “snark” after I called pgl out on it. Now, if the gentle readers believes the BS that that was “snark”, look at this comment from April, and tell me pgl’s endless fawning for months over Cuomo, was “snark”:
April 14, 2020 at 1:32 am
https://econbrowser.com/archives/2020/04/the-council-to-re-open-the-economy#comment-235838
commenter pgl says: “Cuomo hosted a conference call with the governors of the Northeast Region which expressed some smart ideas including the need for testing. Cuomo is basically our national leader given we still have a pack of clowns occupying the White House.”
pgl, Were those “pointless” comments you made, about your state’s Governor, that you had over a decade’s worth of time to become familiar with??
Census informs us how they collect their annual information on the distribution of household income:
https://www.census.gov/topics/income-poverty/income/about.html
This is a lot of work and the underlying data is collected ANNUALLY. So it is not possible to report this data on a monthly basis as JohnH insists they do. Yes JohnH insists that no one cares about income distribution because this data is not reported more often. But if the underlying data is reported – what does he expect? Unreliable guesses which is what he is known for.
Census does care as do a lot of other people which is why they put in the hard work. To suggest otherwise is beyond insulting. But hey we are talking about JohnH.
Now if JohnH paid a bit of attention he would see a steady rise in the real income of the lower quintile for the last decade. Ah but this must be a blip simply because the data has not been reported monthly? WTF?
‘JohnH
May 2, 2021 at 4:27 pm
If the movers and shakers really cared about having statistics sliced and diced by income group by month or by quarter, it works be easier than you think.’
This BS from someone who has to take off his shoes to count past 10. Hey JohnH – when in a deep hole it is not a good idea to keep digging.