BEA released figures today. From the release:
Durable goods manufacturing; professional, scientific, and technical services; and information services were the leading contributors to the increase in real GDP nationally (table 2). Accommodation and food services was the leading contributor to the increase in Nevada. Accommodation and food services increased 16.9 percent nationally and contributed to the increases in all 50 states and the District of Columbia.
Other highlights
- Durable goods manufacturing increased 15.6 percent nationally and contributed to the increases in 48 states. This industry was the leading contributor to the increases in 24 states including Utah, the state with the second largest increase.
- Professional, scientific and technical services increased 11.8 percent nationally and contributed to the increases in all 50 states and the District of Columbia. This industry was the leading contributor to the increase in six states and the District of Columbia.
- Information services increased 14.4 percent nationally and contributed to the increases in all 50 states and the District of Columbia. This industry was the leading contributor to the increase in Colorado, the state with the fifth largest increase.
- Nondurable goods manufacturing decreased 4.2 percent nationally. This industry moderated increases in real GDP in 36 states, including Texas, the state with the smallest increase.
Overall, the Nation is close to peak levels recorded in 2019Q4; however, there’s wide variation.

Figure 1: GDP relative to 2019Q4 GDP; darker shading denotes higher ratios. An entry of 0.06 indicates GDP was 6% higher in 2021Q1 than in 2019Q4. Source: BEA, and author’s calculations. [map revised 6/27]
Utah is at the top at 3.9%, Hawaii at the bottom at -7.9%.
Quarter 1 growth rate also varies widely. Below are annualized rates.
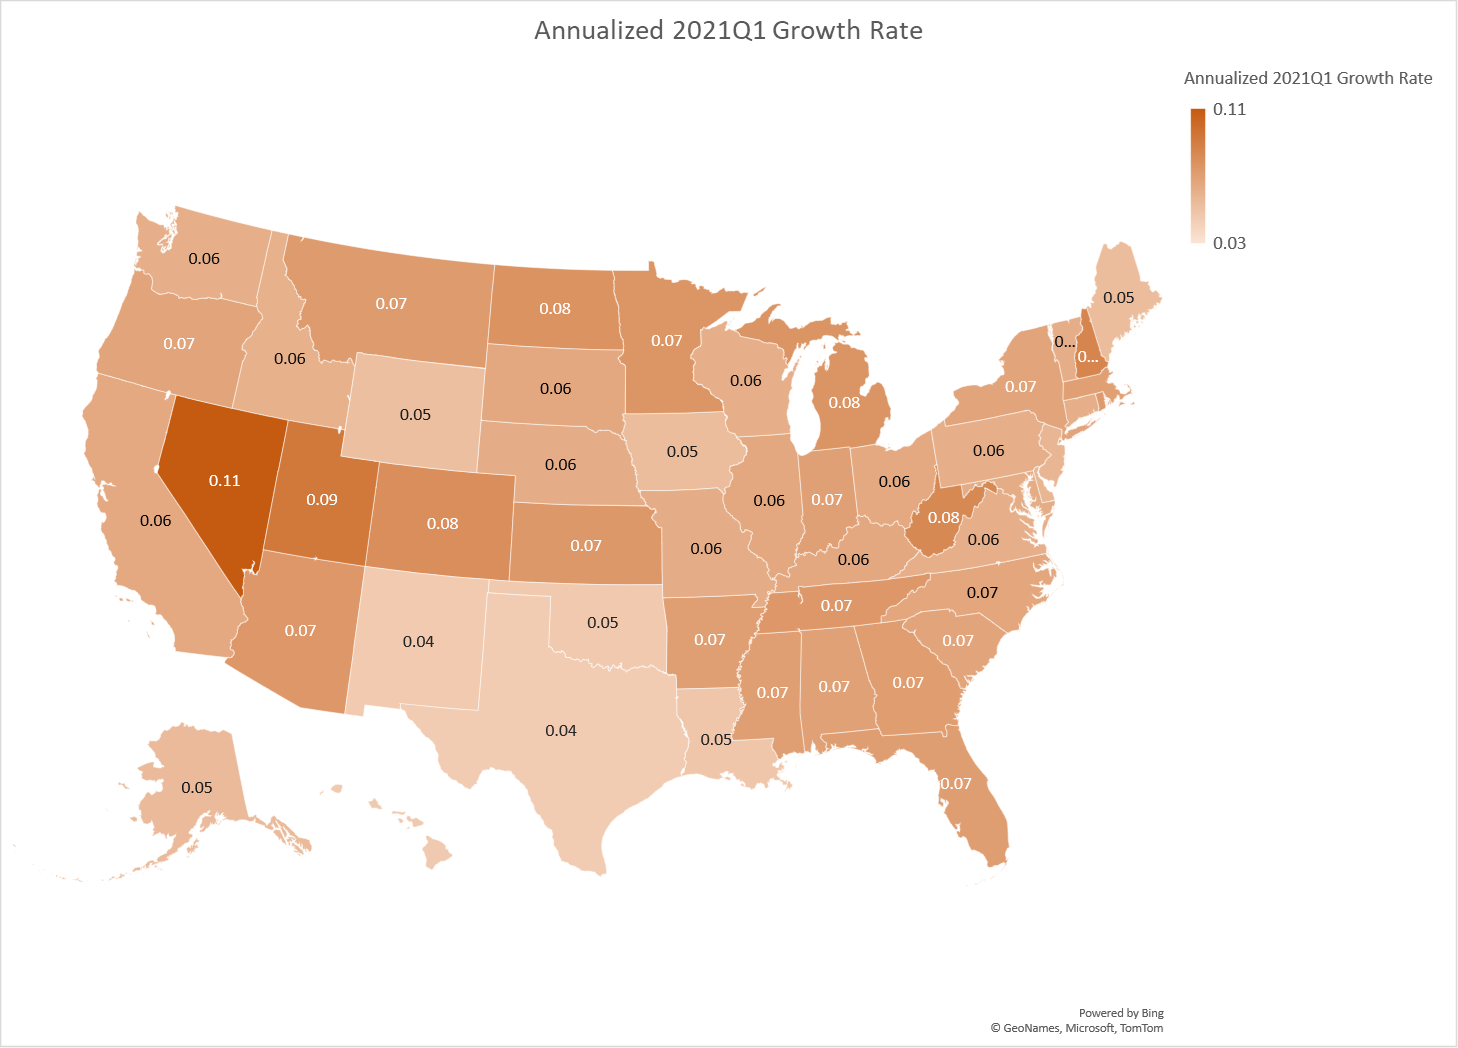
Figure 2: GDP annualized growth rate, 2021Q1. Darker shading denotes faster growth. An entry of 0.11 denotes 11% annualized growth. Source: BEA and author’s calculations.
Fastest growth going from 2020Q4 to 2021Q4 was 10.9% in Nevada, vs. slowest at 2.9% (Washington DC).
How does the recovery correlate with vaccination rate. Below is a map of vaccination rates:
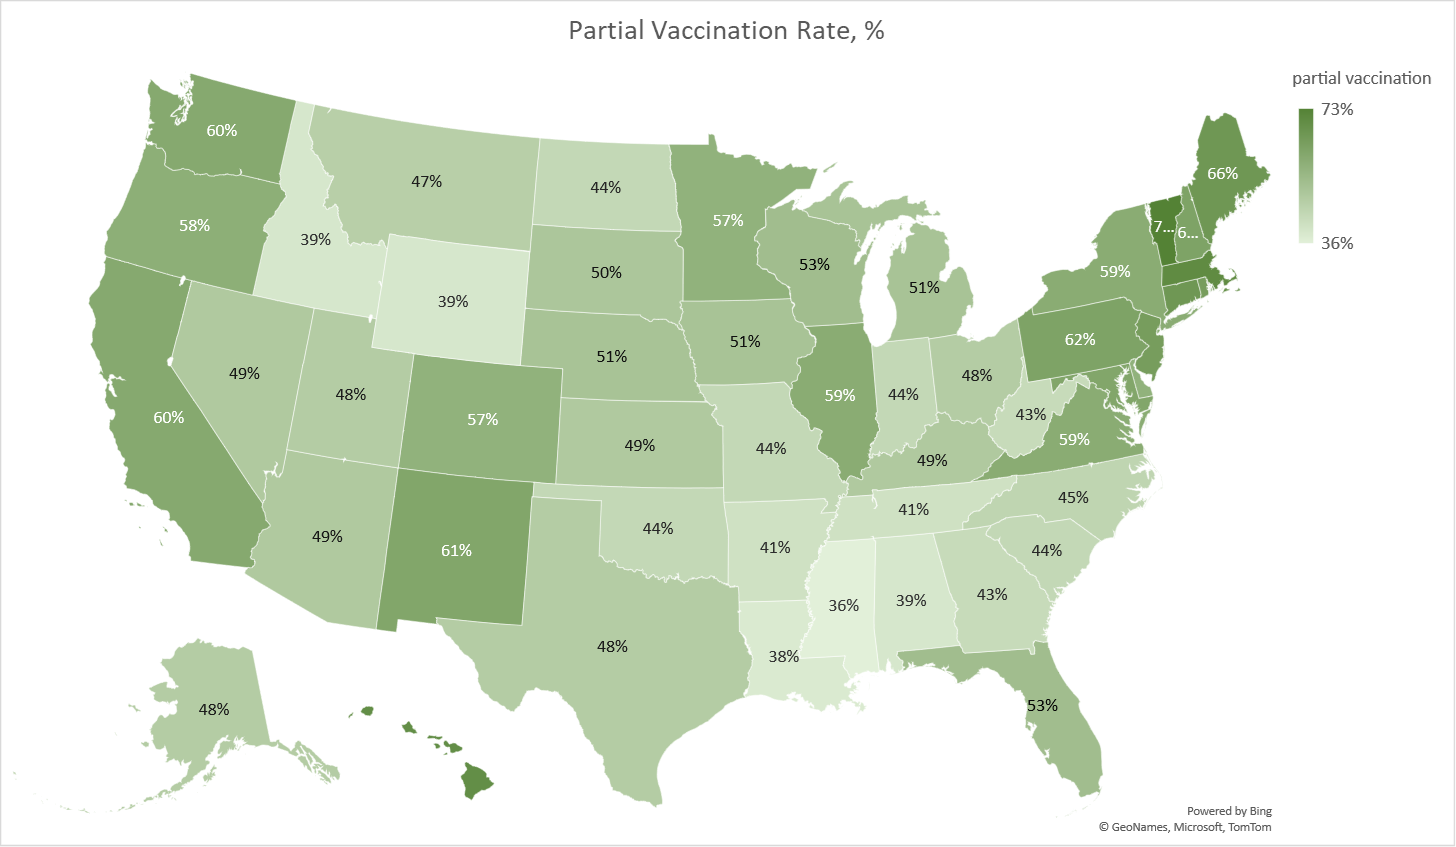
Figure 3: Partial vaccination rates, %. Darker shading denotes higher rates. Source: USAFacts (as of 24 June 2021), and author’s calculations.
Highest partial vaccination rates are in Vermont (73%), and lowest in Mississippi (36%).
As it turns out, a greater degree of recovery is associated with a higher partial vaccination rate (using Q1 GDP, as shown in Figure 1) – and statistically significantly so, using robust regression (slope = 0.056). (Drop outliers in relative GDP Hawaii and Wyoming, and OLS indicates a significantly positive relationship, wherein a one percentage point higher vaccination rate is associated with a 0.05 percentage point higher level of relative GDP).
Figure 4: 2021Q1 GDP relative to 2019Q4 versus partial vaccination rate (blue dots), nearest neighbor fit (brown line). Source: BEA, USAFacts (as of 24 June 2021), and author’s calculations.
Obviously, this is in the nature of a correlation; there are no control variables (e.g., structure of economy, initial per capita GDP, etc.), nor accounting for endogeneity. Nonetheless, the fact that the correlation pops up so readily is interesting.
[In response to comments re analysis, here is updated analysis 6/27/2021]
A simple correlation of output increase relative to 2019Q4 and vaccination rates does not evidence robust relationship. We also know that vaccination rates are likely both endogenous, and growth rates also depend on other structural factors. Implementing two stage least squares over the sample (dropping outlier Utah, and Alaska and Hawaii for which the other variables are not available for) yields:
Δy = β0 + β1vaccrate + β2ldensity + β3mfg + u
R2 = 0.07, bold denotes significance at 20% msl using White standard errors. South, mild and distance are instruments for vaccrate.
Δy is change from 2019Q4 GDP level, vaccrate is vaccination rate, ldensity is log population density, mfg is ratio of manufacturing output to GDP in 2019, south is a dummy variable for southern states, mild is a variable for more mild weather, and distance is a variable measuring distance from water. These state-specific variables are used in this analysis.
The estimate for β1 is positive, but not anywhere statistically significant, while the estimates for β2 and β3 are negative. All in all, there is little evidence that vaccination rates in and of themselves have shown to have any association with recovery, at least insofar as GDP in Q1 is concerned.
The biggest problem with the correlation is that the two variables come from different timeframes. The GDP data is from a time when very few folks were fully or even partially vaccinated. In fact, for the most part it was retirees who were vaccinated in the 2021Q1 timeframe. That said, states with higher vaccination rates today were very likely the same states that were less cavalier in their attitude towards the pandemic, so today’s vaccination rates could be thought of as a kind of proxy variable for social responsibility, with greater social responsibility during throughout most of 2020 setting a state up for greater growth in 2021Q1.
NY seems to be doing well which is surprising given how hard we were initially hit and how the NYC economy depends on things like Broadway and tourism. Oh wait – we are getting vaccinated!
Jimmy Kimmel, who I’ve been watching a little more lately, though Colbert has been my usual “go to”, Kimmel was making some kinda joke about the ones (states) with low participation vaccine rates, and there’s kinda that section there in the southeast where they’re all packed together, and he was joking it was like a group of troublemakers sitting next to each other in a classroom and they needed to be separated. The joke doesn’t come across well in text on a blog, but I gotta say it seemed pretty funny when Kimmel said it.
Menzie,
Holy Buddha that penultimate sentence is a real whopper. My suspicion would be that this correlation has some meaningful causal relation, but at least make an attempt at a meaningful analysis – this is absolute [insert poop emoji].
Professor Chinn is making clear in the last sentence that this doesn’t fit the stricter standards of econometrics. That doesn’t mean it’s not a very interesting post or there’s nothing of value to be taken from it. Work which ends up winning a Nobel Prize often starts out with “casual observations”. Krugman has made this point many times. I think even Eugene Fama would support this line of thought~~that imagination and simply “pondering” things is important to making transformative or paradigm changing breakthroughs. Richard Thaler’s work wasn’t the most mathematically complex, but it still carried a high value. I would argue that Economists who aren’t trying to use their imaginations to make connections which can later be modeled, are, for lack of a better phrase “professionally dead”.
“at least make an attempt at a meaningful analysis”. Like you ever do. Come on man – try doing this using your sophisticated Quantity Theory of Money!
Menzie,
Your correlation chart looks more like a shotgun blast.
You should appreciate that since you would say any form of sensible gun legislation violates the 2nd Amendment.
“NY seems to be doing well which is surprising given how hard we were initially hit and how the NYC economy depends on things like Broadway and tourism. Oh wait – we are getting vaccinated!
Not too surprising. The high rates of infection early on in New York created a large number of people with acquired immunity, perhaps 30%. Combine this with high vaccination rates and you quickly get a very high percentage of immune population.
Compare that to Washington and Oregon. They also have very high rates of vaccination similar to New York, but they currently have much higher rates of infections than New York. This is because they had very good compliance with masking and social distancing over the last year which kept their hospitalization and death rates low, but also reduced the number of people who acquired immunity through mild infections, perhaps as low as 15%. So in order to get equivalent herd immunity, Washington and Oregon have to achieve a 10% to 20% higher rate of vaccinations which is going to take a few weeks longer.
What this means is that Washington and Oregon did a really good job of preventing deaths but now they have to play catch up through higher rates of vaccinations. This anomaly explains why some of the states that did the best job at preventing infections are now lagging behind some of the states that had high rates of infection.
For example South Dakota, which had very high rates of disease and now has middling vaccination rates currently has a lower infection rate than Washington which had very low infection rates over the last year but has one of highest vaccination rates in the country. But South Dakota’s high herd immunity came at very high cost, nearly three times the death rate of Washington over the last year. South Dakota is the Sweden of the Nordic countries.
The question is what specific type of “Coronavirus” variable would be the most interesting to compare to the economic growth variables. The vaccination rate variable is a bit problematic because it is unlikely to have much influence on anything economic, yet. It’s only a few month ago that vaccination rates began to have substantial correlation to rates of diagnosis of Covid-19 (and that is a set of parameters where we know that there is a clear causality connection).
In my opinion the big question has been the claims that government dictated lockdowns has been the cause of economic hardship – and that if government didn’t shut down then the economy did a lot better. Another question is whether the economy did better if people’s movement (cell phone ping data) was less reduced (that will catch not just government restriction but also the degree of compliance. My final question is whether the rate of infections in a given state influence economic activity (will people hide inside and stop shopping if rates get scary high).
Most of the research/data is saying if you have TWO Moderna shots or TWO Pfizer shots you’re covered on the Delta variant, certainly going out to 6 months time frame, maybe longer. With the possible exception of wearing a mask in cramped quarters or high traffic areas, I’m done worrying about these morons. If they don’t want the shot or at least wear the mask they (I’m speaking inside USA where they can access vaccine for free) can all drop drop like flies for all I care, It’s “expedited evolution”. The only exception I might make is the elderly or invalids trapped in their homes. But my understanding is the Fed and local government agencies/ LOCAL Churches/Christian charities etc have made provisos for these people. What the hell excuse is left??—-IF THEY WANT TO DROP DEAD LET THEM. Less MAGA hats to look at.
I heard a news story today that all of the people who have recently died from COVID19 were unvaccinated. Come on people – get your vaccinations ASAP.
*provisions, excuse me
@ Menzie
Wouldn’t the most basic way of saying the problem with this blog post’s premise is that there are “lurking variables”?? I’m not disagreeing with what Menzie said, in fact I think I am just repeating what Menzie said near to the end, but in more basic language.
J&J just settled with NY paying out a few bucks at least for getting people hooked on opiates. The better news is that they also agreed not to sell this garbage going forward.
Menzie In order to make things a little more time consistent I regressed the change in a state’s Philly Fed Coincident Index from Dec 2020 to Apr 2021 against the states fully vaccinated rate. Anyway, I found a statistically significant (HC1 robust standard errors) for the full dose vaccination rate, with a coefficient of 0.07 and a p-value of 0.017. The R-sq was 0.082, so obviously this still left a lot to be explained. I would have liked to use Philly data later than April since the vaccination rates run through June, so there’s a little inconsistency there. OTOH, the big surge in vaccination was in March & April.
There may be more of a correlation between vaccination rates and economic activity later this year. As the various mutations become prevalent, and as the economic differences between states become more affected by infection rates, there may be more of a correlation. I haven’t looked to see whether there’s another wave of infection brewing or not.