Today, we are fortunate to present a guest contribution written by Paweł Skrzypczyński, economist at the National Bank of Poland. The views expressed herein are those of the author and should not be attributed to the National Bank of Poland.
In June 2021 nonfarm payroll employment was 4.4% below pre-pandemic peak level. At the through of COVID-19 recession, which most likely occurred in April 2020 but wasn’t declared by NBER yet, employment was 14.7% below pre-pandemic peak level (Figure 1).
Figure 1. Employment during COVID-19 recession and recovery
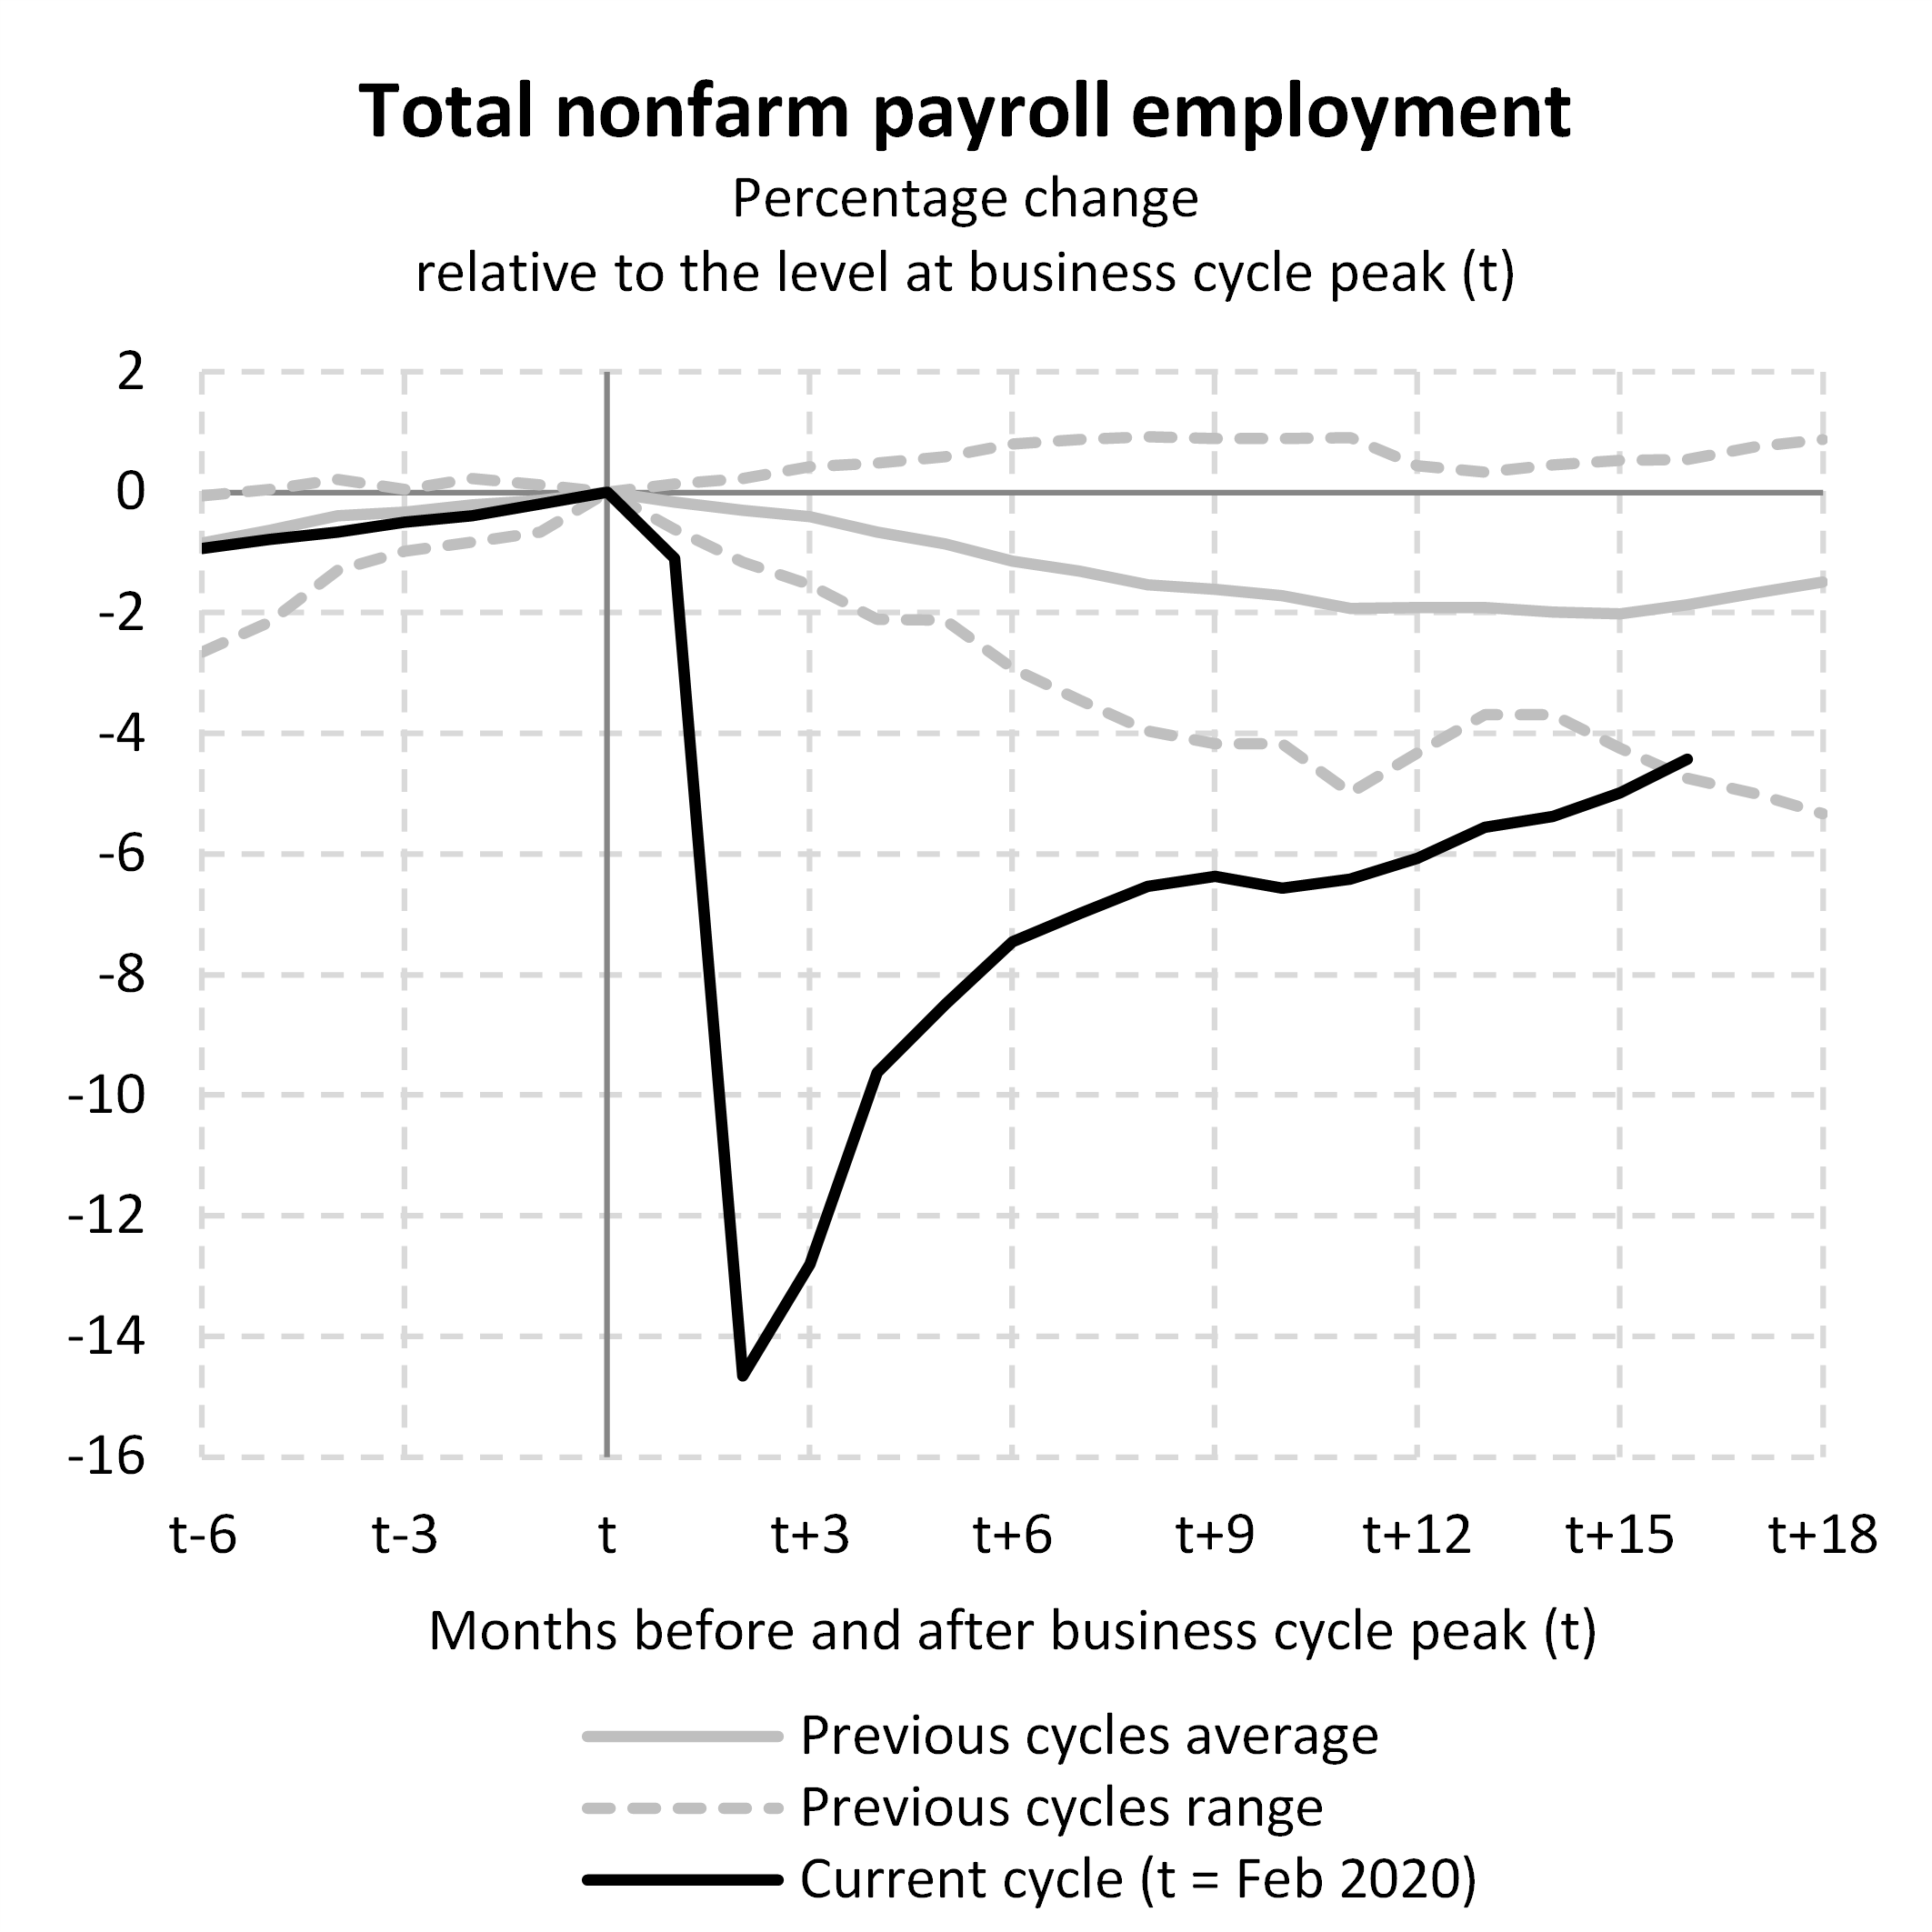
Note: previous cycles average and range refer to all post-war cycles including the Great Recession and subsequent recovery.
Source: own calculations based on BLS and NBER data.
Without any doubt much progress has been made, still the labor market is far behind full employment state. How far? One way to tackle this question is to calculate the deviation of employment from its trend. According to the approach proposed by Aaronson et al. (2016), the level of the nonfarm payroll employment trend is given by:
E_tr = POP_tr x LFPR* x (1 – U*) x (E/HH)_tr,
where POP_tr is the population trend, LFPR* is the potential labor force participation rate, U* is the natural unemployment rate and (E/HH)_tr is the trend of the ratio of payroll to household survey employment. Respectively the variable E – E_tr is the employment gap, i.e. the measure of labor market slack. To obtain POP_tr I append most recent CBO projections onto historical data and smooth the resulting series with the HP filter as proposed by Aaronson et al. (2016). For LFPR* and U*, both historical and projected, I use most recent CBO estimates. Finally, (E/HH)_tr is obtained with HP filter smoothing as proposed by Aaronson et al. (2016). Figure 2 presents the resulting nonfarm payroll employment gap along with the output gap, measured as the deviation of real GDP from CBO’s real potential GDP estimate.
Figure 2. Nonfarm payroll employment gap (%) and output gap (%)
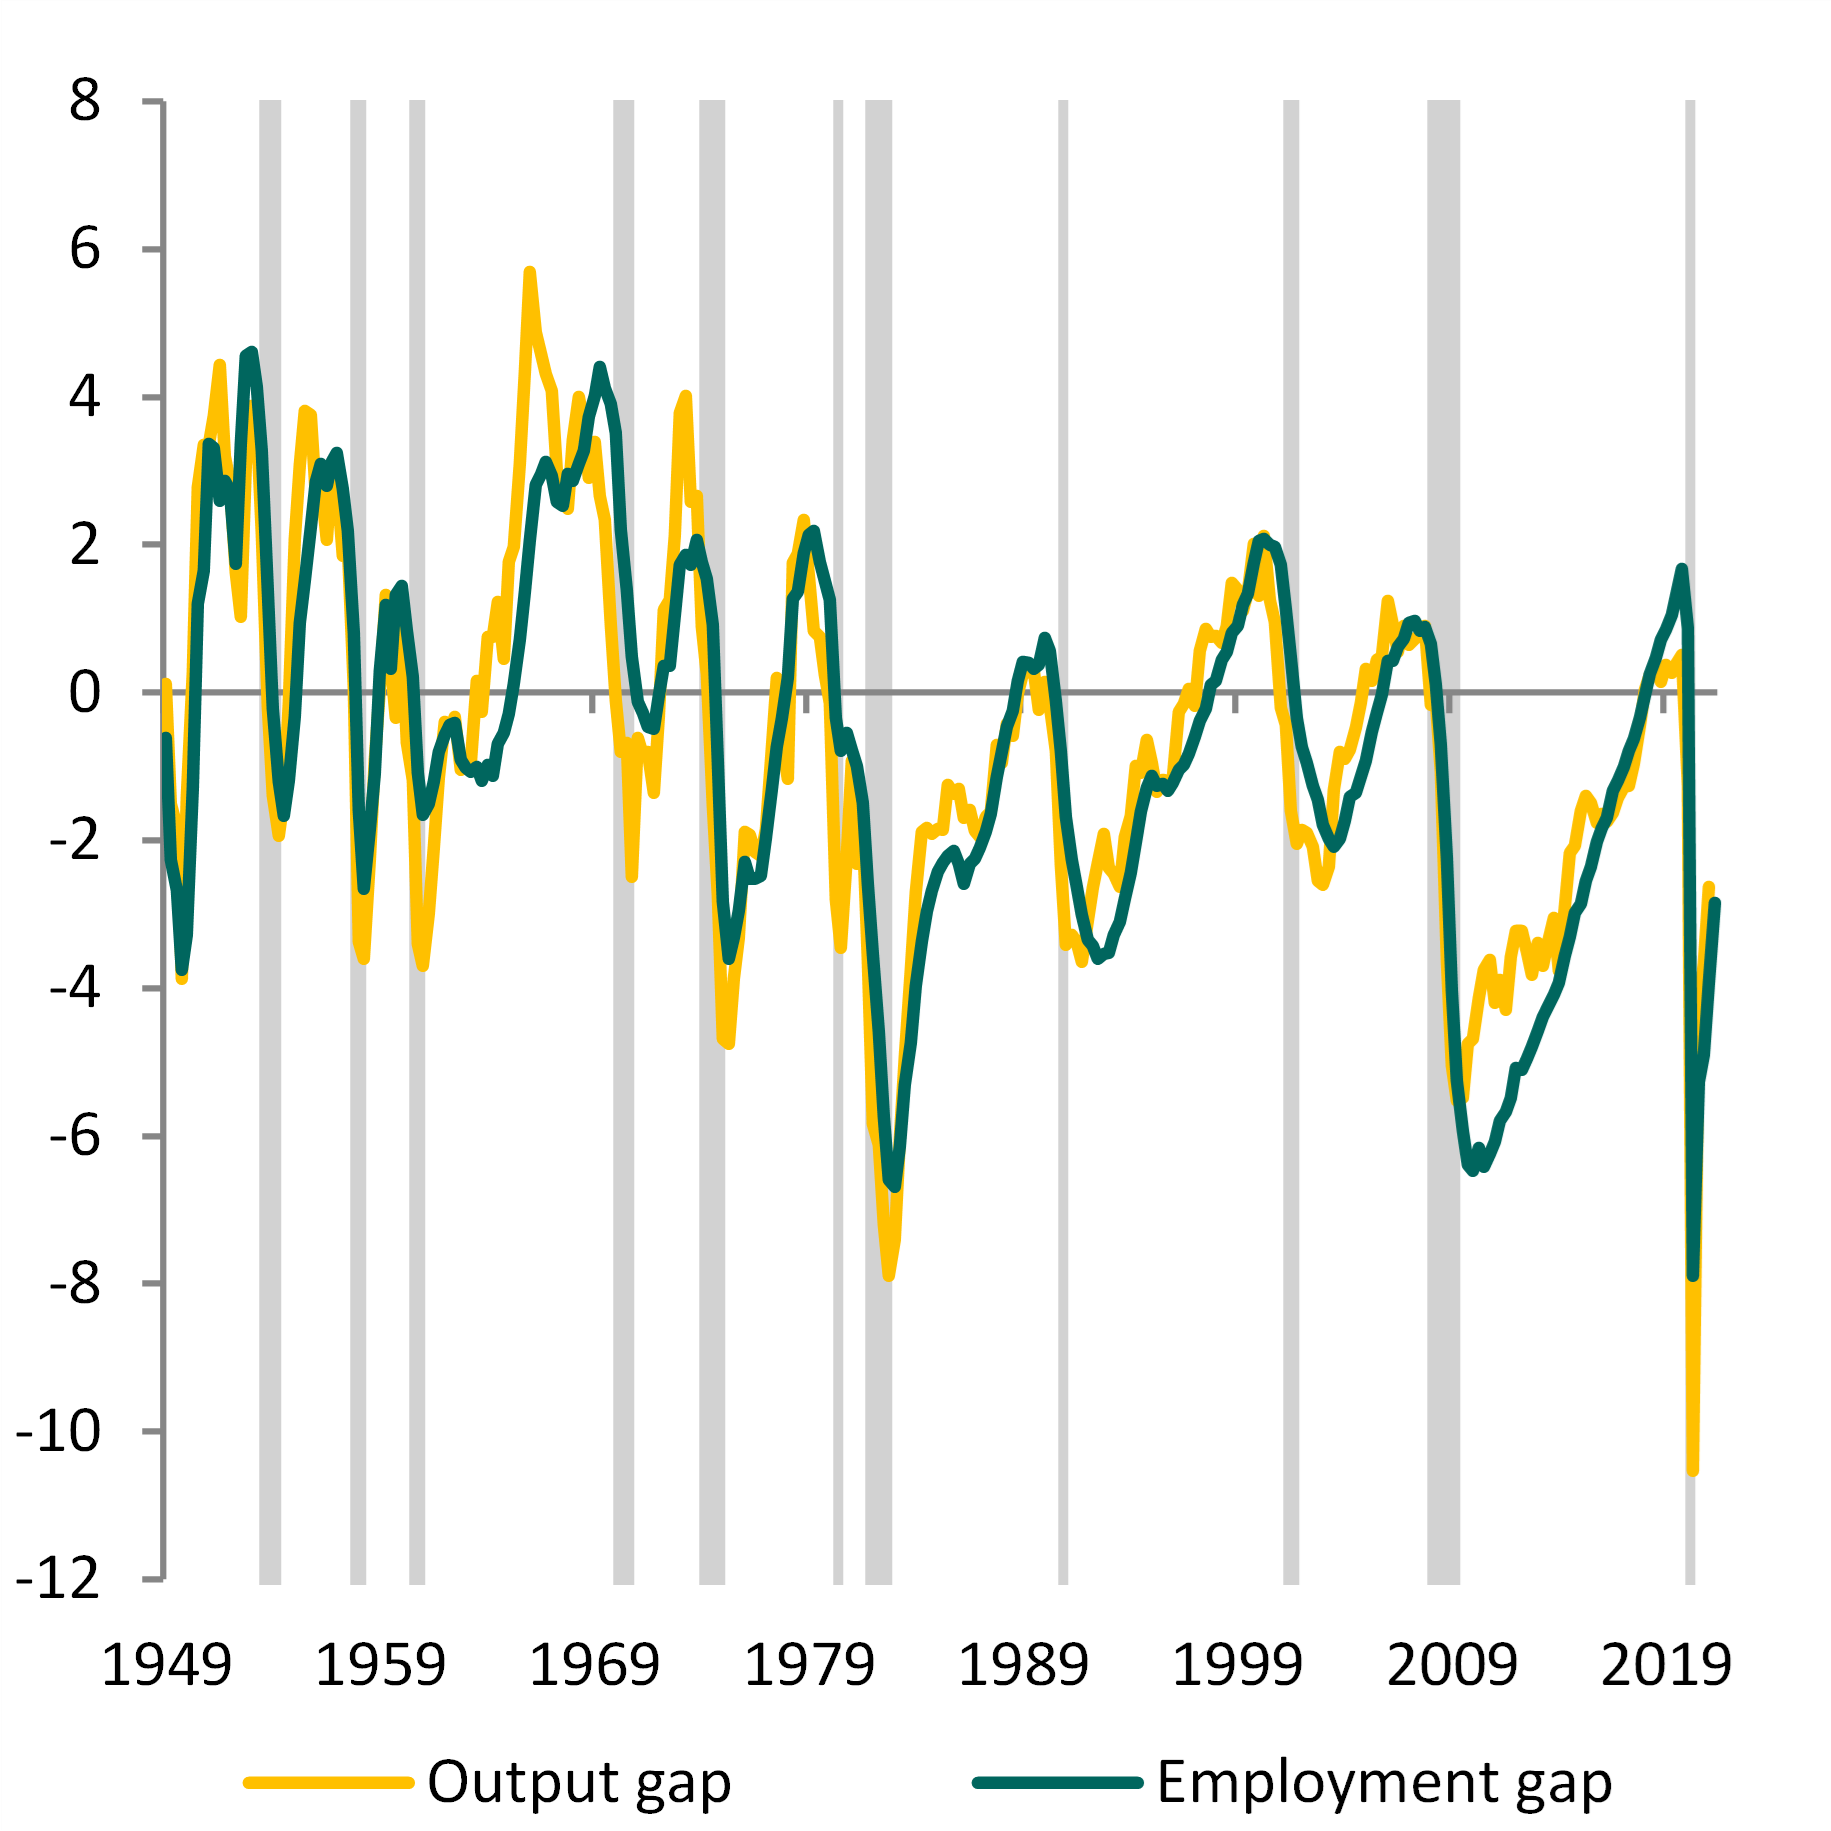 Source: own calculations based on BLS, BEA and CBO data.
In the second quarter of 2021 the employment gap was -2.8% (-4.3 million jobs). In turn we may conclude that the labor market is still 4.3 million jobs below full employment of which roughly 2.5 million results from the labor force participation rate decline below its potential level and around 2.1 million from unemployment rate being still above its natural level (Figure 3). The remaining +0.3 million deviation results from the population and ratio contributions combined (Figure 3).
Figure 3. Employment gap decomposition (millions of jobs)
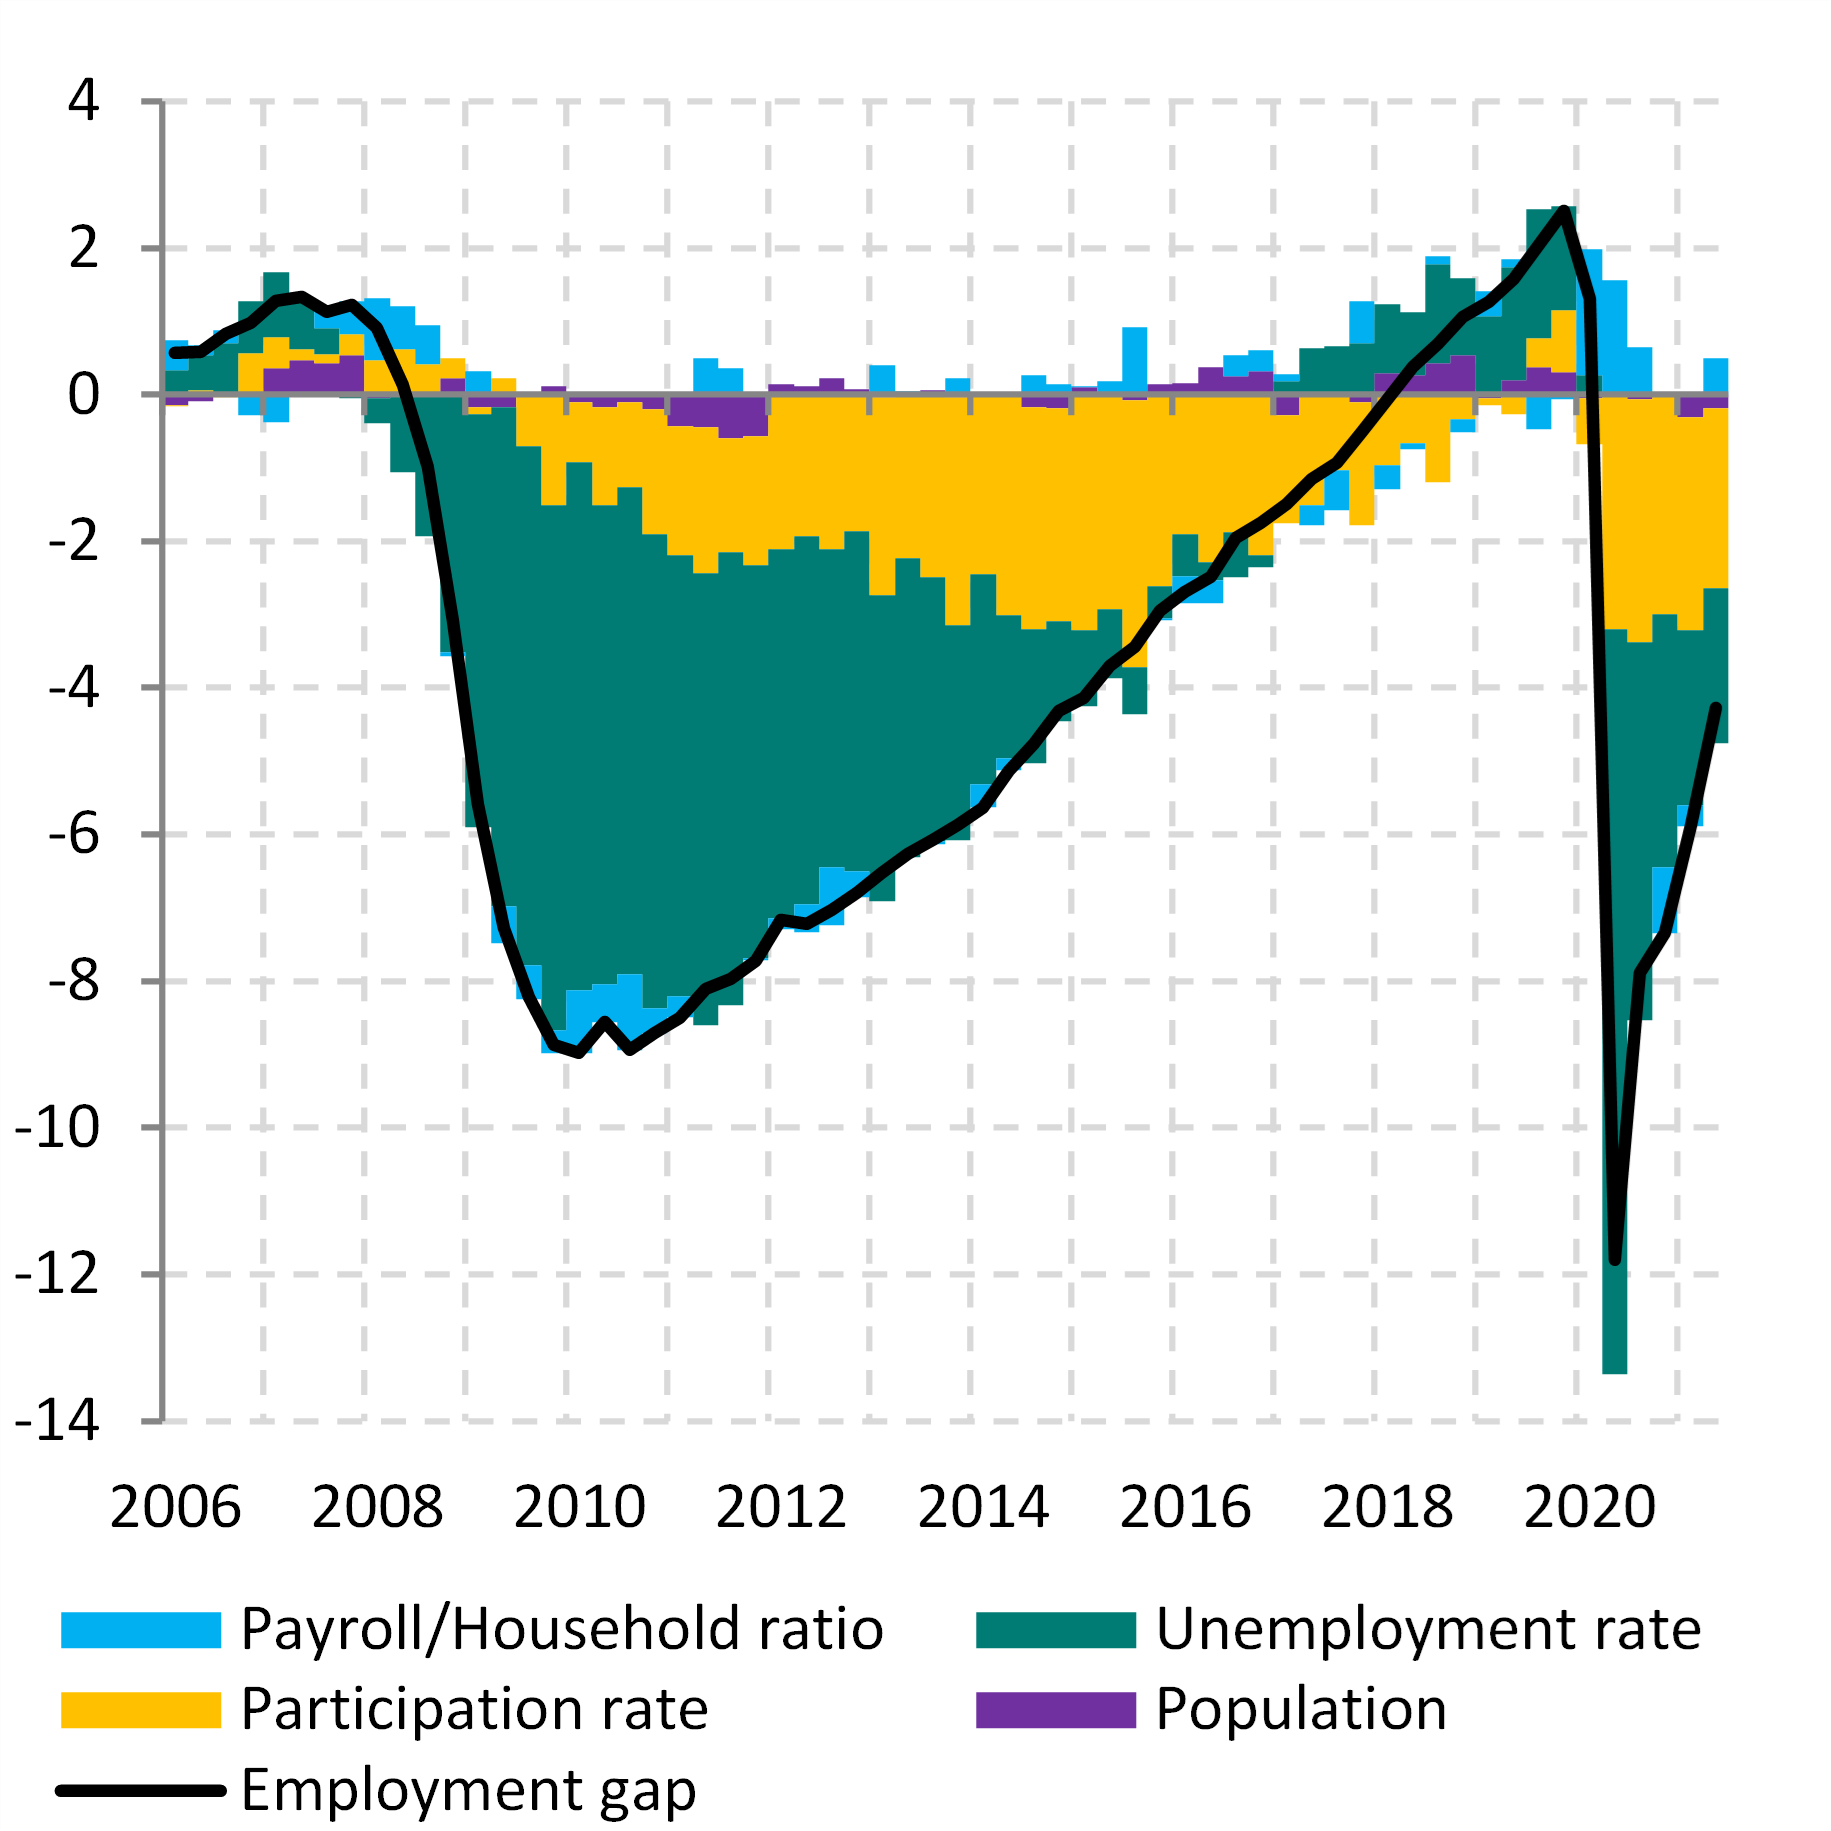
Source: own calculations based on BLS, BEA and CBO data.
So, when can one expect this gap to close? If one assumes that the pace of job creation holds at 500k per month the gap would close already in the first quarter of 2022. This would correspond to the level of nonfarm payroll employment being the same as in the fourth quarter of 2019, that is at previous business cycle peak. Hopefully things will evolve that way.
References
Aaronson D., Brave S. A., Kelly D., 2016, Is there still slack in the labor market?, Chicago Fed Letter 359, Federal Reserve Bank of Chicago.
Aaronson D., Hu L., Seifoddini A., Sullivan D. G., 2014, Declining labor force participation and its implications for unemployment and employment growth, Economic Perspectives, Federal Reserve Bank of Chicago, Vol. 38, Fourth Quarter, pp. 100-138.
An Update to the Budget and Economic Outlook: 2021 to 2031, Congressional Budget Office, July 2021.
This post written by Paweł Skrzypczyński.
First, I want to say it is super cool that Pawel got into the posts section of the blog, over the comments section. And I know Menzie didn’t do that because Pawel intermittently makes some great contributions to the comments section, but because Pawel met a certain level of competency that I am only semi-ashamed to say I am extremely envious of.
I think that expecting the employment gap to close by first quarter of 2022 to me is being pretty optimistic. But I have not used the statistical or econometrics rigor that Pawel has, so I’m not going to be too vehement about that, as Pawel is standing on much more solid ground than my “Oh, my gut tells me this is being very optimistic”. But I do still have a right to my opinion however shallow my “analysis” is, and in a friendly bearing say that I view this as slightly on the optimistic side.
But I do like this post, Menzie will testify like most people employment stats are at the top of my list, so this is a great post, I hope Pawel submits some more posts if the spirit moves him.
Thanks Moses. I also think that expecting this gap to close in Q1 2022 is quite optimistic. As I outlined the economy would have to add 500k jobs every month for the next 9 months. Slice that pace in half and you land with the gap of around +0.5k jobs in Q1 2023. Do not treat this linear extrapolations as predictions but as a simple visualisation of how far from the full emplyment we still are. We know that this recovery is far different in nature than previous cycles. We are still experiencing very high volatility in economic data due to the ongoing reopening, government aid, pandemic course itself and related uncertainty. I guess the road ahead is still bumpy, but expect the volatility of economic data to fade which will make forecasting more accurate again. Of course Aaronson et al. procedure presented in this post is not the only one to measure labor market slack. Take for example an interesting take on this issue from Dallas Fed: “We show that the labor market was tight in February 2020 and, after taking this into account, it remains around 675,000 jobs short returning to neutral.” Link: https://www.dallasfed.org/research/economics/2021/0706
If on the one hand, the employment gap is still wide, and on the other, wage growth has accelerated, there must be some additional factor(s) at work to account for this situation. Composition? I don’t know of strong evidence that high wage sectors are hiring faster than low wage sectors. Quite the contrary.
Friction? I could believe friction in the labor market is driving up wages. Not enough information out there. Not enough time for firms already short of workers to do adequate search.
If friction is a real problem, upward wage pressure will abate with time, all else equal.
Of course, willingness to raise wages rather than lose business sort of suggests excess profits and suppressed wages.
https://fred.stlouisfed.org/graph/?g=DtEc
August 4, 2014
Real per capita Gross Domestic Product for Germany, Austria, Poland and Hungary, 1992-2019
(Percent change)
https://fred.stlouisfed.org/graph/?g=DtEf
August 4, 2014
Real per capita Gross Domestic Product for Germany, Austria, Poland and Hungary, 1992-2019
(Indexed to 1992)