From Reuters today:
U.S. producer prices accelerated in June, leading to the largest annual increase in more than 10-1/2 years, suggesting inflation could remain high as robust demand fueled by the economy’s recovery from the COVID-19 pandemic strains the supply chain.
The report from the Labor Department on Wednesday followed on the heels of news on Tuesday that consumer prices increased by the most in 13 years in June. There are, however, signs that inflation is close to peaking. Underlying producer prices rose at a moderate pace on a monthly basis in June.
Here’s the CPI against the PPI (finished goods).
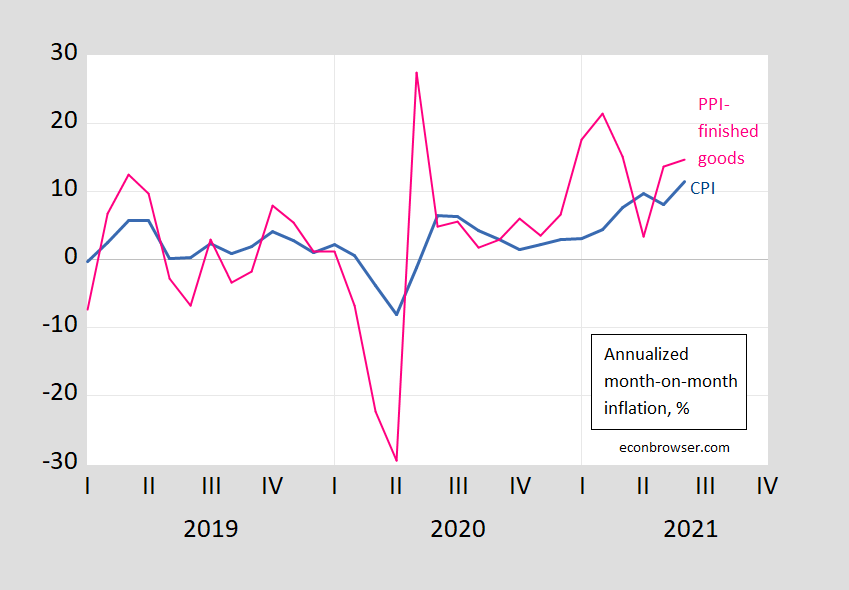
Figure 1: Month-on-month annualized inflation rate for CPI for all urban consumers, goods and services (blue), and for PPI for all finished goods (pink), %. Source: BLS and author’s calculations.
And here is the the core counterpart (note I’ve drawn the Y-axes to be the same scale in both graphs).
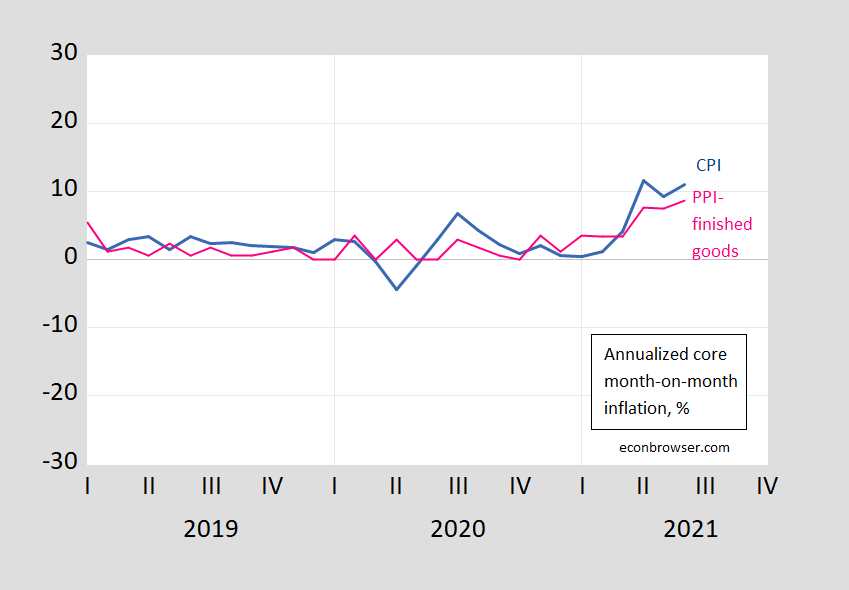
Figure 2: Month-on-month annualized inflation rate for CPI for all urban consumers, goods and services ex-food and energy (blue), and for PPI for all finished goods ex-food and energy (pink), %. Source: BLS and author’s calculations.
Do PPI’s lead CPI’s in the US? Clark (1995) provides a skeptical view that PPI’s provide additional systematic predictive power.
Some analysts project that recent increases in prices of crude and intermediate goods will pass through the production chain and generate higher consumer price inflation. While simple economics suggests such a pass-through effect may occur, more sophisticated reasoning and careful consideration of the construction of the PPI and CPI data suggest any pass-through effect may be weak. Consistent with this more sophisticated analysis, the empirical evidence also shows the production chain only weakly links consumer prices to producer prices. PPI changes sometimes help predict CPI changes but fail to do so systematically. Therefore, the recent increases in some producer price indexes do not in themselves presage higher CPI inflation.
Caporale et al. (2002) uses a more formal multivariate approach to conclude that for G-7 economies, PPI’s do lead CPI’s.
Interestingly, even though the PPI surprised on the upside (while PPI core matched expectations), the 5 year inflation break even declined.
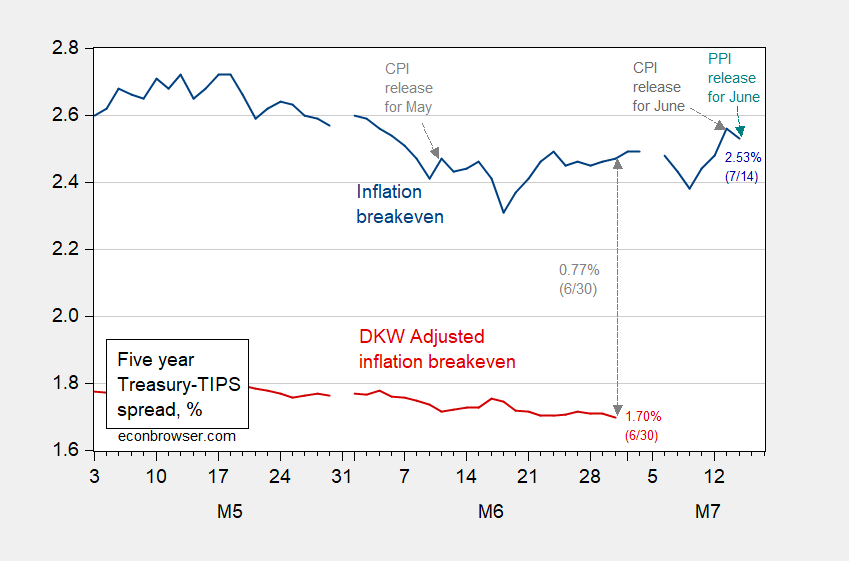
Figure 3: Five year inflation breakeven calculated as five year Treasury yield minus five year TIPS yield (blue), five year breakeven adjusted by inflation risk premium and liquidity premium per DKW, all in %. Source: Fed via FRED, Treasury, KWW following D’amico, Kim and Wei (DKW) accessed 7/7, and author’s calculations.
I thought everyone knew that PPI is a volatile metric. Your graph shows that this almost common knowledge fits recent history. I also thought that the people who wrote for Reuters were smart – maybe not.
Menzie,
Why would you use annualised figures for each month. Unless you get giddy on volatility of figures.
We superior types down under examine the trimmed mean and median series and then compare it to the ordinary series.
Not Trampis: I’m comparing annualized because I typically do that on this blog, so I’m trying to stay consistent, for the sake of readers.
I need all the help I can get [ the awkward man said, as he did a double-dip of his vegetable Quesadilla into the avocado sauce and smiled at the other guests at the party ]
https://fred.stlouisfed.org/graph/?g=Fq3v
January 30, 2018
Producer Commodities Price Index for Finished Goods and Finished Goods less Food & Energy, 2007-2021
https://fred.stlouisfed.org/graph/?g=Fq3G
January 30, 2018
Producer Commodities Price Index for Finished Goods and Finished Goods less Food & Energy, 2017-2021
just to clarify, Menzie; you have labelled your PPI index as “PPI finished goods”, which i’m assuming is an accurate label…
PPI finished goods is a legacy index that was the PPI before the BLS rolled out their PPI final demand indexes, which is two-thirds services, in 2014; the goods component of final demand is called “Final Demand Goods”
that’s different than “PPI finished goods” – this table shows both of them: https://www.bls.gov/news.release/ppi.t01.htm
PPI finished goods is up 9.4% YoY, while Final Demand Goods is up 11.7%
the monthly PPI release cites Final Demand Goods: https://www.bls.gov/news.release/ppi.nr0.htm
the core goods index for CPI is called the “composite price index of all goods less food and energy goods”; i don’t know of a CPI index that’s all goods, but i wouldn’t be surprised..
rjs: Yes, you are right, it’s final demand – finished goods PPI. I didn’t include the PPIACO (FRED mnemonics), which is the current preferred index.