Here is a graph of some key indicators followed by the NBER Business Cycle Dating Committee, including industrial production, which missed expectations (actual -1.3% vs. +0.2% Bloomberg consensus, m/m not annualized):
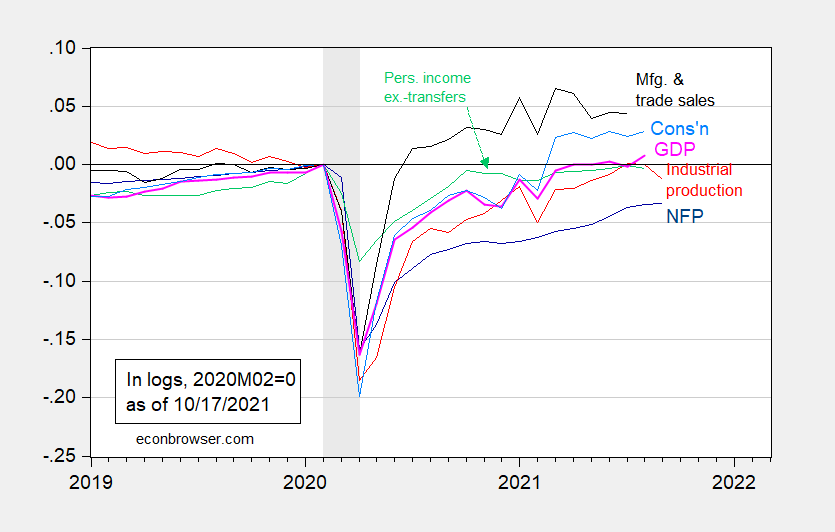
Figure 1: Nonfarm payroll employment from August release (dark blue), industrial production (red), personal income excluding transfers in Ch.2012$ (green), manufacturing and trade sales in Ch.2012$ (black), consumption in Ch.2012$ (light blue), and monthly GDP in Ch.2012$ (pink), all log normalized to 2020M02=0. NBER defined recession dates shaded gray. Source: BLS, Federal Reserve, BEA, via FRED, IHS Markit (nee Macroeconomic Advisers) (10/1/2021 release), NBER, and author’s calculations.
Industrial production was hit partly by after-effects of Hurricane Ida, and also (in manufacturing) by the reductions in auto production.
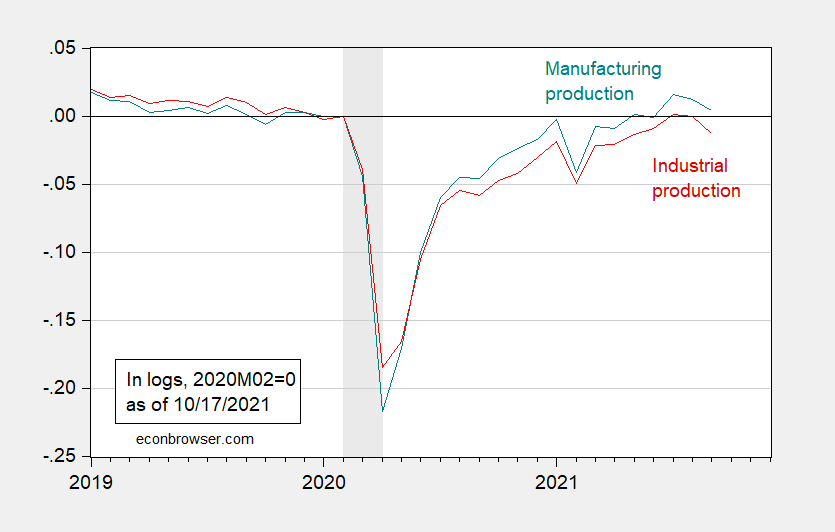
Figure 2: Industrial production (red), and manufacturing production (teal), both in logs, 2020M02=0. NBER defined recession dates shaded gray. Source: Federal Reserve Board via FRED, NBER, and author’s calculations.
Manufacturing also missed expectations, at -0.7% vs. +0.1% m/m not annualized. That’s two consecutive months of declines for both industrial and manufacturing production.
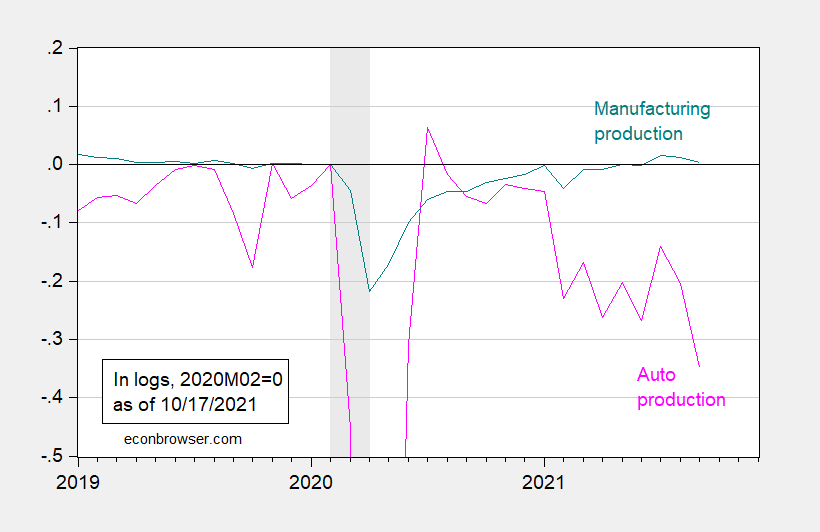
Figure 3: Manufacturing production (teal), and auto and light duty vehicle production (pink), both in logs, 2020M02=0. NBER defined recession dates shaded gray. Source: Federal Reserve Board via FRED, NBER, and author’s calculations.
We are lagging on measures of real manufacturing and trade industry sales (last observation is July). It might be tempting to infer August numbers from some related series, e.g., retail sales ex.-food services.
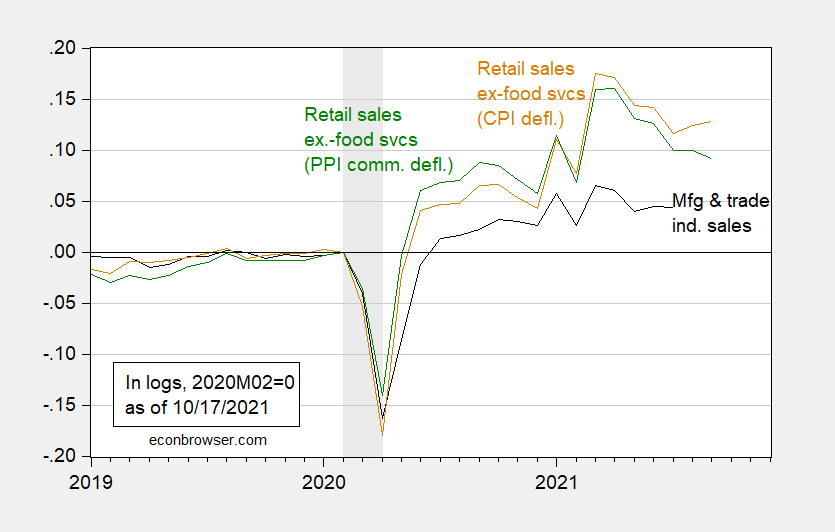
Figure 4: Manufacturing and trade industries sales (black), retail sales ex.-food deflated by CPI-all (tan), deflated by PPI-finished goods (green), all in logs, 2020M02=0. NBER defined recession dates shaded gray. Source: BEA, BLS via FRED, NBER, and author’s calculations.
Clearly the linkage between manufacturing and trade sales and retail sales is loose, so it’s not clear what one can say about the former series.
Summing up, the recovery has clearly slowed down in September.
With total non-farm employment still millions shy of the pre-covid peak, looks like a great many people are forming their own businesses. New business applications are through the roof. Mostly the increase is not in the corporate sector. FRED doesn’t have data on applications for every corner of the economy, but it has retail data and retail is particularly strong. Here’s a chart:
https://fred.stlouisfed.org/graph/?g=HTDf
Furher evidence of what’s going on – gross sales through Etsy went from +32% y/y in Q1 2020 (the collapse quarter) to +142% y/y in Q2 2020, and have gained another 14% since. (I’m not affiliated with Etsy.) The number of sellers on Etsy rose by 28% in 2019, but then by 64% in 2020. And over 80% of sellers on Etsy are women, most of them work from home. I don’t mean to imply that Etsy is the biggest player in shrinking the labor force. Etsy just offers an easy example of what’s going on.
People, female people in particular, have been bailing out of the world of W2 employment, but haven’t necessary stopped working. Bringing them back from the flexible, safe, low-cost world of self-employment isn’t going to be easy.
A running joke my father used to tell, usually with my mother in full earshot “It was a college education that ruined her”
nominal retail sales ex food services were down 1.4% quarter over quarter; i deflated those using appropriate component indexes of the CPI (in contrast to your deflation with the entire CPI) to find that real PCE goods were falling at a 9.1% annual rate over the the third quarter (all the tedious arithmetic to do that has been cross posted at Angry Bear: https://angrybearblog.com/2021/10/retail-sales-up-7-july-and-august-revised-higher )
bottom line: since PCE goods is roughly 23% of GDP, that suggests that real PCE goods will subtract roughly 1.99 percentage points from 3rd quarter GDP
rjs: I also deflated using PPI final goods, per your suggestion in a previous post. How’s that approximate what you did?
Menzie, i can’t translate your PPI adjusted graph into the month over month changes i estimated, but i can see that the most recent month, showing a decrease, would have a different sign…after the revisions to July and August retail sales that came with the September report, i have that real personal consumption of goods was 0.4% (0.385) higher in September, after rising by a revised 0.7% in August, but after falling by a revised 2.4% in July, and rising by 0.4% in June, falling by 2.6% in May, and falling by 0.4% in April, with the last three figures taken from the BEA…
i then get my estimate for the quarter over quarter change in real PCE goods by setting September’s real PCE goods as an index with a value equal to 100, and then give an index value to the prior months based on their change from September (ignoring any fractional compounding, as the impact is negligible)
the math, with the index values for the months of the 3rd and 2nd quarter in reverse order chronologically, looks like this:
1 – (((100 + 99.6 + 98.9) /3 ) / ((101.3 + 100.9 + 103.5)/3)) ^4 = 0.09093
hence, i’m estimating that real PCE goods is down at a 9.1% annual rate
industrial production / manufacturing looks like a seasonal adjustment payback to me….the July manufacturing index increased by 1.4%, largely due to a seasonally adjusted 11.2% increase in the output of motor vehicles and parts, because “a number of vehicle manufacturers canceled their normal July shutdowns because vehicle assemblies had been constrained by a persistent shortage of semiconductors over the prior months”; without the large July seasonal adjustment, i figured actual vehicle assemblies fell by around 20% in July…
here’s the “Seasonal Factors for Domestic Auto and Truck Production” from the Fed:
https://www.federalreserve.gov/releases/G17/mvsf.htm
i had expected a reversal of most of that +11.2% in August, but August took back less than half…so i figure September’s drop to be the rest of it…
what i’m pointing out, i guess, is that for the automotive component of manufacturing, September wasn’t anything special; it’s been in trouble all year…