For students in Econ 435, using model originally in Robert Hall and John Taylor, “Macroeconomics”, and shown in the ADAS handout.
We hear about lots of factors affecting both output and inflation in this Covid impacted period: demand induced overheating, supply shocks, supply chain disruptions, wage based inflation, unanchored expectations. Is there a way to interpret each of these channels, and disentangle the effects? Yes, and no.
Aggregate Demand-Aggregate Supply Diagrammatics
Consider an economy originally at short and medium run equilibrium, in periods 0 and 1.
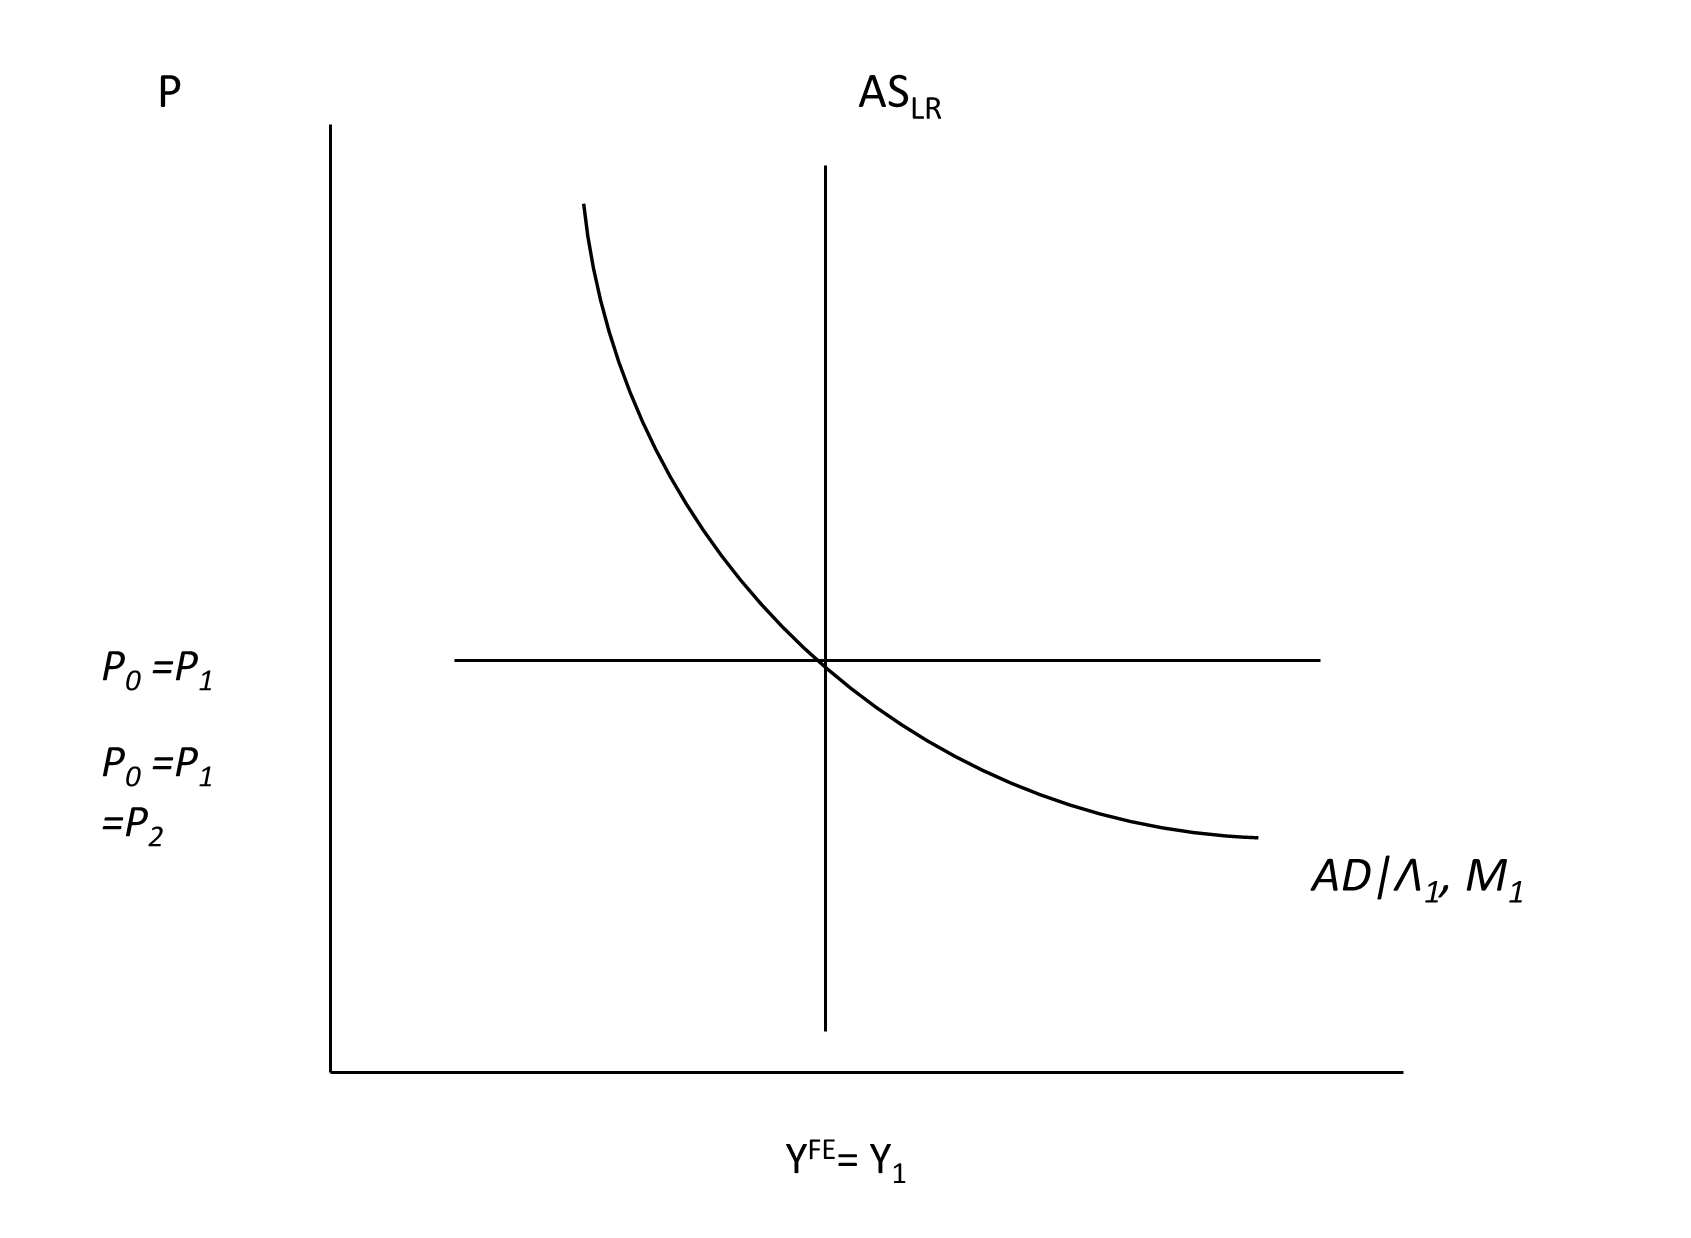
Figure 1: Initial short run and long run equilibrium in AD-AS, with no actual and expected inflation in period 0.
How does one interpret excessive monetary or fiscal stimulus leading to overheating and inflation – what used to be called “demand pull” inflation? That’s an outward shift in the AD curve in period 2 (dark gray arrow). Equilibrium moves as shown by the red arrow. In period 3, with a positive output gap in period 2, the price level rises (gray arrow) as equilibrium moves as shown by the blue arrow.
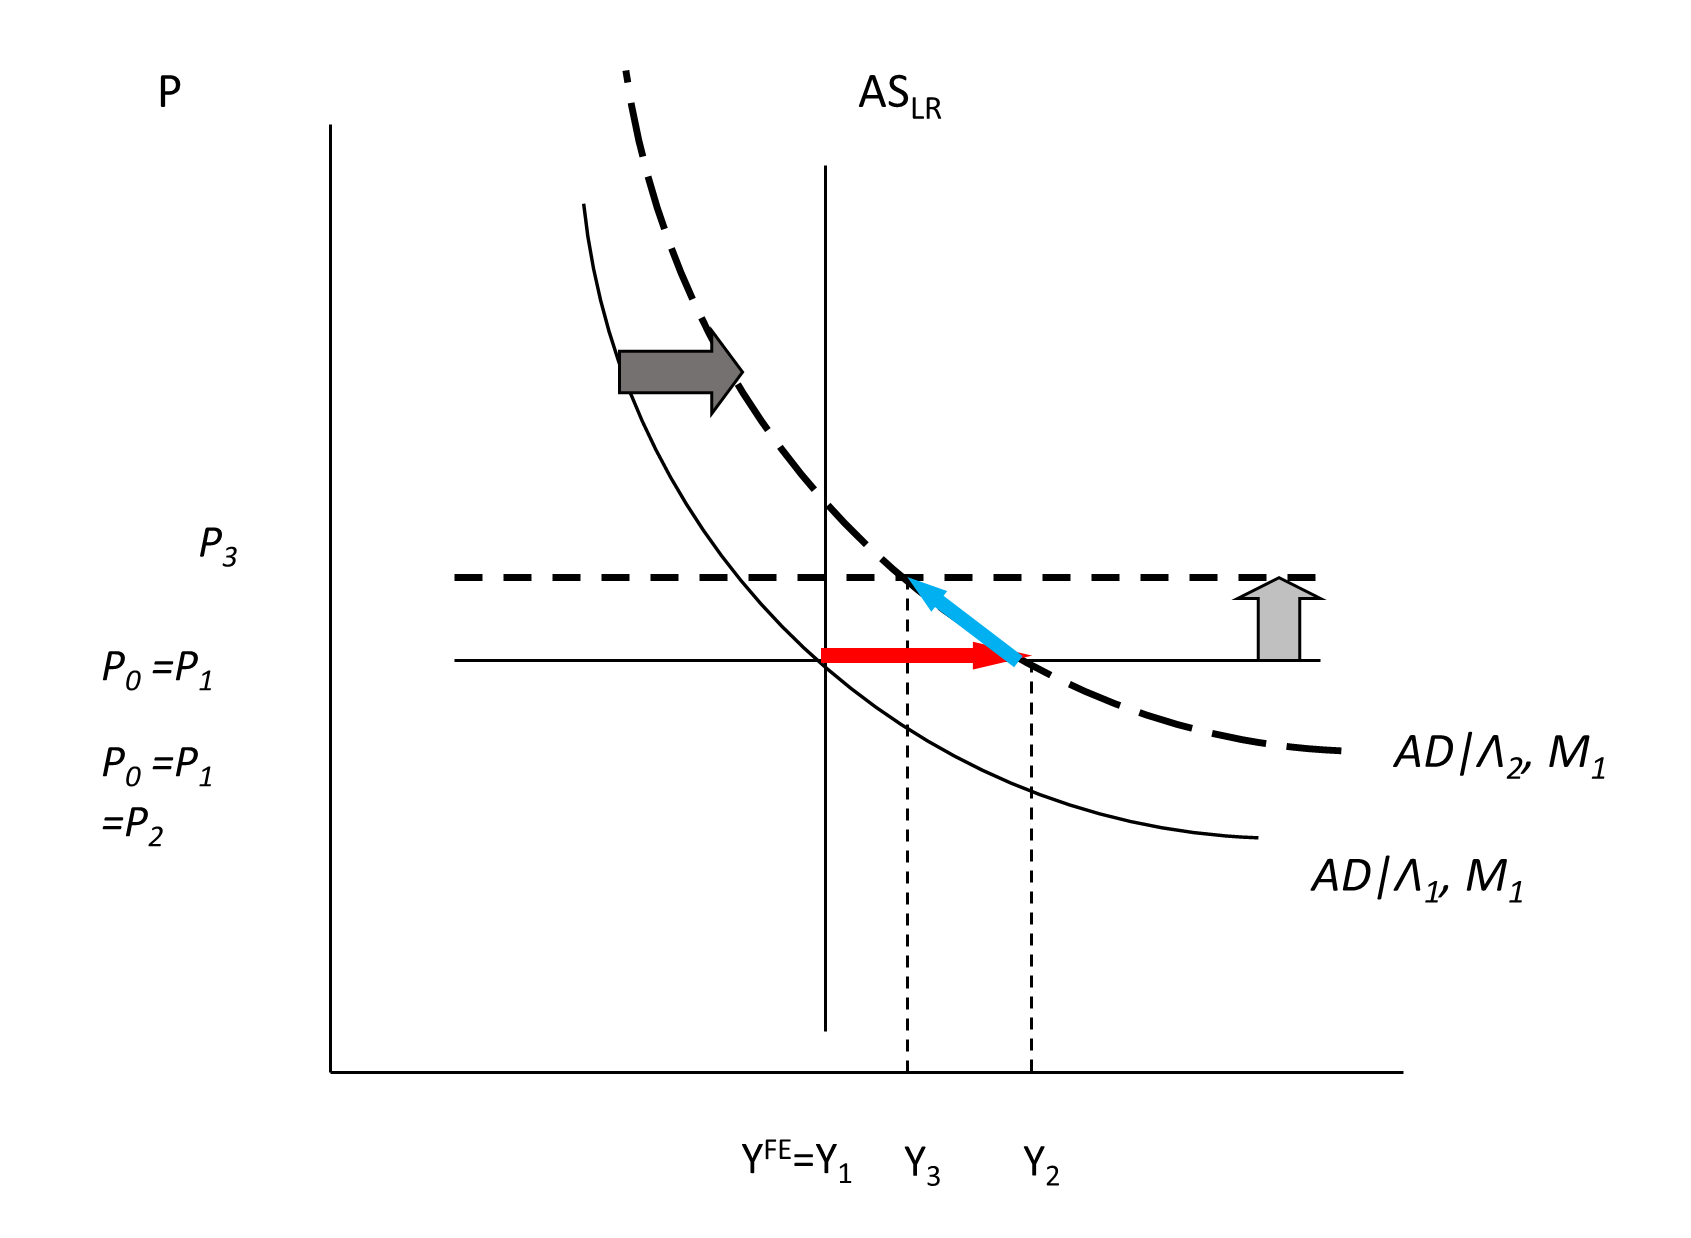
Figure 2: Outward AD shift.
How to interpret a one-time supply shock like temporarily high shipping costs, or disrupted supply chains? That’s an upward shift in the short run supply curve in period 2, resulting in what used to be called a “cost-push” inflation. Output falls, equilibrium moves as shown by the red arrow. In the absence of government intervention, the price level reverts over time.
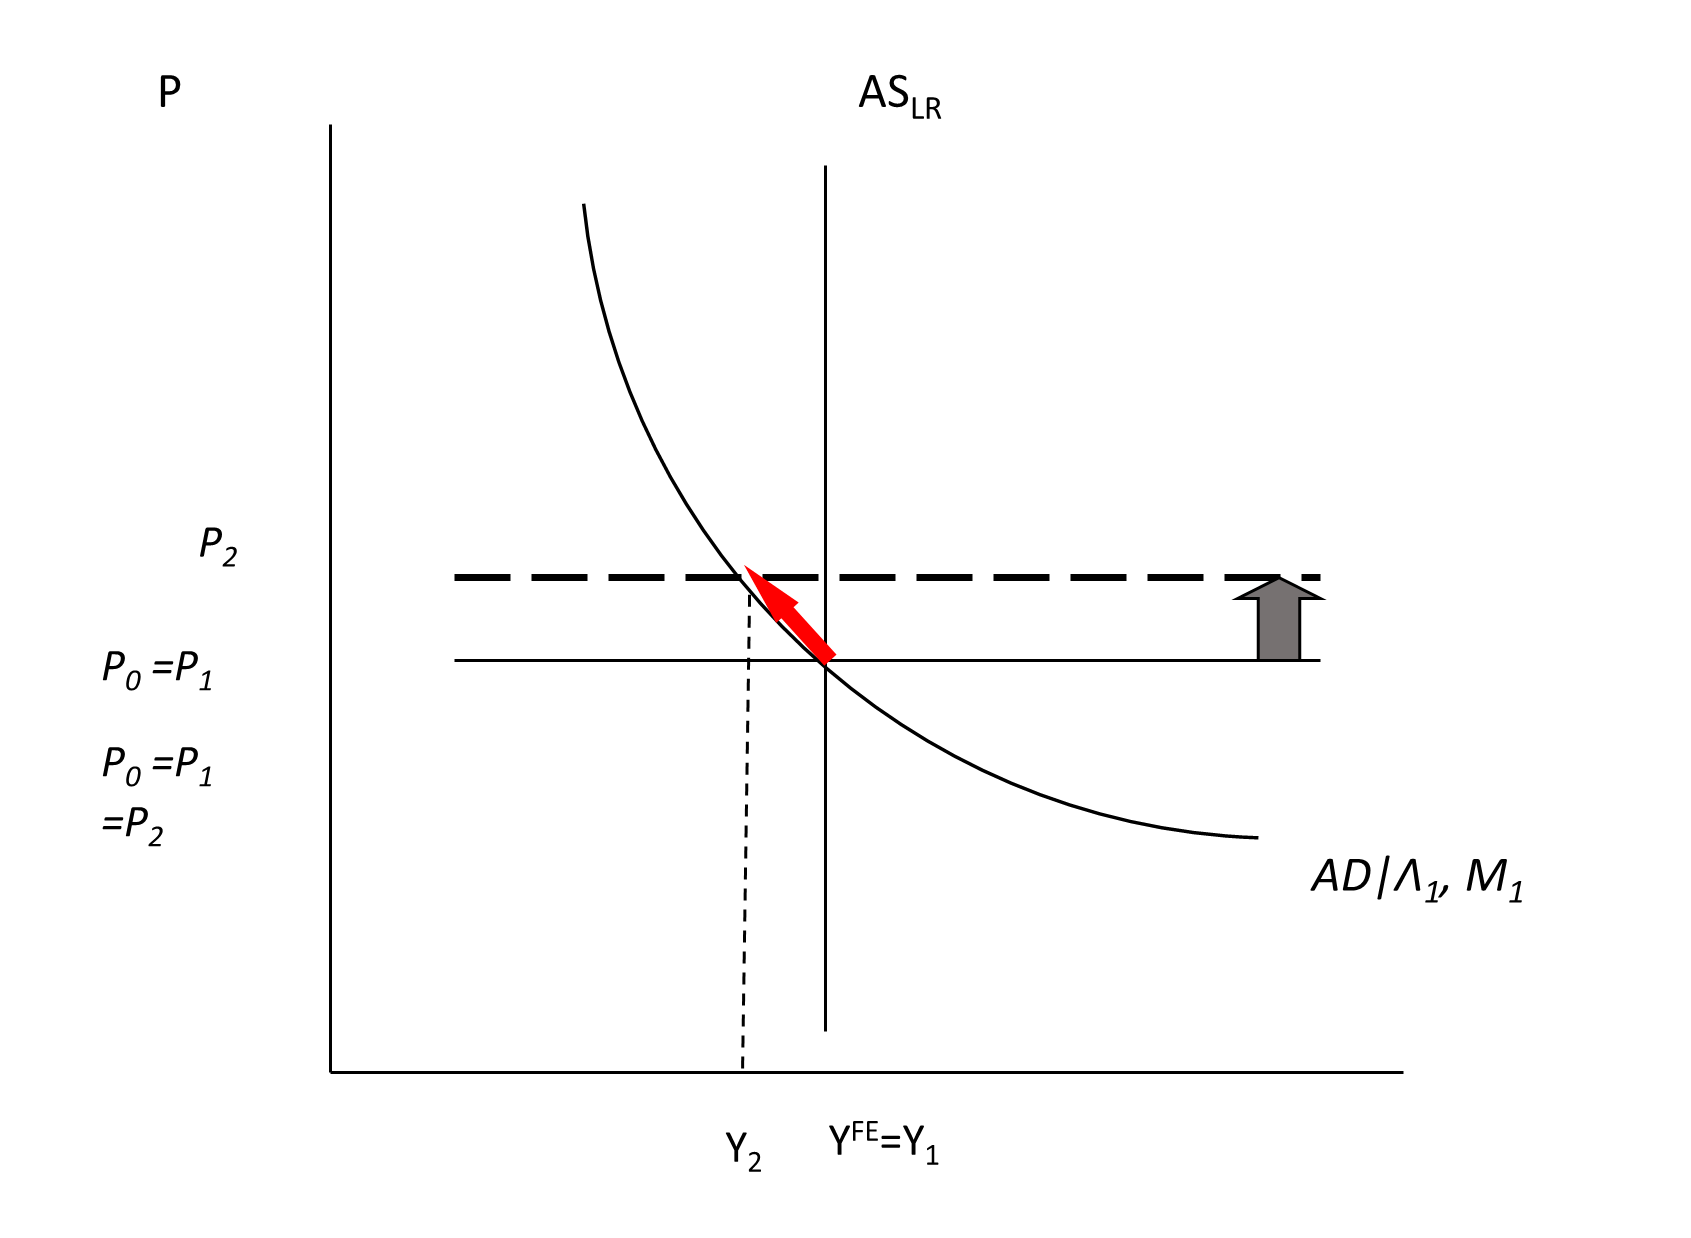
Figure 3: Cost push shock.
How about a longer term reduction in potential GDP, perhaps due to scarring effects of the pandemic (e.g., firms going bankrupt, etc.)? This is what is now often called a “supply shock” (for instance in the Blanchard-Quah identification scheme for structural VARs, supply shocks have permanent effects on output). The long run AS curve shifts in period 2 (dark gray arrow). In period 3, the price level rises in response to the (now) positive output gap in period 2. This then yields the stagflation case, even without dynamics induced by adaptive expectations, as the price level rises and output falls (as shown by the red arrow).
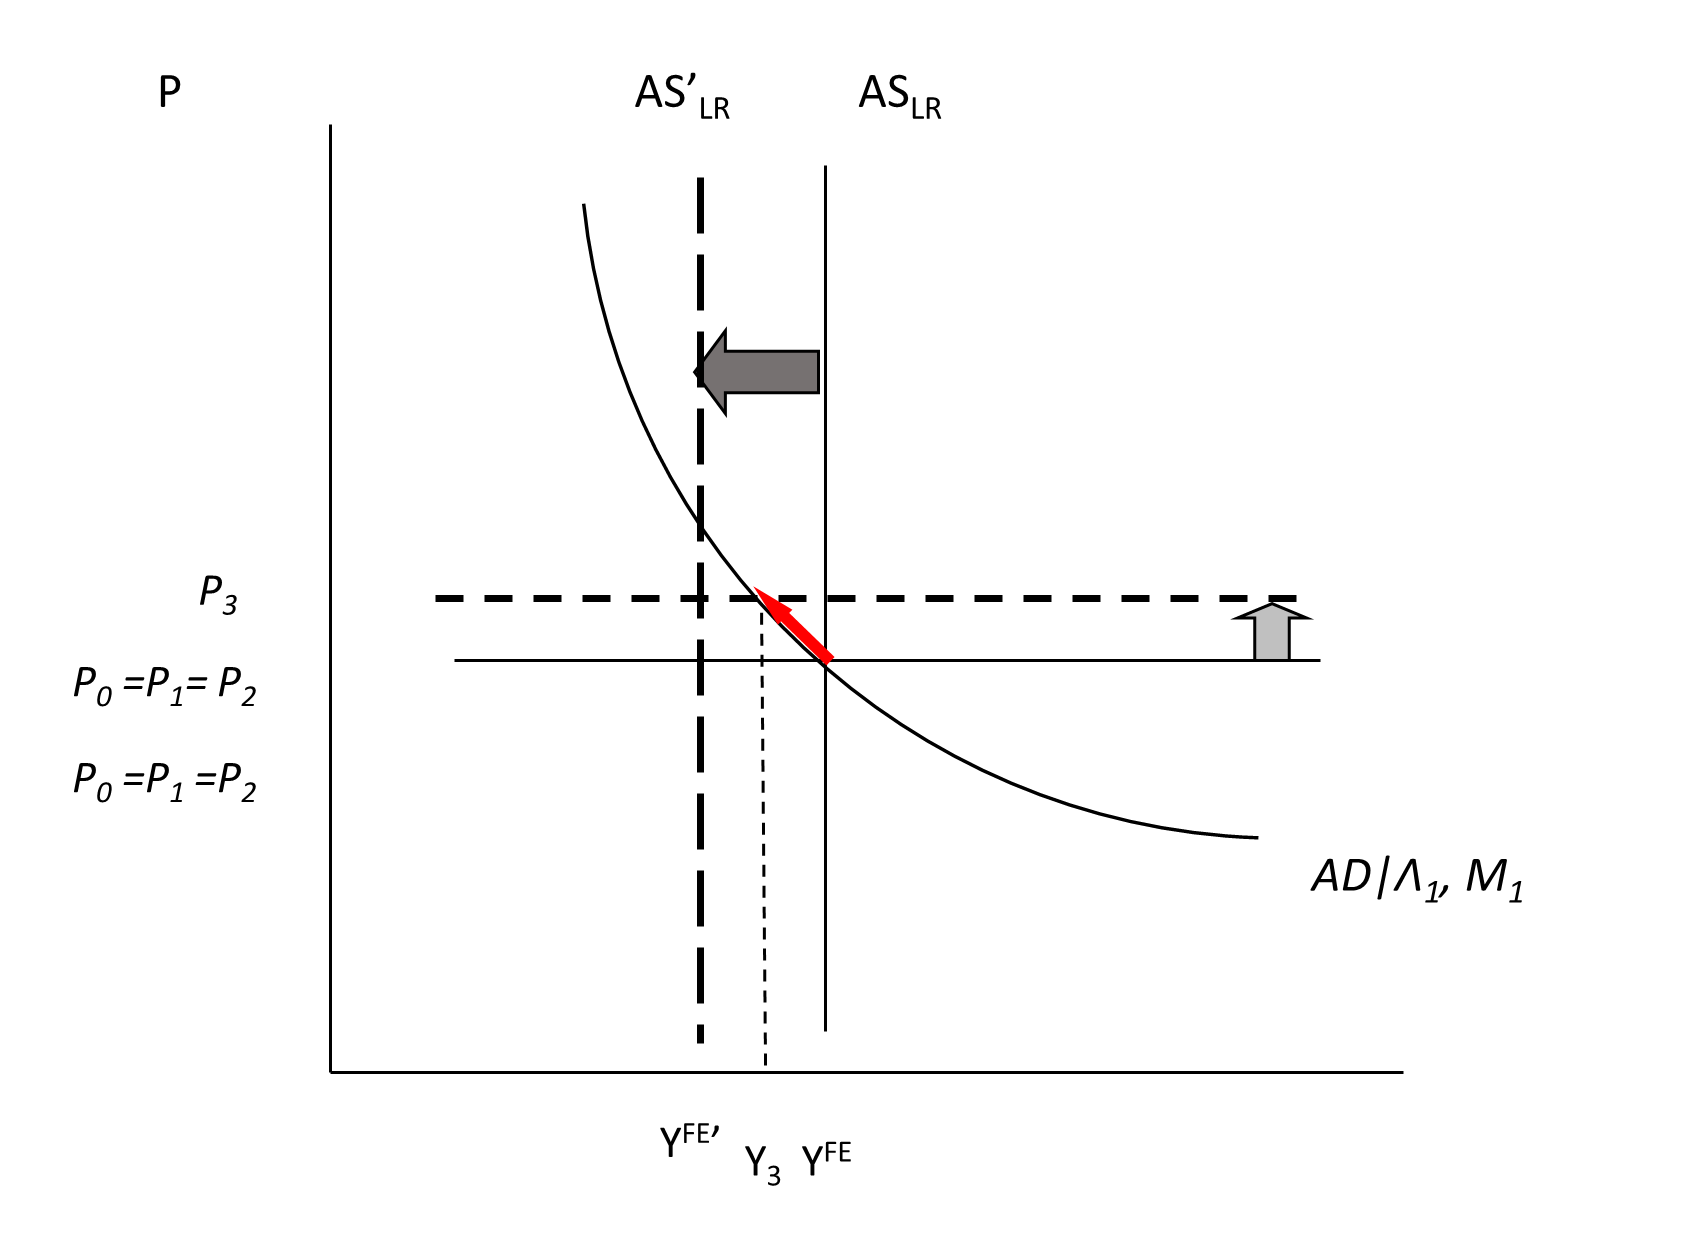
Figure 4: (Permanent) Supply shock.
Interpretation of Recent Events
Which interpretation best fits the data? Well, let’s consider the data:
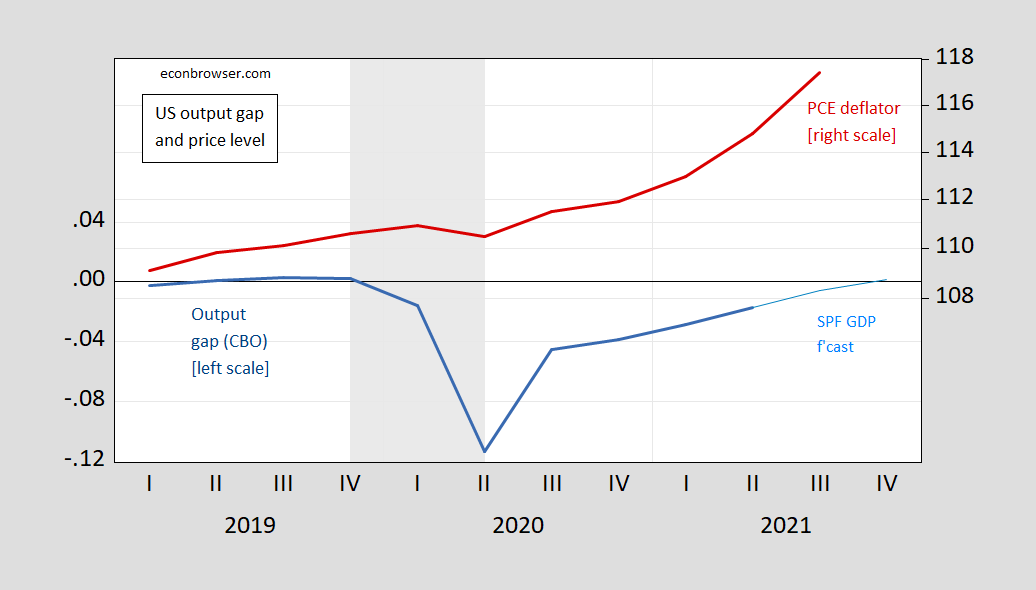
Figure 5: Output gap (blue, left scale), and projected gap using SPF August GDP forecast and CBO estimate of potential (light blue, left scale), and personal consumption expenditure deflator (red, right log scale); Q3 observation based on Cleveland Fed nowcast as of 10/15. NBER defined recession dates shaded gray. Source: BEA, CBO, Survey of Professional Forecasters, NBER and author’s calculations.
The story is complicated by the fact that even with the output gap at essentially zero in 2019, PCE inflation was trending up at about 1.4%. The small price drop in 2020 is then consistent with an inward shift in AD in Q1 and Q2 of 2020, and an inward shift of long run aggregate supply (due to constrained supply coming from public health measures).
Post-recession, acceleration of inflation (shown by the steepening of the log price series) in 2021Q2 and Q3 is then more consistent with a non-demand influence (given the negative output gap in those periods — assuming potential is being accurately measured). Unfortunately, one can’t distinguish clearly between cost-push and permanent supply shocks. The interpretation of supply chain disruptions that are temporary (albeit somewhat persistent) is consistent with cost-push inflation. The interpretation that supply chain disruptions will be permanent (i.e., shipping costs will remain elevated and overseas production problems will continue unabated) means that the inward long run AS shift is the better interpretation.
Note a one-time jump in oil prices implies a one-time upward move in the short run AS curve (unless the shift is so big that it makes a lot of capital stock obsolescent given new relative prices).
Deutsche Bank thinks supply chain problems likely to get worse:
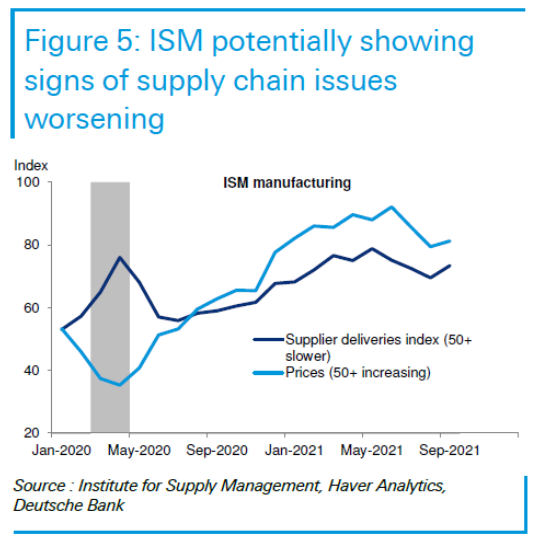
Source: Weidner, et al. “ID’ing the supply and demand forces rocking the economy,” US Economic Perspectives, October 6, 2021.
On the other hand, shipping costs are coming down.
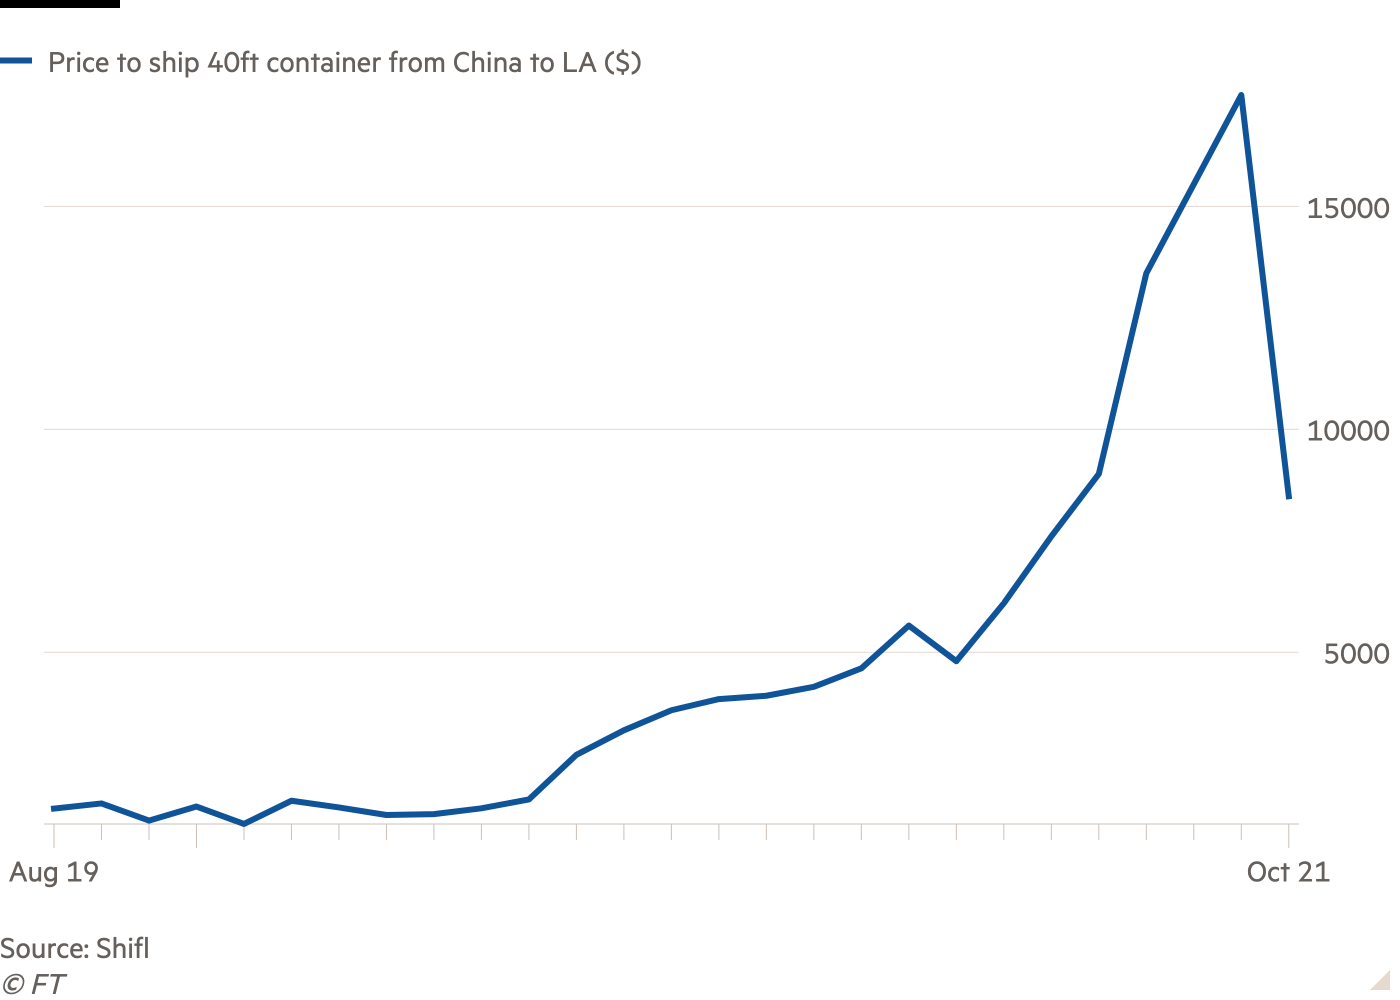
Source: FT, October 7.
But semiconductor chips remain in short supply, hindering production, even if the labor stock and capital stock remain largely untouched. Also, oil prices have risen and stayed high (and natural gas has risen recently, but less so than in Europe).
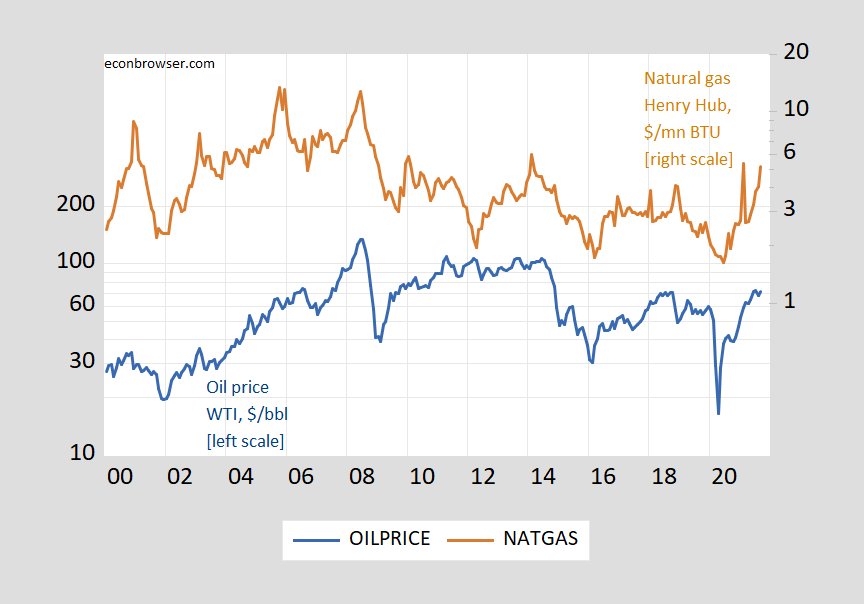
Figure 6: Price of oil, WTI, $/barrel (blue, left log scale), and price of natural gas, Henry Hub, $/mn BTU (brown, right log scale). Source: FRED.
So, no clear message on cost-push shocks.
Expectations Interpreted
How do expectations fit in? If actual lagged inflation feeds into expected one-for-one,
πet = φ πt-1, φ = 1
then the price level (in Figure 3) will continue to rise after the initial shock. Expansionary fiscal or monetary policy then could prevent a rise in unemployment, but at the cost of building in a continuing sequence of rising short run AS curves. If expectations are well-anchored, then the price level will revert to the original level (after incorporating the price level trend). If lagged inflation feeds into expected with less than unit coefficient (φ < 1), reversion still occurs, but takes longer. (A wage-price spiral could also be interpreted in this model as a cost-push shock; higher expected inflation feeds into wage demands, which through a cost-markup equation leads to higher prices.)
I discussed long term expectations developments here, but for examination of whether long term expectations remain anchored, see the IMF WEO‘s Chapter 2.
Addendum: Goldman Sachs tries to distinguish between a short run output gap (where supply bottlenecks constrain aggregate supply) and long run output gap (wherein potential GDP is determined by more conventional determinants like the labor stock). In the GS model, the short run output gap is very positive, while the current LR output gap is about -2%, not too different from the CBO estimated gap.
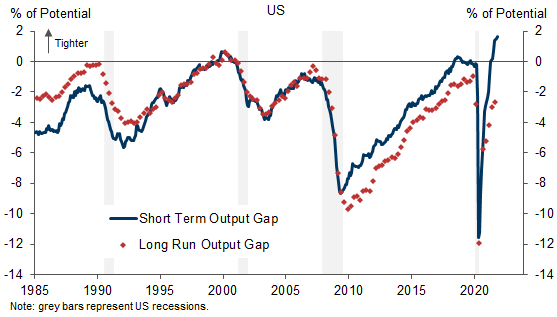
Source: Struyven, et al., “Tight Now, Slack Later,” Global Economic Analyst, Goldman Sachs, October 15, 2021.
Aren’t oil prices determined more by momentum traders creating gamma squeezes by buying calls, then shifting at some time with the herd to shorting?
In other words actual supply changes are independent of price, which is arbitrarily administered then moved in paper, not physical, markets?
《the slopes of demand and supply curves are so hard to estimate that they are essentially unobservable. Introspection seems as good a method as any in trying to estimate them. One major problem is that no matter how many variables we include in an econometric analysis, there always seem to be potentially important variables that we have omitted, possibly because they too are unobservable.》
– Fischer Black, “Noise”
Perhaps short-term price swings are driven by financial trading, but not the average level over time. And gamma trades are not the only trade.
That said, for the purpose of assesing recent swings, noisy prices are a big problem.
Wage demands are economic of course, but in perhaps a new phenomena, also now a political demand for affirmation of the social worth of those performing labor at rates that preclude wealth formation. This is a response to the outrageous wealth accumulations and the accompanying celebrity enjoyed by the new master rentiers and parasitic middle-men wealth skimmers like the food delivery services. This labor class is also seeking wealth through the forms of technology within their grasp to manipulate such as crypto currencies and short term stock trading in the GameStock and other short-sold securities creating crowd-sourced short squeezes. Wage demands represent an insistence on participation and identity recognition in the skewed, rigged and incredibly unbalanced financial outcomes of today’s economy, where the creation of wealth has lost correspondence with efficiency, utility and any measurable output. The conversion of the entire human experience into annuity generating services that perpetuates low-asset holdings among the hosts is one form of class war that will ultimately precipitate another form that dilutes wealth by forcing inflation.
Good news on shipping costs. Now Barkley and I should cease our jumping up and down over how high they had become.
As one who cannot get past the FT paywall, I went Googling for the cost of shipping a 40 foot container from China to LA. One hit told me that the cost = $3500 but it was not dated and perhaps a pre-pandemic link. Now CNBC had this story in early August when these rates past $20,000:
https://www.cnbc.com/2021/08/05/china-us-container-shipping-rates-sail-past-20000-to-a-record.html
Good to know this surge in shipping costs has turned around.
i understand that some of the bigger companies out there were leasing an entire ship in order to control costs of shipping. fascinating.
Among them, Walmart and Amazon
FT quote a guy at Shifl who says the rates could go as low as $5,000 for 40-foot containers from China. It sounds like Chinese exporters are afraid they will get caught holding the bag after trying to get greedy with capacity.
I also think some, not all, of this GVC stuff is just to create fear and panic buying of staples and other goods people “need”.
Another good story on how shipping costs soared but partially retreated:
https://asia.nikkei.com/Spotlight/Caixin/Cost-of-shipping-between-China-and-U.S.-plunges
This update on proposals to insure multinationals pay their fare share in terms of profits taxes has a good news, bad news tale:
https://www.rollcall.com/2021/10/15/global-tax-deal-could-drive-changes-in-democrats-budget-plan/
Good news – the global talks are getting closer to a global minimum tax rate. Bad news – this tax rate will be only 15%.
Good news – the Democrats are still thinking about raising our tax rate and getting rid of loopholes like GILTI and FDII. Bad news – actual discussions of these reforms may be deferred until 2023.
The question might be asked as to the possible effects of international sanctions on prices in non-sanctioned countries. What could be the global oil price effect of sanctions on Venezuela or Iran? I remember a few years ago the Kennedy family running public service notices thanking Venezuela for offering low or no cost heating oil to New England families in winter. I do not know of the Venezuelan supply being replaced. Suppose oil was being generally supplied by Venezuela and Iran at present…
venezuela is in a curious position. their crude oil is not easily sold around the world. not because of sanctions. because of the chemical makeup of the oil. it has physical properties that make it difficult to process. therefore venezuela probably impacts oil prices to a smaller degree than you think.
Real Personal consumption is up about 3% from January 2020. That’s below the pre-pandemic trend. The first impression might be that demand push inflation is unlikely, but the details say otherwise. There has been a sharp upward deviation in trend in the personal consumption of goods. Real PCE goods consumption was 20% higher in March 2021 than in in January 2020 and remained 14% higher in August, the latest month reported. So we have demand push in goods. Real services consumption is down 2% from January 2020.
Goods and services both face supply problems, but to some extent the supply problem for goods is the very high level of demand relative to already existing capacity, never mind Covid-induced bottlenecks. Shifting capacity from supplying services to supplying gods takes time, and confidence that the new mix of consumer demand will persist.
Seems like one source of disinflation will be a shift in demand back toward more services and fewer goods.
i do wondering we are comparing a down year (2020) with a year that is not (depending on what last year was…was it a recession….or a depression).
its been a very long time since there was a quick recovery from a recession
January 2020 was right before the demand collapse. I was aiming at pre-covid demand levels.
PCE goods and services inflation habe both accelerated, but goods inflation by more, as you’d expect:
https://fred.stlouisfed.org/graph/?g=HTuH
http://www.news.cn/english/2021-10/18/c_1310253669.htm
October 18, 2021
Pump price for diesel hits record high in Germany
The recent rise in crude oil prices and the increased demand for heating oil drove German diesel prices to break the record set in 2012, and petrol prices are also approaching a new all-time high.
BERLIN — The price of diesel fuel in Germany broke its previous record set in 2012 as the nationwide daily average price on Sunday climbed to 1.555 euros (1.8 U.S. dollars) per liter, the General German Automobile Club (ADAC) said on Monday.
Petrol prices were also approaching a new all-time high, according to the ADAC, Europe’s largest motoring association. The E10 variety cost 1.667 euro per liter on Sunday, only 4.2 cents short of the old record set in September 2012.
The ADAC noted that the recent rise in crude oil prices and the increased demand for heating oil were driving diesel prices to new records. German drivers also pay an extra seven eurocents per liter in carbon dioxide (CO2) tax.
Germany introduced CO2 pricing in the transport and housing sectors at the beginning of this year. In 2021, the charge is 25 euros per ton of CO2 emitted, which will gradually be raised to 55 euros by 2025.
“The task of the future government is to reconcile mobility and climate protection” to ensure that people with low incomes could also remain mobile, ADAC’s President of Transport Gerhard Hillebrand said in a statement. “The current trend in fuel prices means that costs are already close to what many people can bear.” (1 euro = 1.16 U.S. dollar)
Another question that might be asked is what have been recent price effects of policy measures implemented in a range of countries to deal with climate change.
Shipping costs are said to be $10,000 (global average) to $20,000 (China-USA), or three times the last post-Christmas rate.
Hong Kong was closed for two days due to a typhoon, the second one in a couple of weeks.
Ningbo closed for two weeks in August due to COVID-19.
Add the waiting time, which adds several thousand more dollars per day.
At peak performance (ca. 2005), Hong Kong could turn around a container ship in 8 hours.
This month, the delay just to get unloaded is 1-3 days in China; up to 6 days in Rotterdam; 6-7 days in Savannah; and 7-12 days at Long Beach / LA.
Perish(able) the thought of foodstuff stuck at sea for that long …
“Perish(able) the thought of foodstuff stuck at sea for that long”
I trust they are not shipping strawberries. Grains and soybeans may not be that perishable but then again I never took agricultural economics.
Ningbo closed for two weeks in August…
[ The port is comprised of separate, independent wharfs. A single wharf at Ningbo was closed, while the port in all increased processing through the month. Wharfs through the port are becoming increasingly automated. ]
Regarding oil, reportedly Saudi Arabia in particular has been restraining production as has Russia. This has been playing a major role in the recent upward creep of crude oil prices.
Love this post.
I remember when macro exams asked the student to trace out the geometry of changes in the IS-LM and wage curves and then build up the AD-AS curves. It was a useful way to think about not just shifts in the AD-AS curves, but changes in the slopes of those curves. Of course, that’s when macro exams were done on the old blue booklets.
2slugbaits: Well, you can take it as a sign — we still use those blue books.
Yeah, we do too at JMU, although they seem to have become scarce recently, so poor students having to supply their own paper. So, Slug, probably want to point at something other than how students take tests to indicate the old days when what ever. Maybe you are getting so old yourself you are not quite sure how to wittily indicate The Olden Days… :-).
《with almost all commodities most of the trading action and liquidity tends to happen in the futures market, not the spot market.》
https://www.bloomberg.com/opinion/articles/2021-10-18/the-new-proshares-bitcoin-etf-has-a-unique-set-of-risks
Again, isn’t the quaint old mainstream story about how supply and demand determines price simply ignorant of how actual prices are really formed in paper markets, by labile traders trading on momentum and noise?
Why ignore finance?
Well, rsm, how does “finance” affect supply and demand? Why does “finance” somehow render that “quaint old mainstream story about how supply and demand determines price” irrelevant in the face of “labile traders trading momentum and noise”? Really? “labile traders”? Oooh, if only those traders were not so “labile” good old mainstream supply and demand might still have some say regarding price outcomes in markets.