Today we are fortunate to be able to present a guest contribution written by Rashad Ahmed (Office of the Comptroller of the Currency, US Treasury). The views presented are solely those of the author, and do not necessarily represent the views of the US Treasury, or any other organizations the author is affiliated with.
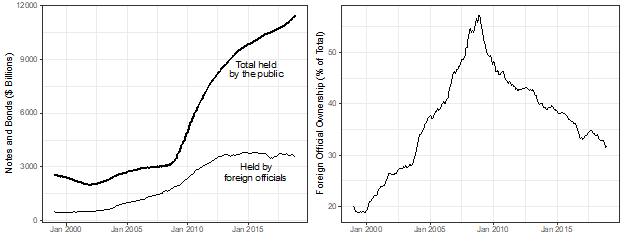
As of December 2020, foreign holdings of US Treasury debt (UST) reached over $7 trillion of which $4.1 trillion was held by foreign official institutions — mostly in the form of Treasury notes and bonds (Figure 1). The growth and concentration of USTs held abroad stimulated an active body of research aimed at understanding the potential impact of foreign demand for USTs on US long term interest rates (See for example, Warnock and Warnock, 2009, Beltran et al., 2013).
Figure 1: Foreign Official Ownership of US Treasury Notes and Bonds
Source: Ahmed (2021). Note: Excludes T-bills and includes notes and bonds held by the Federal Reserve (about $2.1 trillion in 2018). Left panel: Total U.S. Treasury notes and bonds (held by the public), along with Treasury notes and bonds held by foreign official institutions. Right panel: Foreign official ownership of notes and bonds as a percentage of total notes and bonds (held by the public).
However, most studies estimating the impact of foreign official demand for USTs on US yields assume that US yields evolve to reflect domestic conditions, such as Fed’s monetary policy stance, risk premia, and expectations over future domestic GDP growth and inflation, etc. But in an increasingly interconnected world, US yields are likely to reflect global economic conditions too. Moreover, foreign official demand for USTs is shaped by these same global economic conditions because the motives behind central bank accumulation of international reserves tend to be globally cyclical.
In a recent paper (Ahmed, 2021), I revisit the issue of estimating the impact of foreign official demand for USTs on US long term yields, specifically considering the presence of global common factors. Across a variety of econometric specifications measuring long-run and short-run effects, a common theme appears – ignoring the presence of global common factors leads to a substantial understatement of the impact of foreign official demand for USTs on US yields. When global factors are omitted, estimates can be understated by 50% or more. After accounting for global common factors alongside domestic factors, the impact of foreign official UST purchases/sales of $100 billion on 10-year Treasury yields:
- Increases from 19 basis points to 60.5 basis points (long-run flow effect)
- Increases from 13.2 basis points to 27.5 basis points (short-run flow effect)
- Increases from 3 basis points to 5.8 basis points (long-run stock effect)
And most of this impact operates through affecting the term premium.
The underlying reasoning is intuitive: foreign official purchases and sales of USTs are cyclical. Foreign officials tend to accumulate USTs when others are selling safe assets (amid global expansions) and they tend to sell USTs when others are buying safe assets (amid contractions and crises). As a result, downward pressure exerted on US yields by foreign central bank buying of USTs tends to occur when yields are otherwise rising globally, and vice versa. Therefore, its crucial to condition on the level of global yields, reflecting global economic conditions, along with domestic factors.
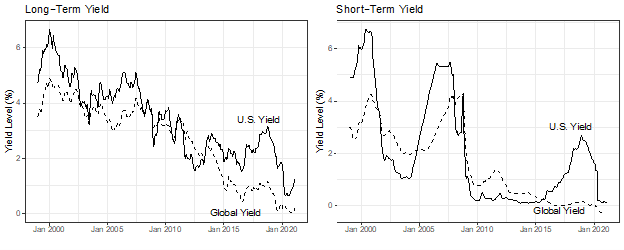
Figure 2: US and Global (non-US) Interest Rates
Source: Ahmed (2021). Note: Solid lines are the U.S. 10-year (left panel) and 3-month (right panel) yields and dashed lines are the global 10-year (left panel) and 3-month (right panel) yield factors. Global yields are constructed as GDP-weighted averages of 19 advanced economy non-U.S. yields
To measure global factors that capture both current and expected fundamentals, I use short-term (3-month) and long-term (10-year) yields from 19 non-US advanced economy sovereign bonds. I then recover short-term and long-term global yield factors, respectively, by computing an GDP-weighted average world yield that excludes the US. Figure 2 shows that both the long-term and short-term global yield factors covary quite tightly with US yields. The secular decline in US 10-year yields over the past two decades is also observed in global yields.
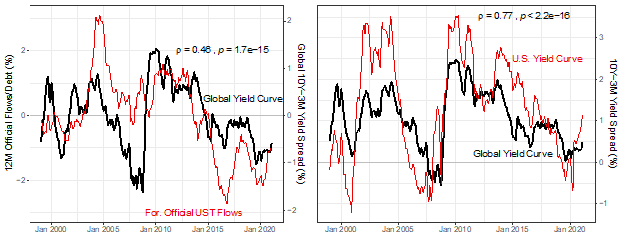
Figure 3: The Global non-U.S. Yield Curve with Foreign Official UST Demand (left) and the U.S. Yield Curve (right)
Source: Ahmed (2021). Note: The thick line is the global 10-year less 3-month yield spread. Global yields are constructed as GDP-weighted averages of non-U.S. yields. Left panel overlays the global yield curve with TIC-reported foreign official UST flows data, and both series are de-meaned. Right panel overlays the global yield curve with the 10-year less 3-month U.S. yield curve, and series are not de-meaned. Foreign official UST flows are calculated as a 12-month rolling sum.
Figure 3 shows that both foreign official demand for USTs (left-panel) and US yields (right-panel) tend to follow global cyclical forces. Specifically, the global yield curve, reflecting the global economic cycle, is measured as the difference between the 10-year and 3-month global yield factors. As the global yield curve steepens amid global expansions, foreign officials tend to accumulate more USTs. At the same time, the U.S. yield curve tends to steepen when the global yield curve steepens.
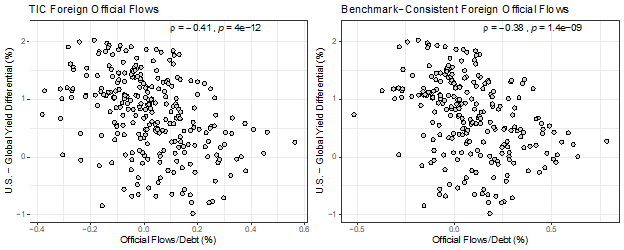
Figure 4: Foreign Official Net UST Purchases and US-Global 10-Year Yield Differentials
Source: Ahmed (2021). Note: X-axes are monthly purchases/sales of UST by foreign officials scaled by 12-month lagged U.S. marketable debt. Y-axes are 10-year U.S. – global yield differentials, where global yields are constructed as GDP-weighted averages of non-U.S. yields. Left panel uses TIC-reported flows data (January 1999 to February 2021) on the x-axis and right panel uses adjusted benchmark-consistent flows on the x-axis following Bertaut and Tryon (2007) and Bertaut and Judson (2014) (January 1999 to December 2018).
While foreign official UST flows and US yield levels are positively correlated (a reflection of endogeneity driven by global factors), Figure 4 shows that the correlation between foreign official UST flows and the US-global 10-year yield differential is negative. This holds when using either raw Treasury International Capital (TIC) flows data (left-panel) or the benchmark-consistent flows data (right-panel). The yield differential is a simple yet perhaps crude way to partial out the component of U.S. yields driven by global factors like world economic conditions and neutral rates. Doing so reveals a theoretically consistent negative relationship between foreign official UST purchases and U.S. yields. The significant negative correlation suggests that foreign official UST purchases (sales) put downward (upward) pressure on U.S. 10Y yields relative to rest-of-the-world 10Y yields.
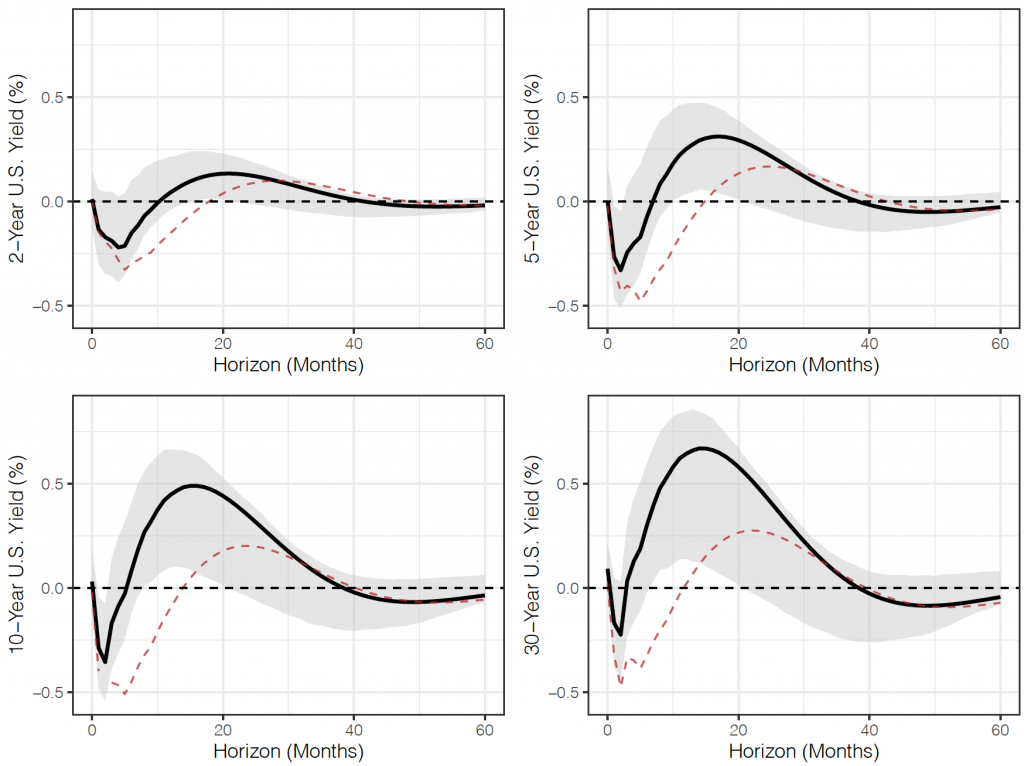
Figure 5: Impulse Response of US Yields over the Federal Funds Rate to a Foreign Official UST Sale (1% of Debt)
Source: Ahmed (2021). Note: Impulse responses from a VAR(4) using benchmark-consistent foreign official flows following Bertaut and Tyrion (2007) and Bertaut and Judson (2014) scaled by U.S. marketable debt lagged 12 months. Shaded region refers to 90% bootstrapped confidence interval based on 1,000 bootstrapped samples. Dashed line reflects impulse response from VAR(4) that excludes global yield factors from the set of contemporaneous controls. Foreign official UST flows are ordered first in identifying structural shocks.
To explore the short-run impact of a sudden sale of USTs by foreign officials, I estimate a structural VAR of the US yield curve augmented with both global and domestic factors as conditioning variables. Figure 5 traces the impulse response of US yields across different maturities to a foreign official sale of USTs the size of 1% of marketable Treasury debt outstanding. Short-term yields are insensitive to foreign official UST demand, but longer-term yields respond significantly within several months following the UST sale. 10-year yields increase by 50 basis points, which can be translated to a 27.5 basis point impact per $100 billion foreign official purchase/sale.
For comparison, the dashed red line in Figure 5 represents the same impulse response from a VAR that does not condition on global factors and only conditions on domestic factors. The estimated impact is substantially smaller (13.2 basis points per $100 billion) when global factors are omitted. In addition, the counter-intuitive negative initial dip in yields following a UST sale is further exaggerated when excluding global factors. This points toward omitted variable bias which the global factors partially correct for, as US yields tend to fall during global economic downturns, precisely when foreign officials tend to sell USTs.
A key implication of these findings is that prevailing estimates of impact of foreign official UST demand on US interest rates may be substantially understated since they do not account for global confounding factors. As such, relying on previous estimates may underestimate the financial stability risks associated with large, unexpected, and acyclical foreign purchases or liquidations of US Treasuries of the black-swan type. In Ahmed (2021), these issues are explored further, presenting long-run and short-run estimates from various econometric specifications. I explicitly deal with the simultaneity between foreign UST flows and US yields and the presence of global common factors jointly, and I also find that US yields are particularly sensitive to foreign official demand linked to China’s exchange rate policies.
References
Ahmed, Rashad (2021). Foreign Official Demand for U.S. Debt and U.S. Interest Rates: Accounting for Global Common Factors. Available at SSRN: https://ssrn.com/abstract=3906199.
Beltran, D. O., M. Kretchmer, J. Marquez, and C. P. Thomas (2013). Foreign holdings of U.S. treasuries and U.S. treasury yields. Journal of International Money and Finance 32, 1120–1143.
Bertaut, C. C. and R. Judson (2014). Estimating U.S. cross-border securities positions: New data and new methods. FRB International Finance Discussion Paper (1113).
Bertaut, C. C. and R. W. Tryon (2007). Monthly estimates of U.S. cross-border securities positions. FRB International Finance Discussion Paper (910).
Warnock, F. E. and V. C. Warnock (2009). International capital flows and U.S. interest rates. Journal of International Money and Finance 28, 903–919.
This post written by Rashad Ahmed.
Virginia did join the Confederacy 160 year ago. It looks like Glenn Youngkin wants to his state back to those days:
https://www.rollingstone.com/politics/politics-news/glenn-youngkin-rally-pledge-of-allegiance-insurrection-1241919/
Tangentially, on topic. According to this week’s [11 Oct 2021] Barron’s, The Fed holds $7.9 trillion in US securities bought outright.
You need to rely on Barron’s? The Federal Reserve updates its balance sheet on a weekly basis:
https://www.federalreserve.gov/releases/h41/current/h41.htm#h41tab1a
BTW – that $7.9 trillion consisted of $2.5 trillion in mortgage back securities and only $5.4 trillion in US government securities. If Barron’s told you the FED held almost $8 trillion in government bonds, they lied to you. And you fell for it.
Nice piece.
Ahmed notes: “Foreign officials tend to accumulate USTs when others are selling safe assets (amid global expansions) and they tend to sell USTs when others are buying safe assets (amid contractions and crises).”
This leads to a discussion of the cyclical nature of the effect of foreign official buying (selling) on U.S. rates. What that makes obvious, but Ahmed does not explicitly mention, is that foreign official behavior has a moderating effect on interest-rate volatility. There are good and bad effects from lower volatility, but it is an important side-effect of official buying.
It is also interesting that Ahmed finds flow effects of foreign official buying to be much larger than the stock effect. I don’t know what the view at the Fed is now, but under Bernanke, the assumption was that stock effects were larger. In that view, tapering asset purchases would leave most stimulus in place because the stock effect was large and increasing while the flow effect was small, so the decrease wasn’t a big deal. Lots of market folk thought that was wrong, but they were making money on transactions so may have been biased. If flow effects are large, removal of stimulus is larger during tapering than Bernanke and friends thought.
Ahmed notes that short-end rates are not sensitive to foreign purchases, but long-end rates are. A simple explanation is that the Fed anchors short rates, but there may be a second factor at work. Foreign official accounts buy out the curve – sevens are oddly popular. I don’t know what interest rate measure Ahmed is using (I’m lazy), but if he has not accounted for duration, there may be more impact on long-end rates than the 94 basis points he has found.
Oops. Looks like he’s using ten, year rates.
This discussion makes me think of many things. Including how Republican snake oil salesmen, during any Democrat WH administration, run around telling all the southern village idiots that China might dump UST at any moment. I wonder why the village idiots and Stephen Moore types think China keeps purchasing them no matter how low the rates get?? Assumably because Beijing bureaucrats all love donald trump??
Great post BTW.