I’m teaching unconventional monetary policy in Financial Systems course. Here’s some interesting graphs (not altogether new), relating to forward guidance effectiveness.
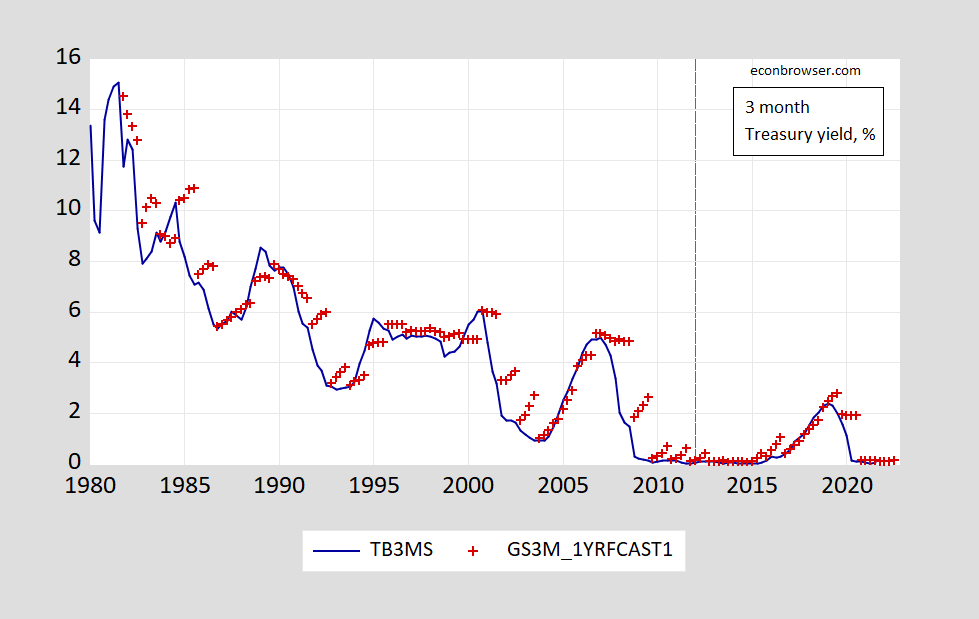
Figure 1: Three month Treasury yield (blue), and Survey of Professional Forecasters average forecasts as of Q3 survey (red +). Three month yield is from secondary market. Blue dashed line implementation of forward guidance on Fed funds rate. Source: FRED, Philadelphia Fed SPF.
Since the forecasts pertain to the short rate, here the forecasters are essentially predicting Fed behavior. Notice that after announcing explicit forward guidance (January 25, 2012), expectations of future short rates declined.
In the most recent episode, the response of expectations has been more definitive.

Figure 2: Three month Treasury yield (blue), and Survey of Professional Forecasters average forecasts as of Q3 survey (red +), as of Q1 survey (teal +). Three month yield is from secondary market. Blue dashed line implementation of forward guidance on Fed funds rate. Source: FRED, Philadelphia Fed SPF.
Notice that the 2020Q2 forecasted interest rate (as of 2020Q1) seems inordinately high; but the survey for Q1 was made in the last week of January/first week of February – much before news of Covid-19 had made much impact in the US (and much before the lockdown in mid-March 2020).
As of Q3 forecasts (made in late July/early August), expectations were for an extended period of near-zero rates.
Having a hard time seeing what you are saying. Labeling, maybe?
I assume one of the main points is how the virus very quickly (sometimes in an almost “immediate” fashion) changes both Fed Res and professional forecasters’ outlook.
You know it’s easy for me to say this after the fact. I’ll concede that point from the get go. But was it really that hard to believe that after many scientists had warned us that in nations/geographic regions where the vaccine jabs have not got above say 33% of the population (my own semi-arbitrarily chosen number there) that it would be rife with mutations and variants that would eventually make their way to the USA, that the prediction of higher inflation and higher rates was rather asinine—-maybe short of someone saying oil would hit $100+ before January 2022, but still, nonetheless asinine??
The only other “take away” I would have here, is that it’s probably easier to predict rates when they are already near the ZLB during a time where atypical conditions bring about lower worldwide demand.
Interest rates bottom out at progressively lower lows [and top up at lower highs] during monetary policy easing cycles.
The 1980’s and 2010’s are ‘horses of different colors.’ And, 2020 – 2021 are off the charts due to the pandemic.
The blue line in the first graph is a fine depiction of the impetus for the 40-year bull bond market; and recent 12 years, with the exception of 2018 and 2019, of unprecedented monetary policy ease – near-zero short rates and QE asset purchases [suppressing long rates].
Keep in mind Humphrey/Hawkins full employment and stable prices are the Fed mandates.
In 2017, the US inflation rate had risen to 3% and unemployment dropped [How could that happen!] to 4.4%. After seven, o.25% rate rises in 2017 and 2018, unemployment had declined to 3.9%, and further 3.5% in January 2020. Then, the pandemic just happened.
Thank God I don’t earn my living predicting rates or equities prices. I invest in PowerBall.
Are you a master chef when it comes to word salad? Try actually writing a coherent comment – assuming you have the mental capacity to do so.
Are you an English prof?
So, I present facts in order to experience you genius’ childish replies.
Q.E.D.
I can stop now. You never fail to disappoint.
I hope you teach English, piglet.
It’s Biblical. It’s like throwing pearls before swine who trample them in the muck.
Troll alert!
Forward guidance is certainly unconventional and opinion is mixed about how effective it really is. The Fed has typically used hard guidance to manage expectations of future monetary policy. Meanwhile the Bank of England under Andrew Bailey seems to have lost faith in hard guidance and is moving to soften its pronouncements. The Reserve Bank of Australia stunned domestic forecasters by providing guidance out to 2024 – drawing a very long bow in uncertain times. Every central bank has its own take on this so there is little uniformity of approach. Studies to date appear inconclusive. A paper by Kool and Thornton “How Effective Is Central Bank Forward Guidance” Fred Review, 4th Qtr 2015, 97(4), PP. 303-22 found “some evidence that forward guidance improved market participants’ ability to forecast short-term rates over relatively short forecast horizons for New Zealand, Norway and Sweden but not the United States. However, the effects are typically small and frequently not statistically significant.” Make of that what you will. A more recent study by Janson and Jia, “Forward Guidance during the Pandemic: Has It Changed the Public’s Expectations”, Economic Commentary, Federal Reserve Bank of Cleveland, Dec 1, 2020, is mildly positive but with a number of limitations.
Nonetheless, it is plausible that forward guidance yields positive results on output, employment and investment by promoting a more certain environment. Then again guidance is itself just prediction. I may say I will do x at time t but prevailing circumstance forces me to do y instead. Will that failure simply create more uncertainty going forward? What if my prediction feeds into an over-reaction that confounds the initial prediction? Many questions on this intriguing topic – I defer to Menzie at this point.