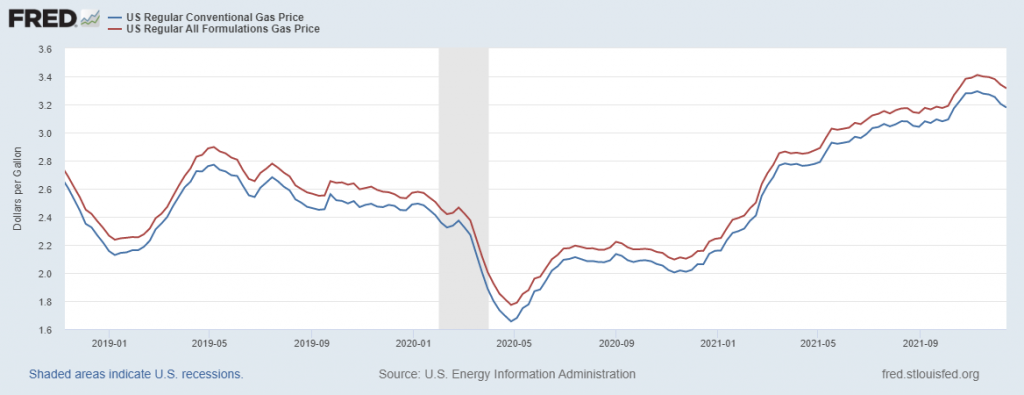
Are declining as of the beginning of this week:
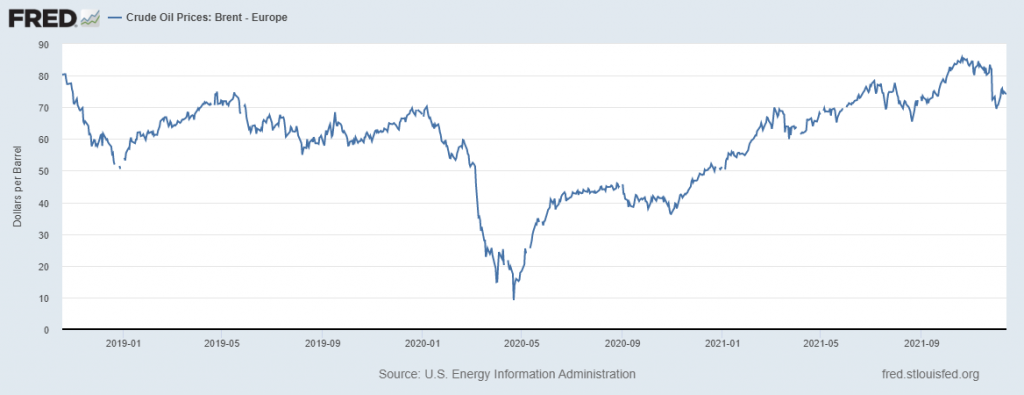
For reference, here is the price of Brent:
Jim Hamilton’s rule of thumb from back in 2013 is 2.5 cents for every dollar in change in Brent.
Front month Brent (February) is 74.6 $/bbl; June 2022 is 73.4 $/bbl.


So oil will end up near $80 per barrel and not Princeton Steve’s $100 forecast. James Hamilton goes a bit further saying gasoline prices = 0.025% (oil price) + combined cost of refinery margin, distribution margin, and excise taxes with that combined cost likely being near $1 (figures vary by state). So hey Uncle Moses will be paying $3 a gallon (or likely less if he is still in Oklahoma). Yep – that $4 forecast seems very unlikely even given an rsm confidence interval.
Menzie,
I am having trouble reading the horizontal axis of the figure. So when exactly did retail gasoline prices actually start declining, as I was the first here to forecast they would?
Biden admin, now, urging more US production.
https://www.argusmedia.com/en/news/2283072-us-urges-domestic-oil-producers-to-raise-output
Misleading. Current price is not going to raise production.
Price has been sufficient in the near past.
https://twitter.com/RobertClarke_WM/status/1453017667137323010 (activity versus price, nominal but little inflation over the period).
See also
EIA WTI price: https://www.eia.gov/dnav/pet/hist/LeafHandler.ashx?n=pet&s=rwtc&f=a
EIA production: https://www.eia.gov/dnav/pet/hist/LeafHandler.ashx?n=pet&s=rwtc&f=a
2019 avg price: $57
2019 avg production: 12.3 MM bopd (higher than current, and grew during the year at 1.0 MM bopd/yr, entrance to exit)
Why am I paying 12-15% more than the graph? What possible reason do you have for not including standard errors? Would error bars stop you from making all these claims about noise?
rsm,
There are long established and well known variations in gasoline prices across the country. Whatever the standard errors are, they do not change much (you still have not answered Menzie’s question about variance of standard errors, so you reslly should just STFU on this). Yet again, irrelevant and stupid, not to mention boring.
New post up with the standard errors – you are 100% correct!
Standard errors? Try regional differences in state taxes. Dr. Hamilton has presented some very informative discussions which of course you did not bother to read.
Least expensive gas in my community’ in the Sierra foothills this morning is (according to Gas Buddy) $4.49. Taxes account for about $1.18 of that.
Better news: skiers are flocking to the mountains in their vehicles burning that expensive fuel. One resort is reporting about 5 feet of new snow with another 2+ feet expected early next week. With more to come after that.
Reservoirs still low, but we’ve had almost as much precipitation here as we had all of last year.
$2.71 here yesterday (Friday afternoon) . You have my sympathies Sir. (zero sarcasm)
1. There is a lot of geographic price variability, based on taxes, and formulation requirements (e.g. anti-smog). This has been extensively written about in the academic literature, in popular articles. And is easily seen by surveys from GasBuddy and the like. Should be so commonly known that you don’t ask such a question with surprise.
2. Simpler looking chart for readers? Less work to prepare? Difficult to assign a standard error to an exhaustive survey-based time series? (In any case, why ask the question like that–“what possible reason”?).
3. I doubt it. I think there is “noise” in the sense of volatility, in the sense of different factors affecting the time series, or even speculation driving some chatter. As for instance, with a stock chart. But in a stock chart, you don’t have sampling error (as with say a political poll or market survey). I think with pricing surveys, you’re likely to have pretty low IID sampling type errors (after all there’s market efficiency reasons for prices to be similar, at least by locale, and given diffs, even moving relatively consistently over different locales). This doesn’t mean no chatter in the trends, but that the source is not sampling error.
Re 3, if you’re really worried about sampling error, you could just cite NYMEX RBOB time series instead. And that really is like a stock chart, no sampling error issues.
https://www.cmegroup.com/markets/energy/refined-products/rbob-gasoline.contractSpecs.html
rsm: See new post, https://econbrowser.com/archives/2021/12/gasoline-prices-now-and-standard-errors .
rsm,
Every time I fly from Florida to California, I notice that the price of gas is about a dollar more per gallon.
A big part of it is taxes, but not all. As it turns out, there is a supply and demand component to pricing, too.
Who woulda thunk it?
https://www.nytimes.com/2021/12/16/opinion/inflation-economy-2021.html
December 16, 2021
The Year of Inflation Infamy
By Paul Krugman
I will always associate inflation with the taste of Hamburger Helper.
In the summer of 1973 I shared an apartment with several other college students; we didn’t have much money, and the cost of living was soaring. By 1974 the overall inflation rate would hit 12 percent, and some goods had already seen big price increases. Ground beef, in particular, was 49 percent more expensive in August 1973 than it had been two years earlier. So we tried to stretch it.
Beyond the dismay I felt about being unable to afford unadulterated burgers was the anxiety, the sense that things were out of control. Even though the incomes of most people were rising faster than inflation, Americans were unnerved by the way a dollar seemed to buy less with each passing week. That feeling may be one reason many Americans now seem so downbeat about a booming economy.
The inflation surge of the 1970s was the fourth time after World War II that inflation had topped 5 percent at an annual rate. There would be smaller surges in 1991 and 2008, and a surge that fell just short of 5 percent in 2010-11.
Now we’re experiencing another episode, the highest inflation in almost 40 years. The Consumer Price Index in November was 6.8 percent higher than it had been a year earlier. Much of this rise was due to huge price increases in a few sectors: Gasoline prices were up 58 percent, used cars and hotel rooms up 31 percent and 26 percent respectively and, yes, meat prices up 16 percent. But some (though not all) analysts believe that inflation is starting to spread more widely through the economy.
The current bout of inflation came on suddenly. Early this year inflation was still low; as recently as March members of the Fed’s Open Market Committee, which sets monetary policy, expected their preferred price measure (which usually runs a bit below the Consumer Price Index) to rise only 2.4 percent this year. Even once the inflation numbers shot up, many economists — myself included — argued that the surge was likely to prove transitory. But at the very least it’s now clear that “transitory” inflation will last longer than most of us on that team expected. And on Wednesday the Fed moved to tighten monetary policy, reducing its bond purchases and indicating that it expects to raise interest rates at least modestly next year.
Inflation is an emotional subject….
http://www.news.cn/english/2021-12/03/c_1310349895.htm
December 3, 2021
China to cut gasoline, diesel retail prices
BEIJING — China will cut the retail prices of gasoline and diesel starting Saturday, the country’s top economic planner said Friday….