Per Capita GDP Doing Just Fine, Linearly, since 1947

If you don’t believe me, take a look at this time series plot of available US GDP per capita.

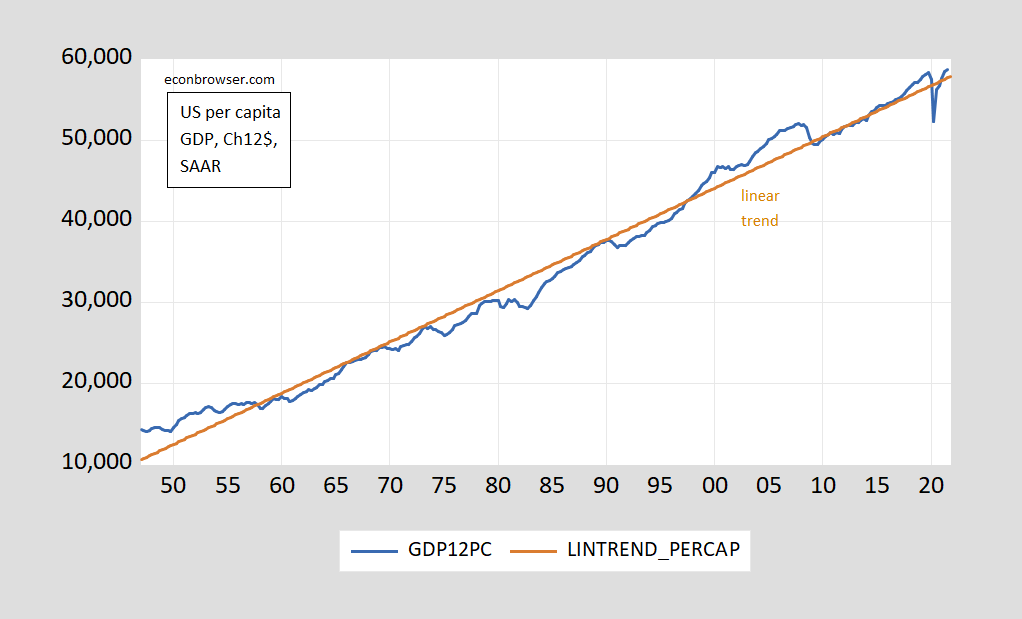
Figure 1: GDP per capita, in Ch.2012$ SAAR (blue); Linear trend (brown). Source: BEA via FRED, and author’s calculations.


Linear regression yields t-stat on time trend of about 60 using robust standard errors. GDP per capita is rising about 40 Ch2012$ per quarter.

Or, one might think to plot on a log scale.

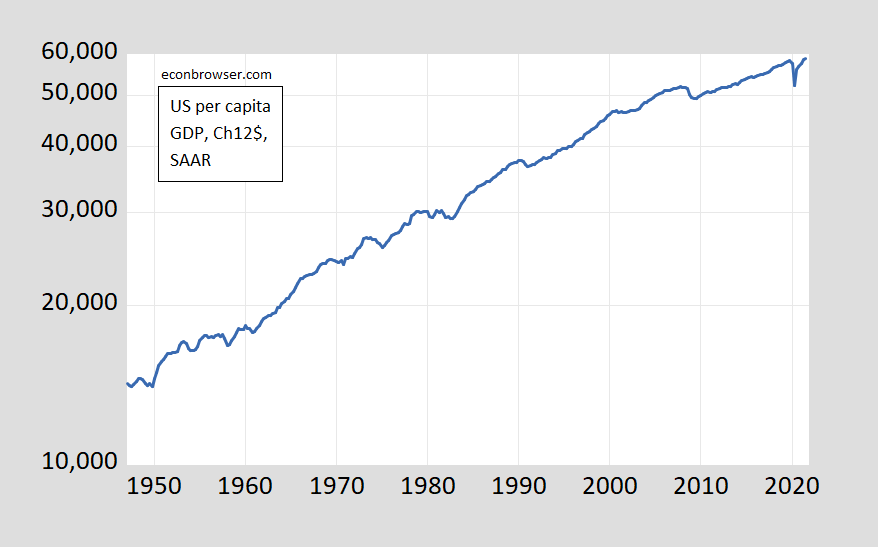
Figure 2: GDP per capita, in Ch.2012$ SAAR (blue, on log scale). Source: BEA via FRED, and author’s calculations.

Which one is misleading? One reader thinks:

In general, log scales are to be avoided for all but professional audiences, notably when exponential growth rates are involved. I would almost never use one in a commercial setting or for a general audience, because they are so easy to misinterpret. I strongly prefer simple linear scales when possible.

Well, I think one could better characterize this series as exhibiting exponential growth (with unit root) than unit growth.

Update, 12/21 10:49pm:

Moses Herzog reminds me of how Steven Kopits lauded Jim Hamilton’s February 23, 2014 post on logarithms:

  1. Hugo AndréFebruary 23, 2014 at 5:43 pm
    Lovely blog post.

    I have had to learn to work with logarithms as part of my economics education but I had not (until now) realized just how helpful they can be.

    More of this kind of thing, please. 😉

    1. Steven KopitsFebruary 24, 2014 at 5:38 am
      Let me agree with, Hugo. I encourage you to do teaching snipets like this one. Some of us took econ a long time ago, and a brief refresher on various topics is very welcome.


Apparently, however, if I write something on logs, I’m out of touch.

113 thoughts on “Per Capita GDP Doing Just Fine, Linearly, since 1947

  1. pgl

    I would say this is a good counter to that nonsense from Stevie but remember – he considers a “professional audience” his list of really dumb clients. So this is going right over their heads!

    1. Edward Charles Kokkelenberg

      Logs are not a smoothing process.
      Both tell a story but both tell the same story of a LT increase in deflated per capita GDP. The us of logs allow one to see percent changes while the use of levels is more familiar.
      Where o where commeth these commentators with ad hominium comments?

  2. pgl

    Maybe I’m being slow here but with:

    “GDP per capita is rising about 40 Ch2012$ per quarter”

    Is the 40 40 cents or 40 dollars?

      1. pgl

        I got you were doing this in real terms. I take it that this was a real increase = $40 per very 3 months. Of course I should not chirp as I just finished a note on some Australian intercompany transfer pricing issue where the editor had to school me that his cite always uses AUD and not A$.

        1. Menzie Chinn Post author

          pgl: No disrespect intended. If I saw Figure 1, I would think it crazy to cite the per quarter increase in real or nominal dollars over the 74 years of data. But that is exactly what Mr. Kopits wants me to do.

          1. pgl

            First rule of consulting – when one watches another consultant misrepresenting matters the way Steve often does, leave the room so no one thinks you agree with him. Integrity may be a scarce commodity in some consulting circles but some of us still strive to hold onto it.

            I trust you saw where he bragged about being a consultant to Hungary’s government, which perhaps is even more corrupt than the Trump White House ever was.

          2. Moses Herzog

            @ Menzie , I would much prefer Menzie’s thoughts but if others think they can enlighten me they are welcome to

            I want to make it clear I am on your side on this Menzie, so this is in no terms argumentative but inquisitive on my part.

            Isn’t one of Kopits’ complaints (assumably) that log terms “smooth out the data too much” and therefor “levels” show the changes (at least short term) more clearly?? If this is the core of his complaint wouldn’t a linear regression (graph line) make the “smoothing out” of the data more extreme in fact than using log?? By that, I am asking isn’t doing it in a linear fashion make what he is supposedly complaining about even worse???

      1. pgl

        Once again – you play the role of a jacka$$. Why not mansplain us on how you would plot this information? Oh you have no clue as usual.

        1. Econned

          Depends on what I was wanting to represent and the audience. There are justifiable reasons for levels, logs, diff of log, percent change, etc…

          And HonkHonkHonk to Econbrowser’s resident tragic clown!

          1. pgl

            I guess you once again failed to follow the discussion. Our host was very clear on what this was about – and of course you were clueless as usual.

    1. Edward Charles Kokkelenberg

      Logs are not a smoothing process.
      Both tell a story but both tell the same story of a LT increase in deflated per capita GDP. The use of logs allow one to see percent changes while the use of levels is more familiar.
      Where o where commeth these commentators with ad hominium comments?

  3. Macroduck

    If we were “plucking”, the recent linear result would be pretty good. “Plucking” against the log result shows the damage from recent recessions is accumulating. Or perhaps it’s the damage from tax cuts. Or monompsony. Dunno.

      1. Macroduck

        Then you are misinterpreting. Funny how often that happens. Maybe because you are also misunderstanding.

        1. pgl

          Actually he is doing what he does best – act like the “professional” jerk. Princeton Steve’s best client.

      2. Macroduck

        In order to interpret accurately, you must understand. So, quick question: In terms of graphic representation of GDP over time, what’s “plucking”? Who’s idea was it? No fair looking it up.

        1. Econned

          Dude, are you serious? Everyone knows about Friedman’s plucking model. No business cycles.

          Your “ Dunno.” has zero to do with what others do or do not interpret.

          1. pgl

            No business cycles in the Austrian sense. But his model does consider downturns and recoveries. I guess such details are things you are incapable of teaching those kiddies who think you are teaching them economics.

          2. Econned

            pgl (PaGLiacci the perpetually tragic clown),
            I’m only using Friedman’s own words (e.g., Parker’s Reflections on the Great Depression). If you actually understand the concept of a plucking model or Friedman’s work you wouldn’t have made that comment…. of course the model “considers downturns and recoveries”.

          3. pgl

            Econned
            December 22, 2021 at 3:39 pm

            You managed to copy and paste a couple of words that you neither understood or could properly articulate? Par for the course for you!

          4. Econned

            pgl,
            Yes! You’re right! I copied and pasted but didn’t have a clue. Thanks for catching you perpetually worthless commenter!

          5. pgl

            Econned
            December 23, 2021 at 11:40 am

            I bit of rare honesty – he admits he did not have a clue. Dude – we have known that for a while!

      1. Econned

        And this would be a vote for pgl “to play the role of a jacka$$ acting as if they’re impervious to typos”.

        1. pgl

          Try reading Moses’s comment. He gets the humor. I guess a professional jacka$$ like you is devoid of any humor. Honk yourself clown!

      2. Moses Herzog

        I think it’s a new Sony product, that if you talk to it like Siri, will play any Ella Fitzgerald bebop song, or as it was known at the time “Monomp”.

    1. Menzie Chinn Post author

      JohnH: You do realize that plotting a growth rate means you are looking at the first difference of the log of the series…not the first difference of the series. So I’m still wondering when looking at levels is preferred (except for shares and/or ratios).

      1. Econned

        To show the real data. That’s when. Logs and differences and diff-in-log don’t mean a damn thing to 85% of the population. Unfortunately.

        1. Menzie Chinn Post author

          Econned: Well, the tick marks on the Y-axis indicate the actual value (i.e., I haven’t logged anything and plotted; they’re just plotted on a log scale).

          1. Econned

            Yes, log scales mean nothing but confusion to 85% of the population. Why don’t you understand this?

          2. Menzie Chinn Post author

            Econned: Yes, but I hope the Econbrowser readership does not share the same educational background as the general population. Pretty sure 85% don’t understand regression analysis, too.

          3. Econned

            Menzie,
            Absolutely! But you asked “ So I’m still wondering when looking at levels is preferred (except for shares and/or ratios).” and the answer to those paying attention is it depends on the audience and the objective function.

          4. Moses Herzog

            There goes Menzie again, talking about the mostly silent readers/weisenheimers group. How come I always get picked for the blathering yackers on the comment slow-section team??? The insecure man said “Fishing” for compliments.

          1. Econned

            Yes, that’s what I am telling you. You nailed it again, you poor, poor clown of a commenter. Your clown nose still blocking your view. Take it off. Please.

        2. pgl

          You are defending JohnH – a clown who cannot even read his own link. Which BTW emphasized what our host was saying. I thought JohnH was the dumbest person on the planet but you should be given the Crown here.

          1. Econned

            I’m not necessarily defending JohnH. I’m saying Menzie isn’t being genuine in his posts. Per usual. He’s just an attack dog on guests that he doesn’t like. He asked a, quite frankly, stupid and disingenuous question. He seems ignorant to anything beyond his ivory tower.

          2. JohnH

            The link showed several ways to present the data…but pgl did not notice.

            And they were kind enough to include an interpretation of the data for the public to take away.

          3. pgl

            JohnH
            December 21, 2021 at 4:13 pm

            Dude – I was the one who told you want the rest of those graphs did. I guess you are too stupid to realize something this incredibly simple!

          4. CoRev

            JohnH, PGL is too lazy to follow a link, and in those rare occasions when he does follow it, he fails to read, misreads and misunderstands the contents.

            Quality of comment is not in his universe.

      2. JohnH

        What exactly is your point in showing the data in a log series? What message should the viewer take away?

          1. pgl

            Dr. Hamilton made matters quite clear back in early 2014. But do you really believe Princeton Steve can remember anything longer than 7 months – let also over 7 years ago?

        1. macroduck

          It is well known that U.S. output growth has slowed in recent decades. Growth in population has also slowed. Without comparing the extent of slowing between the two, one might guess that welfare (as measured by GDP per capita, which we all understand is an imperfect measure and that you don’t like) has continued to grow at a steady pace.

          If you chart real GDP per capita in levels, you can get the impression that (average) material welfare has continued to increase at a steady pace. That is a mistaken impression. The log presentation, the slope of which shows the pace of change in GDP per capita, shows that improvement in material welfare has slowed gradually over time.

        2. pgl

          He has explained this MANY times. Try to pay attention. Or just read macroduck’s comment which was so clear that even a village idiot would get it. But maybe not you.

        3. Menzie Chinn Post author

          JohnH: If you think GDP increases in constant unit increments (e.g., 40 chained dollars per quarter), then linear is just dandy. If you think typically GDP exhibits over time a constant growth rate, in logs is more appropriate.

    2. pgl

      Once again our Klass Klown failed to read his own damn link:

      ‘The logarithmic vertical axis ensures that the highlighted contractions have the same relative scale. The chart includes an exponential regression through the data using the Excel GROWTH function to give us a sense of the historical trend.’

      So they agree with Menzie. Of course they did have lots of charts plotting the rate of change rather how the level evolved over time.

      So your point was what? That you cannot even read your own links? Well golly gee!

      1. pgl

        CoRev
        December 22, 2021 at 5:41 am

        CoRev is a funny guy. He is accusing me of not following a discussion? If this troll even remotely understood this discussion – he might have noticed I did indeed already address what JohnH missed.

        Hey CoRev – keep cutting in thinking you have a gotcha moment. Each time you do – you demonstrate how utterly STUPID you are. I had a good laugh at this one!

  4. ltr

    Pretty sure 85% don’t understand regression analysis, too.

    [ Listening to analysts explain statistical relationships on women’s sports broadcasts and knowing coaches now describe the same relationships, “I think” regressions can be readily explained to a general audience. Sort of like Paul Krugman wanting to visualize or picture relationship before setting them in an equation. ]

    1. Econned

      Is the ping pong ball a log graph? So does that mean graph #1 is misleading? Or graph #2? Or both? Or neither? We’re keeping count .

      1. pgl

        You teach ping pong when most macroeconomic teachers are talking how real GDP evolves over time? Oh well you show a fast food receipt when teaching your students about inflation. I bet the kiddies all have a lot of laughs in your excuse for an economic course!

        1. Econned

          PaGLiacci…
          What? You’re starting to make the other resident senile commenter look somewhat sane.
          Please elucidate the issue that you see with an attempt at keeping college kids interested with a simple picture displaying the real world impact of hyperinflation.
          You. Are. A. Literal. Clown.

          1. pgl

            Please elucidate the issue … Like you said with Friedman’s plucking model? And I thought CoRev with a the funny guy!

  5. ltr

    I watch an astronaut put a ping pong ball in a glass of water, and of course the ball floated on the surface. Then the astronaut poked the ball under the surface and the ball simply stayed altogether under the water surface. The astronaut was on the Chinese space station, and there was no gravity to give the water or ball weight. The simplicity or elegance of the lesson will never be forgotten by those watching.

    1. paddy kivlin

      i suspect the same observation from introducing a gas into the liquid using a straw and light gas pressure……

      most of us think of orbital problems in terms of newton’s third law. acceleration, and vectors.

  6. rsm

    Why do you think GDP growth should be a goal of society?

    Does GDP have anything to do with me?

    Is GDP purely reflexive, in that it has only psychological meaning?

    Or do you seriously believe you are measuring actual output, because you throw away all the statistical uncertainty?

  7. macroduck

    Menzie has never gone “full Socrates” in his posts, at least that I recall. There is, however, something a bit socratic presenting a couple of charts and leaving it to readers to draw information from them.

    What do the brash and unjustifiably opinionated among us conclude? That Menzie did it wrong.

    The Socratic method, though annoying in the wrong hands, has confidence in the learner at its core; “These guys can figure it out.”

    Sometimes, that confidence is misplaced. “He did it wrong” means you missed the punchline. Different people miss the joke for different reasons. JohnH is one of those oh-so-common internet dwellers who insists that only what they want said is worth saying. Brucey and CoVid insist that only rightwing talking points are allowed. Kopits likes the rightwing-approved stuff, too, but also seems to live inside his own little world in which his made-up economics is as good as – or better than – actual economics. Consultant vanity, I suppose. So these guys fail the socratic test; presented two charts, they don’t figure it out. Won’t say can’t, because they mostly don’t seem to try, so quickly do they blurt out “He did it wrong” and wander off into the same tedious rhetorical rut as always.

    I haven’t noticed a right-wing bias from Econned. (Confession: I nearly alway skip his comments.) He just seems to be here to stroke his ego, a brat who says rude things for the attention it brings.

    Guys, you’re failing Socrates. Failing Socrates is like failing smart. Menzie tries to get you to stop failing smart, and you refuse to even try.

    1. pgl

      A very nice summary of what I have called “The Usual Suspects” with due apologies to one of my favorite movies.

    2. T. Shaw

      I was goaded to go to FRED and see the numbers presented there.

      Then, I did some lower-division math to analyze them for my low-level purposes. I won’t show it. You guys would laugh.

      In addition to my second-grade math, I would plot linearly the highs and lows on two lines. As long as the new highs are higher and the new lows are higher, I’m ‘happy’ with the trends.

      Judging the levels is more complicated. I don’t do complicated, any more. I’m retired.

      Professor Menzies says we are do ‘just fine’ with regard to real per capita GDP. I’m good with that.

  8. macroduck

    In other news-

    EverGrande just had two land parcels taken away after failing to meet work deadlines. RiseSun has been downgraded in response to a distressed debt exchange effort. RiseSun is also trying to shed non-real estate assets. China’s real estate meltdown continues.

    Meanwhile, Turkey’s experiment in fighting inflation with rate cuts has led to a government pledge to compensate savers for inflation,. Seems to have put a floor under the lira for now, but the implication is more monetary expansion. Nonsure this is goin to work. https://tradingeconomics.com/turkey/currency

    So it’s rough out there.

    1. Moses Herzog

      @ Macroduck
      At this point, the darker sadistic side of me is enjoying this in a sardonic humor kind of way. But you know “good people” are suffering in ChIna and Turkey as I get my cheap chuckles here with my Corona mango.

      1. Macroduck

        Methinks the average Turk is in for a rough few years.

        If China has a rough few years, lots of others will suffer right along. Financial suppression works until it doesn’t.

  9. SecondLook

    The most profound question isn’t the trend line from 1947 to the present, but what is the endpoint. And at what sustainable level.
    Assuming that there is an endpoint. Or shall we extrapolate to that date when per capita income exceeds 7 figures and we enter into a post-scarcity society; where, as Keynes put it, the “economic problem” no longer exists.

    And also assuming that we don’t massively wreck modern society before that happens by climate change or unrestricted nuclear war

    Sorry, end of a very long year musings…

  10. pgl

    Princeton Steve brags about consulting for MOL – a Hungarian energy company. This CNBC reporter tried to ask its CEO about corruption, bribery, and even nationalization. The CEO artfully danced around her questions talking about the “market model”.

    https://video.search.yahoo.com/search/video?fr=mcafee&ei=UTF-8&p=hungary+mol&type=E211US1494G0#id=3&vid=65d96aac475fe7b01043676b82d1f4fd&action=click

    Is this the results of Princeton Steve’s consulting? How to deflect from real issues using big shot works like the “market model”?

  11. Anonymous

    US to (briefly) become world’s largest LNG exporter.

    https://www.msn.com/en-us/money/markets/u-s-to-be-world-s-biggest-lng-exporter-in-2022/ar-AAS0ps8?ocid=msedgdhp&pc=U531

    Interesting to look back 15 years or so and see the flurry about “peak gas”

    https://www.youtube.com/watch?v=poRAEL7M9Ds (David Hughes, sometimes cited by James Hamilton regarding oil supply worries)

    And Alan Greenspan urging construction of import terminals.

    https://www.federalreserve.gov/boarddocs/testimony/2003/20030610/

  12. ltr

    http://www.news.cn/english/2021-12/22/c_1310388443.htm

    December 22, 2021

    China front-loads 2022 special bond quota to sustain growth

    BEIJING — China’s Ministry of Finance has allocated 1.46 trillion yuan (about 229 billion U.S. dollars) from its 2022 quota for local government special bonds, as the country seeks to boost local infrastructure investment and steady economic growth for the upcoming year.

    Characterizing the country’s proactive fiscal policy, the advance allocation is aimed to mitigate economic pressure in the first quarter of next year, said Vice Minister Xu Hongcai at a recent press conference.

    Set to be issued and used in the first quarter accordingly, these special bonds are expected to “provide strong support for stabilizing the macroeconomic climate,” Xu said.

    According to a guideline jointly released by the ministry and the National Development and Reform Commission (NDRC), the bonds will fund projects providing significant economic and social benefits, including those in transport infrastructure, energy, ecological conservation and government-subsidized housing.

    The issuance will also prioritize projects that have been incorporated into the country’s 14th Five-Year Plan and other major long-term strategies for regional development.

    KEY POLICY MANEUVER ….

  13. ltr

    http://www.news.cn/english/2021-12/22/c_1310387659.htm

    December 22, 2021

    Belt and Road projects yield fruits, forge ahead amid pandemic in Asia-Pacific
    By Qu Junya

    HONG KONG — In early December, landlocked Laos took a quantum leap toward the nation’s dream of becoming a land-linked hub thanks to the inauguration of the China-Laos Railway.

    Laos is the only nation in Southeast Asia without direct access to the sea. Lao President Thongloun Sisoulith called the occasion “a proud moment and the dream of all ethnic groups of Laos.”

    The first electrified railway in Laos was made possible by the China-proposed Belt and Road Initiative (BRI). China’s grand plan for a better-connected world was also behind Vietnam’s first metro line, which went into commercial operation in capital Hanoi in November.

    The Asia-Pacific is home to an extending infrastructure network which was further energized over the past year by new bridges, dams, highways, power lines and railroads, among other BRI projects. Even the COVID-19 pandemic did not slow down work for long. The East Coast Rail Link in Malaysia had almost its entire staff fully vaccinated by October.

    Around the world, 141 countries and 32 international organizations, including 19 UN agencies, have participated in the BRI.

    CHINESE TECHNICAL STANDARDS

    In Bangladesh, the awe-inspiring Padma Bridge nears completion. The rail-road bridge is expected to speed up development and poverty reduction in the southwest of the riverine country, and to complete a key link in the envisaged trans-Asian rail network.

    The Padma Bridge has 40 piers sunk into the sandy riverbed. According to Bangladeshi project engineer Dewan Muhammad Abdul Kader, “Every pier and span presented numerous challenges” to the Chinese engineers.

    The China-Laos Railway has 75 tunnels in the 422-km Laos section….

  14. ltr

    https://news.cgtn.com/news/2021-12-22/Chinese-mainland-records-77-confirmed-COVID-19-cases-16bZyd8sJGw/index.html

    December 22, 2021

    Chinese mainland reports 77 new COVID-19 cases

    The Chinese mainland recorded 77 confirmed COVID-19 cases on Tuesday, with 57 linked to local transmissions and 20 from overseas, data from the National Health Commission showed on Wednesday.

    A total of 19 new asymptomatic cases were also recorded, and 501 asymptomatic patients remain under medical observation.

    Confirmed cases on the Chinese mainland now total 100,544, with the death toll remaining unchanged at 4,636 since January.

    Chinese mainland new locally transmitted cases

    https://news.cgtn.com/news/2021-12-22/Chinese-mainland-records-77-confirmed-COVID-19-cases-16bZyd8sJGw/img/2c2cf76555ad44d1896f07ce2c80629b/2c2cf76555ad44d1896f07ce2c80629b.jpeg

    Chinese mainland new imported cases

    https://news.cgtn.com/news/2021-12-22/Chinese-mainland-records-77-confirmed-COVID-19-cases-16bZyd8sJGw/img/4d1b87d8a7ab4cbc91107b277f9e66b4/4d1b87d8a7ab4cbc91107b277f9e66b4.jpeg

    Chinese mainland new asymptomatic cases

    https://news.cgtn.com/news/2021-12-22/Chinese-mainland-records-77-confirmed-COVID-19-cases-16bZyd8sJGw/img/2dd6bb43b67b481e8b015961e2159818/2dd6bb43b67b481e8b015961e2159818.jpeg

    1. ltr

      http://en.people.cn/n3/2021/1222/c90000-9936420.html

      December 22, 2021

      Over 2.7 bln COVID-19 vaccine doses administered on Chinese mainland

      BEIJING — More than 2.7 billion COVID-19 vaccine doses had been administered on the Chinese mainland as of Tuesday, data from the National Health Commission showed Wednesday.

      [ Chinese coronavirus vaccine yearly production capacity is more than 7 billion doses. Along with over 2.7 billion doses of Chinese vaccines administered domestically, more than 1.85 billion doses have already been distributed to more than 120 countries internationally. Nineteen countries are now producing Chinese vaccines from delivered raw materials. ]

  15. pgl

    It appears that a few people here are mystified at what our host is saying. JohnH explicitly noted that he is clueless. At least he is being honest about that – as opposed to Princeton Steve, Econned, and rsm who also appear to be lost but drown that out in their usual arrogant rants. Look Menzie has been clear but since a few of you need to have this spoon fed for you, try reading this:

    macroduck
    December 21, 2021 at 8:42 pm

    A very clear statement. Somehow I figure that some of you will be still lost but hey – try taking off your shoes if you need to count past 10.

  16. pgl

    Elderly residents of Israel may soon be getting their 4th does of the COVID-19 vaccine. I wonder if they means I will be getting my 4th Pfizer does say in April?

    1. CoRev

      PGL, the fearful, wonders how long before his 4th and then his 5th … Covid booster? For some like him boosters will never end, because it is the irrational fear of falling out of that ~99.85% of US vaccinated citizens who have not died from Covid this year.

      There is a chance of being murdered on the NYC subway. I wonder if he eschews riding it?

      1. pgl

        There is a very good chance if you ever walked into a NYC subway station – the police would toss you in Rykers for good reason. Word of advice – get your booster before a well known jerk like you comes to my city.

      2. pgl

        BTW – I have not owned a car since Dec. 2007 when I moved in here. I virtually live on the subways and thankfully we do not have to endure MAGA hat wearing clowns like THE CoRev (or as macroduck calls him THE CoVid).

      3. 2slugbaits

        CoRev how long before his 4th and then his 5th … Covid booster? For some like him boosters will never end

        Boosters probably won’t end. Why? Well, one reason is that vaccine effectiveness tends to wane over time. Another reason is that viruses mutate. I get a flu shot every year for those very reasons. I fully expect to get an annual or semi-annual COVID vaccine booster as well.

        1. CoRev

          2sslugs says: “one reason is that vaccine effectiveness tends to wane over time. Another reason is that viruses mutate. Another frequent result of virus mutation is that the latest is weaker than the last. Omicron hopefully.

          the flu is endemic. So
          “How many people die from the flu?

          The CDC estimates that an average of 36,000 people died of the flu each year over the past decade. The worst recent flu season was 2017-2018, when 61,000 people died from the flu. …” https://usafacts.org/articles/how-many-people-die-flu/ Or we can compare the Covid deaths on Dec 23, 2021 per million world wide 682.82 from here: https://ourworldindata.org/grapher/total-covid-cases-deaths-per-million

          I’ll let you covert to a decimal or even logs. 😉

        2. pgl

          I wonder if CoRev realizes his hero (Trump) got the booster. Or maybe he thinks the liars that run Faux News are bravely going out there unvaccinated. It turns out that these liars are telling fools like CoRev to be brave boys and ignore the scientists but funny thing – they are vaccinated to the max as well. Gee – CoRev worships people who turn out to be cowards by CoRev’s weird standards.

    1. Menzie Chinn Post author

      Steven Kopits: The last line of the post you wrote approvingly of (notably by Professor Hamilton) was:

      “So next time somebody wants to summarize data in terms of natural logs, don’t complain– it’s usually a much more meaningful and robust way to see what’s going on.”

      1. Steven Kopits

        Jim wrote that, not me.

        Again, I am not opposed to using logs. I think if we are talking exponential growth over a longer stretch, then a log-based presentation can be helpful. For example, if we are talking about the spread of omicron cases, a log scale can help keep region to region comparisons visible.

        I would, however, not use logs except for an audience I thought was accustomed to such a presentation, for example, economists. I would not use it in, for example, a plain vanilla investor presentation or prospectus.

        When we are speaking of the throughput of Long Beach, the variance from high to low is about 70%. I seriously doubt I would use a log axis for that, and I don’t know why you did, either.

        1. Menzie Chinn Post author

          Steven Kopits: But you lauded Jim’s post, which ended with the sentence I quoted.

          By the way, I have no idea what “variance from high to low is about 70%” means. Getting the summary statistics over available data gives me a low of 94,125, high of 444,736. How do you get the 70%?

        2. Steven Kopits

          I did. I like logs for showing growth rates, for example. But I would not use it for an everyday crowd. And for a port, which is a slow-moving fixed asset? Probably not.

          1. pgl

            This sounds you like you choose to flip flop how you present data to mislead for political purposes. But then the rest of us knew you lie with statistics a long time ago.

        3. pgl

          “I think if we are talking exponential growth over a longer stretch, then a log-based presentation can be helpful.”

          Mother of God – do you not realize the post had a chart showing exponential growth for a period over 70 years? WTF constitutes a “longer stretch”? Do you have some series of US real per capita income that dates back to the Roman Empire or what?

      2. pgl

        Like I suggested to Moses when he linked to this classic post. Steve cannot remember something 7 months ago. And we are expecting him to recall something from early 2014?

    2. pgl

      Excuse me? When are they used inappropriately according to Grand Jerk known as Princeton Steve? Oh yea – when they are part of your worthless blog posts.

      The case for using logs here was made by Menzie here, by macroduck in one of his insightful comments, and that early 2014 post by Dr. Hamilton. Could you stop bloviating long enough to actually READ these things? DAMN!

  17. pgl

    The OECD has released its Pillar Two which has a simple goal – having corporate taxes globally be no less than 15%. It was supposed to be a means for deterring transfer pricing abuse but it seems it never bothered to address transfer pricing. Rather it is a bunch of convoluted accounting rules that will keep boring scumbags with CPAs and law degrees charging big fees for a lot of junk. Of course international taxation has always been this way so what’s new.

    There is one major exception to this global minimum tax. It does not apply to shipping multinationals. Yea – JohnH had his hair on fire over shipping cartels. His hair should be on fire that these corporations can legally evade any taxes. But allowing shipping companies to legally evade taxes has been the rule for over a century. No wonder Wilbur Ross and McConnell’s father-in-law went big time in this corrupt sector!

  18. pgl

    You are so proud of your ability to totally misrepresent this issue. No wonder macroduck calls us CoVid! BTW troll – the first time you chimed in here was to play gotcha when I linked to a Kevin Drum discussion that got this right. Try READING it. You might learn something. Not that you would ever have the honesty to present this data in a meaningful way. It ain’t what you do.

  19. pgl

    “Realization was due to a message by PGL listing his long list of fears”

    Oh gee – CoRev has become my new stalker! Sort of like Donald Luskin is Paul Krugman’s stalker.

    Hey CoRev – come to Brooklyn if you really want to stalk me. Our police have your cell phone number so please bring it along with you to make their job easier!

    Of course I should apologize to the world for listening to the scientists about socially distancing. CoRev of course is doing all he can to make sure everyone catches the Omicron he is gleefully spreading! What a guy!

  20. 2slugbaits

    CoRev You have a long history of misunderstanding what your source is actually saying, and then when that fact is brought to your attention you invariably pretend that’s what you meant all along. The internet is quite familiar with the phrase “pulling a CoRev.” It’s what you do.

    irrational need to look at the imperfect vaccines as a savior to that fear.

    This is a strawman argument. No one ever said that vaccines are perfect. The question is whether or not vaccines dramatically improve one’s odds of survival, and the COVID vaccines clearly do that. But vaccines are not like some invisible armor that keeps the virus at bay and doesn’t allow it to enter your body. Vaccinated or not, you still have to breathe, which means the virus will inevitably get into your nasal cavity. Vaccines are not designed to provide that kind of defense. What vaccines do is prompt your immune system to quickly marshal an army of antibodies that will inactivate the virus before it has an opportunity to replicate in significant numbers. In some ways I blame the CDC for propagating the metaphor in which the virus acts like a kind of magical shield.

    Let the data speak for itself.

    Data do not speak for themselves. Data are silent. You have tease information out of the data, and that means understanding statistical methods. That’s why we talk about “statistical inference.” An analyst has to set up sample plans, define hypotheses, organize the data and eventually infer conclusions from the data.

    As to whether or not most people understand logarithms, I always remind myself that about half the population has an IQ under 100 and that about half the electorate voted for Donald Trump. Menzie asked if they still teach logarithms in high school. My sense is that while high schools might still teach logs, that doesn’t mean students are taking the courses.

  21. rjs

    ok, this comment will not be related to this post, but i have a problem with this morning’s GDP release, and this is the only recent thread here where you discuss GDP….first i’ll give you the revisions to international trade as reported, then i’ll explain the problem with them:

    The previously reported decrease in real exports was revised even lower with this estimate, while the previously reported increase in real imports was revised downwards by less, and as a result the change in our net trade was a greater subtraction from GDP than was previously reported…our real exports reportedly fell at a 5.3% rate, revised from the 3.0% contraction rate reported in the second estimate, and their decrease subtracted 0.59 percentage points from 3rd quarter GDP, rather than the 0.33 percentage point subtraction due to lower exports shown last month…meanwhile, the previously reported 5.8% increase in our real imports was revised to a 4.7% increase, and their increase subtracted another 0.68 percentage points from 3rd quarter GDP, revised from the 0.83 percentage point subtraction shown last month….thus, our deteriorating trade balance subtracted a rounded net of 1.26 percentage points from 3rd quarter GDP, rather than the 1.16 percentage point subtraction that had been indicated by the advance estimate..

    However, we have to add a caveat to this estimate’s trade figures, one which the BEA does not address…with the report on our International Trade for October of two weeks ago, import and export figures for the months going back to April were also revised, in most cases significantly lower…while those reported downward revisions to 3rd quarter trade were applied to this 3rd quarter estimate of GDP, the downward revisions to 2nd quarter trade were not; as the BEA will not revise the 2nd quarter trade figures in the National Income and Product Accounts until the annual revision to GDP next summer…as a result, this GDP report reflects a comparison between revised 3rd quarter trade figures, and the old 2nd quarter trade figures reported before the October revision…the magnitude of the omitted trade revisions suggests there will be a statistically significant upward revision to 3rd quarter 2021 GDP when the annual revision is released at the end of July 2022..

  22. Erik Poole

    Logs are useful for showing how the rate of change of a time series changes over time. As discussed.

    The stylized facts from the economic growth literature suggest that real growth rates slow down over time for rich, mature economies.

    I cannot help but wonder on occasion if one of the macroeconomic challenges the USA faces is that large numbers of voters believe that high 3 to 6% real rates of growth can still be sustained in the USA. That would put pressure on both fiscal and monetary authorities to make it so and thus contribute to policies that accentuate macroeconomic fluctuations as opposed to reduce them.

    The first chart hints at the possibility of high growth rates forever, whereas the second chart of log-transformed data shows the slowing rate of growth.

    In other words, conventional data presentation could contribute to unreasonable growth expectations. I don’t put much stock in that possibility and even if things were so, I have no idea to ‘fix things’ as logarithms appear to be beyond the comprehension of 95% of the population.

Comments are closed.