Manchin’s announcement that he would vote against BBB constituted a kind of event study. Here are the market indicators of expected inflation and economic activity.
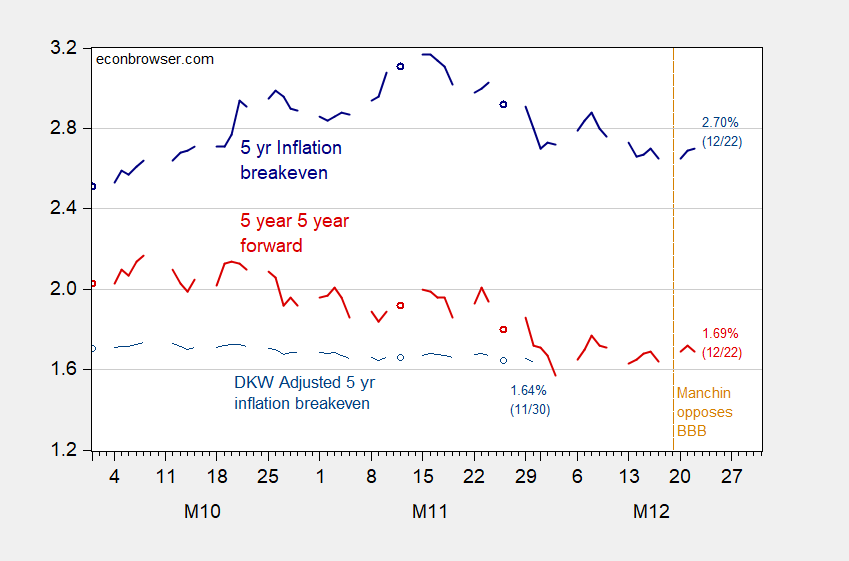
Figure 1: Five year inflation breakeven calculated as five year Treasury yield minus five year TIPS yield (dark blue line), five year breakeven adjusted by inflation risk premium and liquidity premium per DKW (light blue thin line), five year five year forward expected inflation calculated from Treasury and TIPS yields (red), all in %. Source: FRB via FRED, Treasury, Kim, Walsh and Wei (2019) following D’amico, Kim and Wei (DKW) accessed 12/22, and author’s calculations.
The five year inflation breakeven barely budged going from Friday close (12/17) to Monday close (12/20), suggesting — in line with most analyses — that there would have been minimal impact on inflation arising from BBB passage (see [1], [2]). It would’ve been interesting to know what the adjusted (for term, liquidity premia) DKW estimates are, but those extend only up to 11/30 (thin blue line).
What about the implications for economic activity? The five year TIPS yield also barely budged, while the 10yr-3mo Treasury spread stayed constant going from Friday to Monday close.
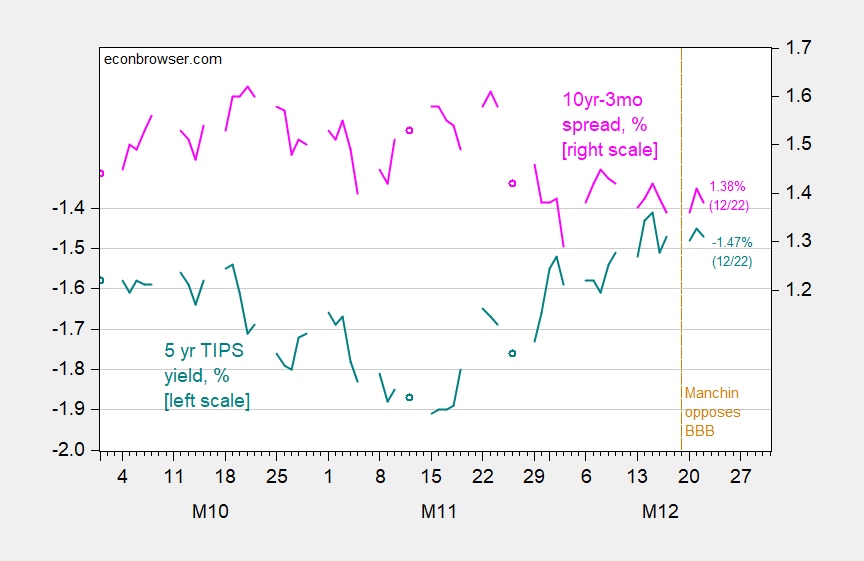
Figure 2: Five year TIPS yield (teal, left scale), ten year-three month Treasury term spread (pink), both in %. Source: FRB via FRED and author’s calculations.
Event studies rely upon a dearth of concurrent events during the window examined. Clearly, over the weekend, news about omicron weighed upon expectations, so this is not a clean test. In addition, the prospects for BBB had been fading over time, even before Manchin’s declaration. Hence, the relevant window might not be the one extending from Friday to Monday.
PredictIt doesn’t have a measure of betting on what would be the relevant outcome on BBB (e.g., passage of BBB in January), but did have one for passage by December 23rd (wherein odds declined starting around 26th of November), and does have one for amounts in the package passed by July 1st. The latter jumps up for $0.6 trillion, from 21 cents on 12/18 to 40 cents on 12/19.
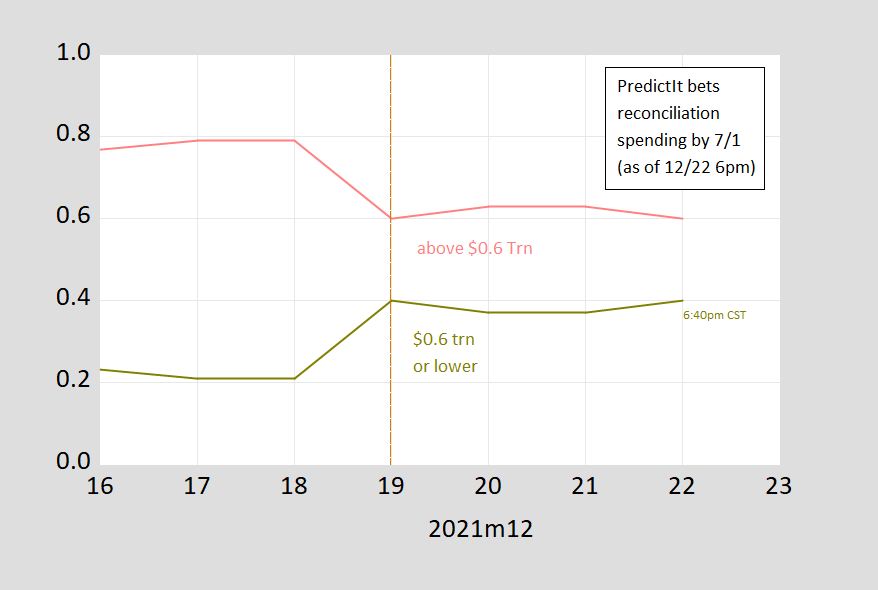
Figure 3: PredictIt bets on reconciliation package spending by 7/1, $0.6 trillion or below (chartreuse), and greater than $0.6 trillion (rose). Source: PredictIt, accessed 6:40pm Central, and author’s calculations.
With that in mind, I still think that the movements over the weekend in the financial indicators reflect the news regarding Manchin’s decision.
Apparently, Manchin is himself a moving target. (Not to say a flip-flopper.) Before Monday’s tradeing session wasvover, there was speculation that his Faux News interview was a tantrum at being singled out as the real problem passing BBB. He went to all that trouble to draw attention to himself, and when the White House gave him what he wanted, he threw a fit. He hadn’t planned to scuttle BBB, he just let his wee emotions get the better of him. He has jumped at the chance to return to negotiations,ceven if negotiations lead nowhere.
Manchin wants Biden’s name on board with him. Biden wants some form of child tax credits. Sanders wants climate spending. Sounds like all 3 men can break a deal. Passing the tight house is another matter. Spring may be a good time to move on this. Disinflation, omicron will be long over and entering viral dormant season. Kickoff to the 2022 campaign.
Gregory,
I do not know what Manchin wants, but I think you meant to say “Inflation” rather than “Disinflation” will be over, along with omicron, so maybe a good time to move. Many observers, such as Larry Summers, and most of the media, thinks that we are still in a period of accelerating inflation, which measuring on a year to year basis is true. However, as Menzie has noted. measured on a month to month basis the rate of inflation has been declining since July, meaning from that view we are experiencing disinflation. So it might be that in the spring this decline in month to month inflation will come to an end, meaning that disinflation will end. But I suspect this is not what you meant, Gregory, although I could be wrong. Maybe it is exactly what you meant.
This is off-topic, but I note that in another thread here we saw examples of something that happens here periodically: people referring to Jim Hamilton as “Professor Hamilton” or “Dr. Hamilton,” while they then refer to Professor Dr. Menzie Chinn as just “Menzie.” I would suggest people be consistent in how they refer to these two gentlemen, either both by their titles or both by their first names, which is what I do, although I understand that may be easier for me as I know both of them personally.
You’ll always be Junior to me.
Are you hiding from just saying outright: BBB is not inflationary? Why not make that argument from first principles by challenging rational pricing theory, which presumably is the economic assumption Manchin is using to predict inflation? Aren’t you saying the market rejects Fiscal Theory of the Price Level?
rsm: Actually, footnotes [1], [2] say exactly that – BBB is not inflationary.
Just in case some do not understand what rsm is saying with this Fiscal Theory of the Price Level (I seriously doubt rsm understands what this theory is about), here is an excellent discussion:
https://users.nber.org/~bassetto/research/palgrave/ftheorypost.pdf
A lot of the early thinking about this idea came after Saint Reagan decided to give a permanent and large tax and higher government spending. This is NOT what BBB is about. If rsm thinks he is, then he is truly an idiot.
Manchin is a student of Sargent and Wallace? I doubt it. If you were – you were perhaps their worst student ever. Or do you not understand BBB have tax increases to go along with the extra spending? Put a confidence interval around that while you are at it.
rsm: Well, no, I wasn’t saying anything about the Fiscal Theory of the Price Level. I was saying something in the context of a simple AD-AS model.
Depends on the timing. Funds disbursed in the next three months, say, are likely to have an inflationary component. After that, depends on other stuff.
Somebody has never heard of the Life Cycle Model of Consumption or something called Rational Expectations. Dude – do not try macroeconomics until you have at least taken a freshman course in it.
I don’t trust myself to attempt the math on the annual impact of the BBB relative to the U.S. economy over a ten year period, but based on stuff I read from Dean Baker, it’s pretty affordable. A crude comparison would be to look at the U.S. economy as a family* that has a house and other assets worth $200,000 with two wage earners who have a combined income of $25,000 a year and have an outstanding mortgage balance of $50,000**. They’re considering spending a thousand dollars on some home improvements. Can they afford to do this? What line of credit will their bank*** give them, and on what terms?
*The family can print money and owns nuclear weapons
**Their borrowing rate seems to fluctuate between 0.1% and 1.8% in recent years and
***Their banker is constantly lending them small amounts of money for a multitude of projects and has been doing it for decades. They’re looking forward to keeping up this business relationship for a really long time. The family fights a lot about things like the highway that was built under the part of their house called “Boston” and the wars that they wage on their neighbors. But, they’ve never missed a loan payment. Ever.
Sargent and Wallace would find this an interesting rebuttal to that stupid comment about the Fiscal Theory of the Price Level even if S&W basically began the thinking around the theory rsm mentioned but never understood.
Exactly. Manchin will vote for BBB only if he gets to write it.
https://fred.stlouisfed.org/graph/?g=EJsH
January 15, 2018
Consumer Price Index and Personal Consumption Expenditures Price Index less food & energy, 2017-2021
(Percent change)
https://fred.stlouisfed.org/graph/?g=DaZv
January 15, 2018
Consumer Price Index and Personal Consumption Expenditures Price Index less food & energy, 2007-2021
(Percent change)
https://www.nytimes.com/2021/12/23/business/japan-taxes.html
December 23, 2021
Why Even a 40% Tax Break Won’t Move Japan’s Employers to Raise Pay
The country’s prime minister says lifting long-stagnant wages would jump-start the sputtering economy. Companies call the plan a nonstarter.
By Ben Dooley and Hisako Ueno
TOKYO — Over the last two years, Masataka Yoshimura has poured money into the custom-suit business his family founded more than a century ago. He has upgraded his factory, installed automated inventory management systems and retrained workers who have been replaced by software and robots.
Japan’s prime minister, however, wants him to do one more thing: Give his employees a substantial raise.
The reasoning is simple. Wage growth has been stagnant for decades in Japan, the wealth gap is widening and the quickest fix is nudging people like Mr. Yoshimura to pay their employees more. Higher wages, the thinking goes, will jump-start consumer spending and lift Japan’s sputtering economy.
But raises are a nonstarter for Mr. Yoshimura. Increasing wages would be “truly fatal,” he said last week from his office at Yoshimura & Sons in Tokyo. And he is far from alone in his thinking. Business groups, union leaders and others have questioned the feasibility of a plan by Prime Minister Fumio Kishida to offer sizable tax deductions to companies that raise pay.
That businesses would resist increasing wages even when essentially paid to do so shows just how intractable the problem is. Years of weak growth and moribund inflation rates have left companies little room to raise prices. Without steady, moderate increases in inflation, corporations’ profits — and their workers’ wages — have languished, economists say.
The government has long tried to find something, anything, to stimulate the economy and push up prices. It has pumped money into financial markets and made borrowing nearly free. But it’s been to little avail, as expectations of low prices have become entrenched, demand has been weakened by Japan’s aging population and globalization has kept prices down….
https://fred.stlouisfed.org/graph/?g=K9QW
January 30, 2018
Private sector monthly earnings for Japan, 2000-2021
(Indexed to 2000)
https://fred.stlouisfed.org/graph/?g=K9PO
January 30, 2018
Private sector real monthly earnings for Japan, 2000-2021
(Indexed to 2000)
“Masataka Yoshimura has poured money into the custom-suit business his family founded more than a century ago.”
He wants to run an apparel shop in Japan? This is not exactly a sector known for high wages. The Prime Minister’s call for higher wages is a laudable one but Japanese businesses should strive to get what the nation’s comparative advantages are. Yea – there are American apparel shops that try to get around even the low Federal minimum wage but they routinely go bankrupt.
OK. So more on presentation. I’ve made the case that you don’t always want to show CIs, particularly if you are not sure about the accuracy of your methodology or data. Further, if your CIs are so wide as to suggest your approach is essentially worthless, then you have to address that concern up front in the text and in the very framing of the analysis. You can’t leave that lurking in the dark corner of your CI intervals and hope no one notices.
I have argued that you don’t want to show routine data in logs, except when you are talking about huge growth or the spread of the scale requires logs to be able to meaningfully show two distant data points on the same graph.
Now here’s the third. If you have weekday data but no weekend data, then you have two options. First, just leave out the weekend dates. Thus, the next x axis point after, say, Friday Dec. 3 would be Monday Dec. 6. I don’t really like this approach because it can mess up your x-axis. Instead, I tend to hold the last closing value for the non-trading dates. So I if TIPS were 1.4% on Dec. 3, I would enter 1.4% for Dec. 4 and again for Dec. 5 and then pick up with the new data on Dec. 6. This is technically true, as there was nothing to change that number over the weekend. More importantly, it allows visual continuity of the line on the graph. Our brains — or at least mine — do not work well with disjointed data. I want to see a continuous line, and if that is not in the strictest interpretation correct, it is certainly not false, and it allows easier visual interpretation by the viewer.
Steven Kopits: By your logic then we should also leave out holidays.
I sometimes (not always) use 7 days because (1) I want to show explicitly that something occurred over the weekend, which might be obscured because I only have close-of-trading data, or (2) I want to include 7-day data, such as EPU.
Yes, that’s correct. Normally, I would hold the prior close level for non-reporting days until markets re-open. I understand that’s a convention, but it just makes the graph so much easier to read.
If something occurred over the weekend, then there would be a price change then. If the markets were closed, you cannot infer a price change. You’ll have materially the same story but better visuals. Again, if markets were closed for an extended period of time, say, one year, then this method will probably not suit your purposes. But over a few days, I’d prefer the continuous data visually.
I think I speak for everyone by pleading you to cease your bloviating over logs and confidence intervals so you could have left off the first two paragraphs. On the third matter – no Central Bank I am aware of reports closing interest rates for Saturdays, Sunday, of holidays (Christmas!). You write:
‘If you have weekday data but no weekend data, then you have two options. First, just leave out the weekend dates. Thus, the next x axis point after, say, Friday Dec. 3 would be Monday Dec. 6. I don’t really like this approach because it can mess up your x-axis. Instead, I tend to hold the last closing value for the non-trading dates. So I if TIPS were 1.4% on Dec. 3, I would enter 1.4% for Dec. 4 and again for Dec. 5 and then pick up with the new data on Dec. 6. This is technically true, as there was nothing to change that number over the weekend.’
Everyone gets that FRED takes the first option and very few of us are confused on what they plot. Your approach is making up claims. In your example, TIPs did not close at 1.4% on either Dec. 4 or Dec. 5 but your 2nd option would give the misleading impression that it did. So no – it is not “technically true” at all.
You are correct. FRED leaves out the intervening days, days with no reporting, a graphs accordingly. The FRED’s graphs are not choppy, whereas Menzie’s are.
However, one is often plotting other data with that data, and the other data may have differing time frames. For example, if you use Brent, then that will observe British holidays, if I recall correctly. So you’ll get slippage compared to US data. When you are trying to assemble a US graph, it can be a colossal pain in the ass to line up the data sets from sources using differing conventions (eg, days when the markets are closed). Therefore, I tend to like to use all the calendar days and just continue to use the prior close until markets re-open.
This is entering JohnH territory. Those damn reporting agencies need to report EVERYTHING on an hourly basis according to him just to make the rest of our lives easier.
I really don’t care how agencies report. However, if I had my preference, I would prefer that the Fed used calendar days and left those days without data blank. It would be easier to get apples-to-apples when using different datasets.
Interesting piece on inflation and policy in the U.S. and Eurozone at Voxeu: https://voxeu.org/article/understanding-inflation-risks-us-and-euro-area
The authors conclude that the Fed’s more hawkish stance relative to the ECB is justified by hgher inflation expectations in the U.S., while the output gap in the Eurozone is positive, not the case in the U.S. This gives expectations the central place in policy making that Lucas taught us, while demoting the cyclical justification for rate policy.
The behavior of expectations as measured in surveys shows a very strong link to recent price behavior, especially food and fuel price behavior. There is little evidence the public knows much about Fed inflation targets. So the authors are right that their result do explain the divergence in policy between the Fed and the ECB, but that doesn’t mean those policies are founded in reality.
Meanwhile, the expectation of 2.75% inflation which the authors calculate for the U.S. looks like progress to me. The Fed could use another 75 bps of room to cut rates. There is no evidence that the world has moved into a permanent higher-inflation regime so that the zero bound will no longer be relevant.
A really nice paper indeed. One snippet:
“The conventional view shared by central banks and others is that inflation is the product of three components. First is a cyclical component related to slack in the real economy (the Phillips curve). The second is a more volatile cyclical component related to energy prices, which is driven in part by commodity price shocks and in part by the effect these shocks have on consumer expectations. The third is the ‘trend’ component, which we can think of as the underlying inflation rate that would prevail if the cyclical components were zero.”
It examines each component in detail. I like the fact that they think those official measures of the output gap are likely understating potential GDP.
Kevin Drum is one of those commentators who generally does good work, but he is also tends to be one of those contrarians who tries to prove everyone else is wrong. This time he really flubs it.
He starts off with a legitimate complaint about wages uncorrected for inflation. But then he concludes incorrectly:
“Dammit, wages have gone down this year”
https://jabberwocking.com/dammit-wages-have-gone-down-this-year/
But a moments inspection of his new inflation adjusted wage chart shows something strange. Look at 2009. Best year ever for wage earners! But that was the year of the worst depression in 80 years. How can that be?
What Drum fails to account for is a change in composition of his data set. What happened in 2009 was that millions of low wage workers were laid off, changing the composition of the wage average. As the old saying goes, “Last hired, first fired.”
The same effect on Drum’s chart shows up in 2020. Wow, big wage increases in the depths of the pandemic before vaccinations. What, you don’t remember getting big raises last year with 20 million unemployed?
And then the big drop in 2021 is the complementary effect as million of low wage workers were rehired. The big drop isn’t due to inflation outpacing wages. It is due to a compositional change in the data set.
I’m guessing that real wages are mostly flat or maybe slightly lower, but not the big effect that Drum is claiming with his click-bait headline. You aren’t going to determine this from Drum’s chart.
Yet another example for Menzie Chinn’s students. As he says, you need to understand your data sets.
I’m glad you wrote this. I read that post fairly quickly. Kevin is correct to mock the overrated Steve Rattner who is lauded on Morning Joe as some great economist. He’s not but I guess Joe has not had enough of his coffee before 7AM.
I thought there was something misleading about Kevin’s real wage chart but did not take the time to think more about this (had my coffee and wanted to get the run in). So I appreciate how you ably dissected this issue for me.
Of course Kevin Drum has never pretended to be an economist. He leaves playing economist on the TV to people like Steve Rattner.
A data toy I think you’ll like: https://www.atlantafed.org/chcs/wage-growth-tracker
Not adjusted for inflation, but for most comparisons, that’s OK..
Job changers rule!
There’s another lesson from Drum’s post. Correlation is not necessarily causation.
Drum attributes the big wage swing as due to inflation. But that is just a correlation and a poor one at that. Although inflation does correlate with 2021, there was no deflation corresponding to real wage increases in 2020.
The real cause is the sharpest swing in low wage employment in history in less than two years. 20 million laid off in 2020 and some 15 million or more rehired in 2021. Ya think there might be some causation there?
“Drum attributes the big wage swing as due to inflation. But that is just a correlation and a poor one at that. Although inflation does correlate with 2021, there was no deflation corresponding to real wage increases in 2020.”
He is being a bit dumb here – almost on the level of JohnH’s insane idea that David Cameron’s UK fiscal restraint was good news for British labor because it lowered inflation. Never mind the fact that the fiscal austerity lead to a rather massive decline in real wages.
It’s odd that Drum is eager to seem iconoclastic but takes conventional, out-of-date inflation thinking as given.
It “almost” makes you wonder why someone would continually quote a journalist over and over and over again on a blog as if that person was the editor of NBER newsletters.
Kevin Drum has a couple of important posts on this virus. One is research that should tell every sane person to get your booster shot.
https://fred.stlouisfed.org/graph/?g=G5Ya
January 4, 2020
Real Average Hourly Earnings of All Private Workers, 2020-2021
(Indexed to 2020)
https://fred.stlouisfed.org/graph/?g=mIE8
January 15, 2018
Real Average Hourly Earnings of All Private Workers, 2007-2021
(Indexed to 2007)
As for the prospect of inflation and monetary policy, prices have generally been increasing somewhat faster in the United States than in the United Kingdom or Eurozone. We might expect then for Federal Reserve policy to be somewhat more aggressive. The UK or Bank of England however may actually be the most aggressive from here because of a strict Conservative or Tory bent:
https://fred.stlouisfed.org/graph/?g=ISWp
January 30, 2018
Consumer Prices for United Kingdom, France, Germany and United States, 2017-2021
(Percent change)
I am increasingly concerned about the American use of economic sanctions, and thinking the Biden administration has taken a number of seriously self-defeating actions. Sanctions are now officially set to take effect against countries in the horn of Africa, with Ethiopia especially effected. Ethiopian sanctions begin in January, but companies that are critical for development are already ceasing operations in Ethiopia. Ethiopia has been the fastest growing country in Africa for several years and is influential and spurs African development well beyond its borders.
https://fred.stlouisfed.org/graph/?g=Jw9P
August 4, 2014
Real per capita Gross Domestic Product for China, South Africa, Kenya and Ethiopia, 1992-2020
(Percent change)
https://fred.stlouisfed.org/graph/?g=GYjP
August 4, 2014
Real per capita Gross Domestic Product for China, South Africa, Ghana, Kenya and Ethiopia, 1992-2020
(Indexed to 1992)
https://editorials.voa.gov/a/u-s-sanctions-human-rights-abusers-in-ethiopia/6262697.html
Ethiopia? I guess human rights abuse is fine in your book. If Putin invades Ukraine – are you going to criticize Germany for not buying more natural gas from Putin’s pet company?
https://news.yahoo.com/global-paralysis-ethiopia-war-allows-161745582.html?fr=sycsrp_catchall
Let’s be clear. The government is killing its own citizens and the rest of the world has been slow to respond. And ltr endorses this “global paralysis”?
The Prime Minister of Ethiopia was awarded a Nobel Peace Prize in 2019, then reelected with a massive majority, however Ethiopia was then arbitrarily subject to a war of secession by the leaders of a ethnic minority. Ethiopia was forced to defend the state, even as Abraham Lincoln was forced to defend the Union. Ethiopian Union has been supported through Africa, and the support of Union domestically has so far allowed for the defeat of the secessionists.
Possibly a Nobel Peace Prize recipient prime minister, forced to fight for the survival of Ethiopia, might be shown the respect afforded by Ethiopians who support the precious Union and afforded by Unionists through Africa.
Imagine a country shaped by the struggle for Union, actually vilifying the people of another country forced in turn to struggle for Union. There is a reason the prime minister of Ethiopia was awarded a Nobel Peace Prize, even though the prime minister was finally forced to struggle for the very survival of Ethiopia. Imagine Abraham Lincoln, and possible understand.
How utterly insulting. Do you have even the slightest interest in the true history of these struggles? How much is this government paying you for spreading their lies and promoting their abuse of its own citizens?
Well, Ethiopia’s effort to hold on to territory is great and all, if you ignore all the rape: https://www.amnesty.org/en/latest/news/2021/08/ethiopia-troops-and-militia-rape-abduct-women-and-girls-in-tigray-conflict-new-report/
Not to mention torture, murder and attacks on refugees, amounting to war crimes: https://www.bbc.com/news/world-africa-59143627
ltr, you compare modern-day mass-murderers and rapists to historic figures pretty routinely. It was you, wasn’t it, who compare DuBois to some modern thug? I understand that your political masters insist on this kind of historical dishonesty – just look at what happened to Hong Kong’s Tiananmen Square statue – but you should really try to match your efforts to your audience. We don’t have re-education camps here. Propaganda doesn’t carry the threat of imprisonment here, the way it does in China.
I have never advocated anyone be censored here but this is beyond the pale. ltr is promoting basic genocide.
“Ethiopia was then arbitrarily subject to a war of secession by the leaders of a ethnic minority. Ethiopia was forced to defend the state, even as Abraham Lincoln was forced to defend the Union.”
There are a lot of independent reports on how the government is spreading disinformation like this. SHAME on you for helping a government that is killing its own citizens defend itself with such disinformation.
I have a question for our host – why are these lies on an issue of human rights not be a reason to censor this intellectual garbage?