Monthly GDP for November is in; next big indicator is December nonfarm payroll on Friday. Here are some key indicators followed by the NBER BCDC.
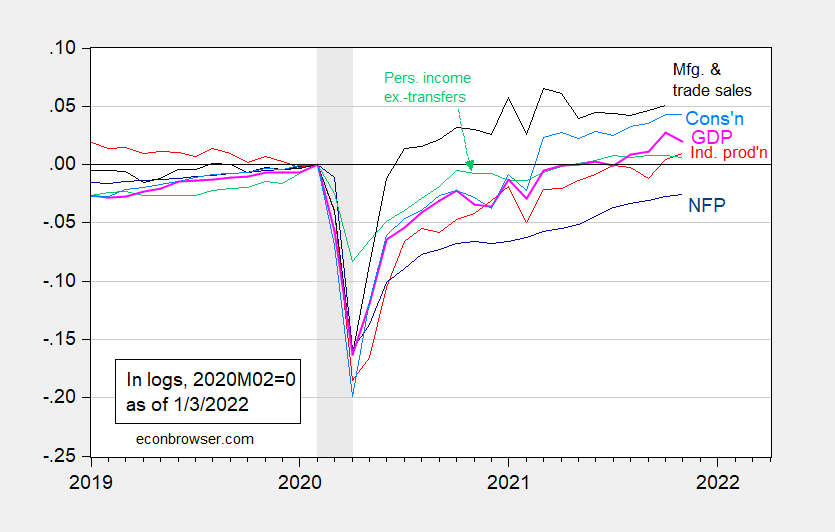
Figure 1: Nonfarm payroll employment (dark blue), industrial production (red), personal income excluding transfers in Ch.2012$ (green), manufacturing and trade sales in Ch.2012$ (black), consumption in Ch.2012$ (light blue), and monthly GDP in Ch.2012$ (pink), all log normalized to 2020M02=0. NBER defined recession dates, peak-to-trough, shaded gray. Source: BLS, Federal Reserve, BEA, via FRED, IHS Markit (nee Macroeconomic Advisers) (1/3/2022 release), NBER, and author’s calculations.
Monthly GDP as measured by IHS-Markit is down. From today’s release:
Monthly GDP declined 0.8% in November, reversing about one-half of
a 1.6% increase in October. T…. The November decline was mainly accounted
for by a sharp widening of the goods deficit. There was also a decline
in nonfarm inventory investment.
One hint at what will show up in the employment report is a hit to leisure and hospitality employment. As Paweł Skrzypczyński points out, seated diners in December are down relative to 2019 levels, so sectoral employment is unlikely to have increased strongly.
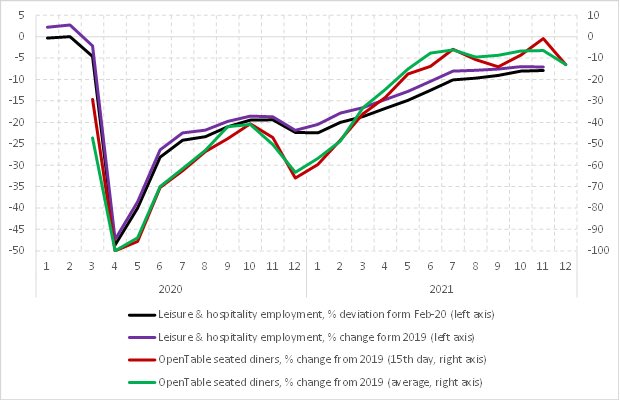
Source: Paweł Skrzypczyński
The IHS quarter-to-date GDP growth estimate, at 7.1% (SAAR) is wiyin spitting distance of the Atlanta Fed’s GDPNow estimate of 7.6% for ye full quarter.
Am I missing something in the IHS estimate? The estimate of a decline in GDP in November is based on an estimate of net exports when net export data aren’t due until Thursday. A decline in inventories based on data due a week frm Friday. So we are seeing an IHS monthly GDP forecast, not an adding up?
I’m not certain I’m understanding all of your query (not because you weren’t clear, but because some of what you said is probably a little over my head). Where are you getting the 7.1% as the GDP growth estimate?? I see a 7.1% in the IHS report but it appears to relate to something else. It appears to be past data, not an estimate.
Moses Herzog: Full quote from IHS-Markit report:
I should’ve quoted entire paragraph.
NO, it was nothing you “left out”, I went and looked for the IHS link after reading macroduck’s question. I mean I think it’s probably something isn’t “clicking for me” here with macroduck’s question because I got too many acronyms and variables flying around my head from reading Econometrics book lately (and a fear that lack of knowledge of calculus is going to bash me upside of the head on my learning progression again To hell with it I’m going to keep reading even if I don’t understand how to break down some of the equations.
I mean, whatever, I think we can be semi happy with 6.7 GDP. Just imagine what orange you know who would have said if he’d had that Quarterly GDP number,
Here’s where I am on Econometrics right now. When I learn things, I go methodically A-B-C-D….. (talking chapters and topic headings here with the letters) And I’m very stubborn about it. I will stick with C until I FULLY understand it, before I go to D. But some things aren’t like that. I have had subjects or classes, where I didn’t understand “C”, so you just keep going because you don’t wanna lose tuition or “drop” a class. I had a math class once that was taught by the head of the math dept. It was pretty basic stuff. it was a pre-requisite very basic Calculus class for business majors (hard for me cuz I was a poorly motivated high school student). But he was a horrid horrid classroom teacher, one of those guys more into research than the classroom teaching. So that class, it had like 35 students (mostly sophomores I assume) roughly. And at that time they were less touchy about student privacy and they would post the grades at the end of the term outside the buildings with your last 4 digits of your SS number, so I made a poor grade in the class, but you can imagine my shock when I saw that roughly 28 of the 35 original students had dropped the class before they got a final grade, it literally showed they had dropped the course. But I made it to the end, and then in my next Calculus class got a much higher grade. So I think even though I am not getting how to clear out these equations and move a Greek letter variable from the left side of the equation to the right side and all that or “cancel stuff out” on the equations, I think if I just keep pushing, maybe when I get to “E” I will suddenly understand something I didn’t get back at “C” if that makes any sense. It DOES happen in the learning process. In other words if I just stop every time I hit a snag I’m just never gonna get this stuff. I just have to hope it’s going to make sense in latter portions, which I hate doing it that way, but I feel I have to at this point.
You mentioned that you’re concerned with your understanding of calculus. This likely (but certainly not necessarily) means you’re not well versed in matrix algebra. As such, you should not have too high of expectations to truly understand econometrics. Linear algebra is very important. But it seems (at least based on mentioning you are “not getting how to clear out these equations and move a Greek letter variable from the left side of the equation to the right side and all that or “cancel stuff out” on the equations”) you’re only just at the very beginning of your quest – so you have time to still get some foundations (calc, linear algebra, etc). Because to truly understand econometrics you’re going to need “A” and “B” before you even start on “E”. But on the other hand, you don’t always need “A” and “B” to understand “C” better than most of the public (even if you don’t truly understand “C”). For example, I’ve had managers who didn’t have the slightest understanding of time-series concepts but they understood very basic econometrics well enough to present time-series results to people who understood even less than they did. There are levels and if you’re just one level above another person, you can *seem* like a genius – for better or for worse.
Doesn’t the employment report have a statistical margin of error of plus-or-minus 500,000?
rsm: Not for establishment series (which is what was plotted in the graph).
BLS technical note to the employment release:
I thought you might enjoy reading these books rsm, they are all free downloads. Enjoy!!!!
https://www.plutobooks.com/open-access-ebooks/
You might also read a micro and a macro book. It’s important to remember there are many different “schools” of Economics. One of my personal favorites is Alan Blinder and his books. Anat Admati is also a fun economist to read:
http://bankersnewclothes.com
Some of those “schools” of Economics who would relate to and empathize with your brother’s plight. But I think if you think some economic concepts sold by Reagan and other had something to do with your brother’s death, people can understand if you don’t “buy into” those things or care too much to read them.
@ rsm Some other Asian-American Economist wrote a great book, something about “Lost Decades” something or another. Hell of a sharp guy. Forgot his name now. Many of his points in the book bend towards remembering people like your brother, who maybe got lost in that economic dogma, who felt they had no personal value if they weren’t succeeding in these “free markets”.
I got that book in the house here somewhere and if I wasn’t such a lazy loser it would be sitting right next to my computer monitor here right now.
i’m showing a 1.90 percentage point hit to Q4 GDP from construction, an estimate i have low confidence in because it’s in part based on using the producer price index for final demand construction as a deflator, which showed an anomalous 6.2% increase in October…the November trade deficit, out tomorrow, appears to be back near a record level, based on the advance report on trade in goods of last week, so that suggests there won’t be a boost from trade….PCE stands to add 3.39 percentage points to the growth rate of 4th quarter GDP is December is flat from the October/November average, so we’d need a big boost from inventory building (still possible) to hit those GDP estimates…
expect the 1st quarter to be difficult, though; i just finished with the weekly petroleum status report for the week ending 12/31 from the EIA, and it shows the largest drops in gasoline demand and production since last year’s lock-down, and the largest build in gasoline inventories over the same period…ex the lock-down, the hit to gasoline production matches up with the worst hurricanes in our history…
just to clarify, now that i can work with the data in front of me rather than making an off the wall guess, it appears that 4th quarter trade is still a positive for 4th quarter GDP…using exhibit 10 in the full pdf for November trade report, which provides monthly trade in goods figures in 2012 dollars, i figure that if our trade deficit in goods is maintained at the current levels throughout December, our improving balance of trade in goods would add a net of roughly 0.23 percentage points to the growth of 4th quarter GDP….the report doesn’t provide inflation adjustments for services trade, but our exports in services grew by $4.4 billion nominally over October and November, whereas our imports in services grew by $2.1 billion over those two months, which would suggest another boost to GDP on the services side of the trade ledger…
source: https://www.bea.gov/sites/default/files/2022-01/trad1121.pdf and author’s calculations..