Yesterday’s nonfarm payroll employment growth (here) surprised (significantly) on the downside.

Figure 1: Nonfarm payroll employment from July release (blue), August (red), September (teal), October (pink), November (lilac), December (black), December consensus calculated adding Bloomberg consensus of 1/6 to November preliminary (light gray +), all in 000’s, s.a. Source: BLS, Bloomberg, author’s calculations.
The downside surprise is all the more surprising given the ADP for private nonfarm payroll employment.
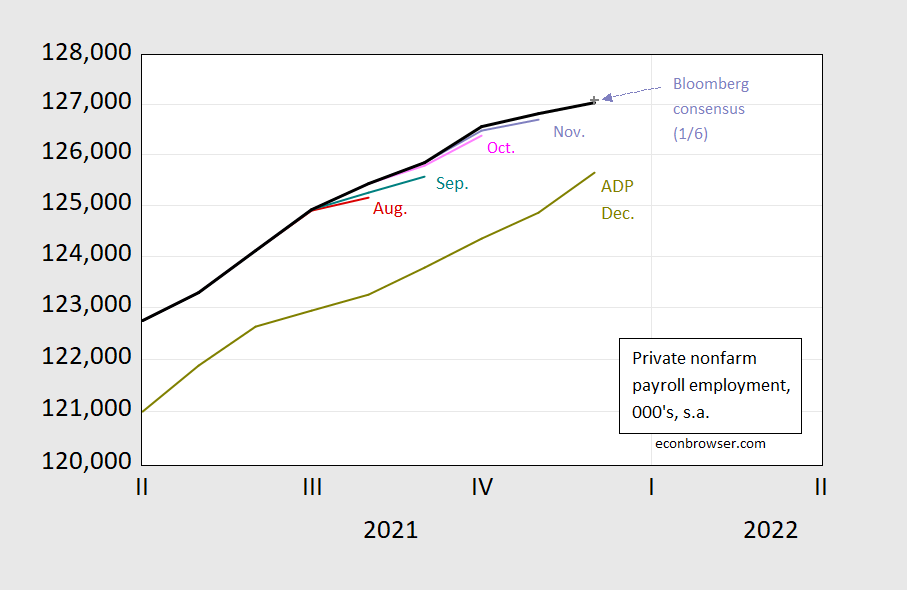
Figure 2: Private nonfarm payroll employment from August release (red), September (teal), October (pink), November (lilac), December (black), December consensus calculated adding Bloomberg consensus of 1/6 to November preliminary (light gray +), ADP (chartreuse), all in 000’s, s.a. Source: BLS, Bloomberg, author’s calculations.
Private NFP looks only slightly below consensus because I calculate the consensus level by adding the consensus change to November initial release level, and November’s figure was raised up.
The consistent upward revisions over the past months suggests the December figure will similarly be upward revised.
Other indicators of labor market overall development rose faster: aggregate weekly hours (for private nonfarm production/nonsupervisory workers) and civilian employment rose
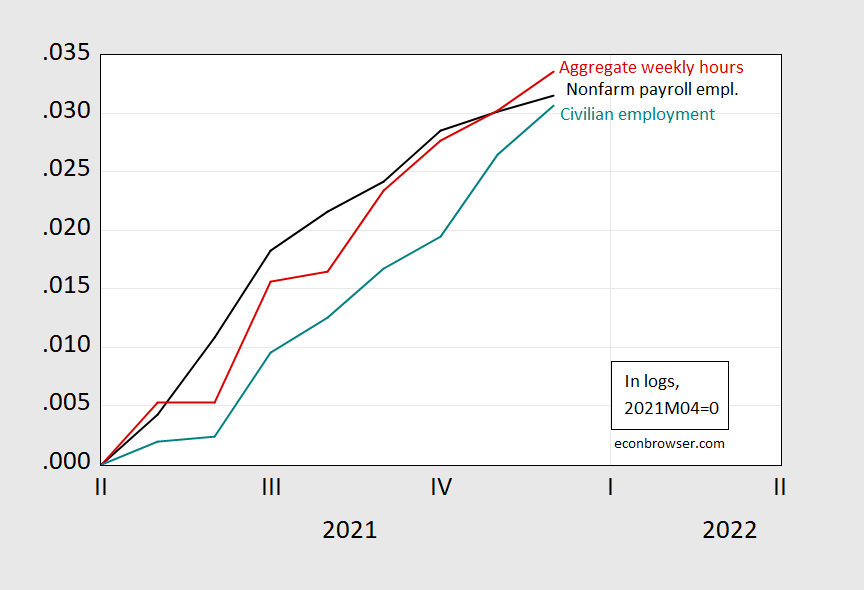
Figure 3: Nonfarm payroll employment from December release (black), aggregate weekly hours (red), civilian employment (teal), in logs, 2021M04=0. Source: BLS and author’s calculations.
While civilian employment has risen faster in growth rates and numbers (0.42% vs 0.13%, 651K vs. 199K), as noted previously, it’s not justified to put much weight on this series vs. the establishment based series [1]. This point was reinforced in a just circulated paper by Goto, Jacobs, Sinclair, van Norden.
See Furman and Powell for more.
Furman and Powell provide a lot of useful data and analysis. It was interesting that they noted average monthly increases in the establishment survey of employment had employment average a 555 thousand per month increase over the year. I say this because the Republican gasbags have been saying last month was the worst increase under Biden. Well yea – when employment was rising at 5X the historical rate, rising 2x the historical rate might seem low by comparison.
But we are still 6 million jobs below where we should be. Furman and Powell also document the disappointment in labor force participation. We need to get this pandemic under control so people start seeking employment.
《the confidence interval for the monthly change in total nonfarm
employment from the establishment survey is on the order of plus or minus 110,000.
Suppose the estimate of nonfarm employment increases by 50,000 from one month to
the next. The 90-percent confidence interval on the monthly change would range from
-60,000 to +160,000 (50,000 +/- 110,000). These figures do not mean that the sample
results are off by these magnitudes, but rather that there is about a 90-percent
chance that the true over-the-month change lies within this interval. Since this
range includes values of less than zero, we could not say with confidence that
nonfarm employment had, in fact, increased that month. If, however, the reported
nonfarm employment rise was 250,000, then all of the values within the 90-percent
confidence interval would be greater than zero. In this case, it is likely (at
least a 90-percent chance) that nonfarm employment had, in fact, risen that month.
At an unemployment rate of around 6.0 percent, the 90-percent confidence interval
for the monthly change in unemployment as measured by the household survey is
about +/- 300,000, and for the monthly change in the unemployment rate it is about
+/- 0.2 percentage point.》
https://www.bls.gov/news.release/empsit.tn.htm
No matter how you try to minimize errors with logs, etc., is 3.9% plus-or-minus 0.2% statistically different from 4.2% plus-or-minus 0.2%
Who is even checking to see what the standard errors and refusal rate really are? Are you taking these magic numbers on faith?
“…is 3.9% plus-or-minus 0.2% statistically different from 4.2% plus-or-minus 0.2%”?
Seriously? Really?
3.9% + 0.2% = 4.1%. 4.1% is less than 4.2%. No calculator needed.
Why all this howling after statistical data when you don’t know what they mean?
Can’t you go bother somebody about mind-control rays or what’s really in Soylent Green?
So, rsm, snore, do you suggest nobody should bother reporting these numbers because of the CIs? I can assure you that even if the agencies reporting such numbers prominently display the CIs, the media and pretty much everybody else, except maybe you, will promptly ignore them.
Once, a few years back, an econ professor blogger suggested averaging establishments and household job gains would be a better estimate than the establishment figure alone. I humbly suggested the two series weren’t conceptually similar enough to allow much confidence in the averaged series. His argument for the validity of averaging the two boiled down to the fact that he had credentials.
The fact that I remember his answer is testiment to how annoyed I was. So I’m pleased as punch to see Goto, et al.
Another point, and I’m repeating myself here – Whether a data point is better or worse than the median forecast says very little about whether the data point implies economic strength or weakness. Itchy-finger financial traders respond to data based on whether the data are stronger oe weaker than expected, based on the assumption that expectations are impounded in market prices. A forecasting miss is reason to reprice assets. Focus on performance relative to median estimates as a brometer of Biden’s political prospects or as a predictor of Fed policy or as a measure of public welfare has been drummed into us, but it’s cock-eyed. A 199,000 increase in jobs in a single month is happy, happy news, regardless of the median forecast.
Justin Wolfers has always been a big proponent of weighting the two using an 80/20 in split in favor of the establishment series.
@ Macroduck
“His argument for the validity of averaging the two boiled down to the fact that he had credentials.”
I think we both know a guy around the Harrisonburg Virginia locale who often makes these types of arguments. It’s not entirely rare.
https://www.nytimes.com/2019/09/22/business/publishing-books-errors.html
And often the same parties make this error repeatedly by reason of their own arrogance, having an inability to see anything they themselves do as an error.
not to feed your troll, but November JOLTS’s hires minus separations would imply an increase of 424,000 jobs in November, somewhat more than the revised payroll job increase of 249,000 jobs for November shown in December’s Employment situation later in the week….the margin of error on both surveys could cover the difference…