IHS-Markit’s monthly GDP is out, with a 0.1% m/m increase in December. Here are some key indicators followed by the NBER BCDC.
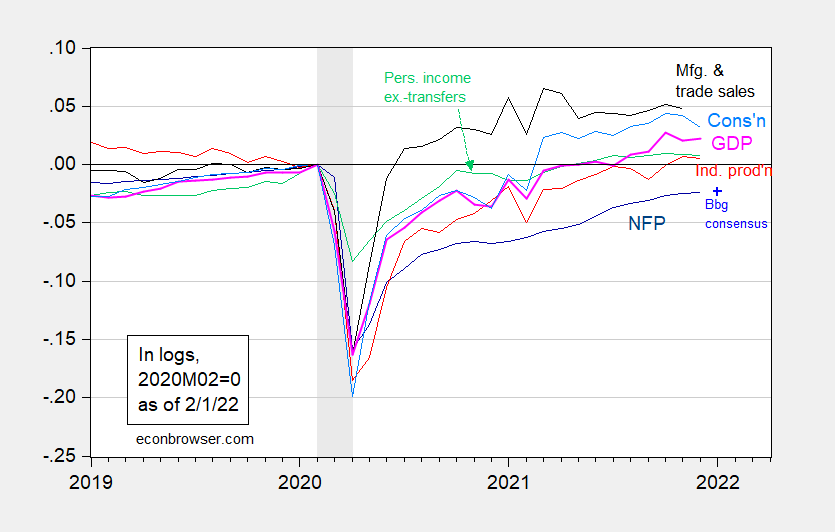
Figure 1: Nonfarm payroll employment (dark blue), industrial production (red), personal income excluding transfers in Ch.2012$ (green), manufacturing and trade sales in Ch.2012$ (black), consumption in Ch.2012$ (light blue), and monthly GDP in Ch.2012$ (pink), all log normalized to 2020M02=0. NBER defined recession dates, peak-to-trough, shaded gray. Source: BLS, Federal Reserve, BEA, via FRED, IHS Markit (nee Macroeconomic Advisers) (2/1/2022 release), NBER, and author’s calculations.
IHS-Markit notes in part:
Monthly GDP rose 0.1% in December following a 0.7% decline in November (revised from -0.8%). The modest increase in December reflected a large increase in nonfarm inventory-building that was nearly offset by a large decline in domestic final sales.
On an annualized basis, GDP fell rose 1.8% in December, but final sales fell so as to contribute -7.3 percentage points of that 1.8 percentage growth. (Inventory accumulation accounted for 9.1 percentage points!)
For context, here’s IHS-Markit’s estimate of monthly GDP and the BEA’s advance estimate for Q4, discussed by Jim in his post last week.
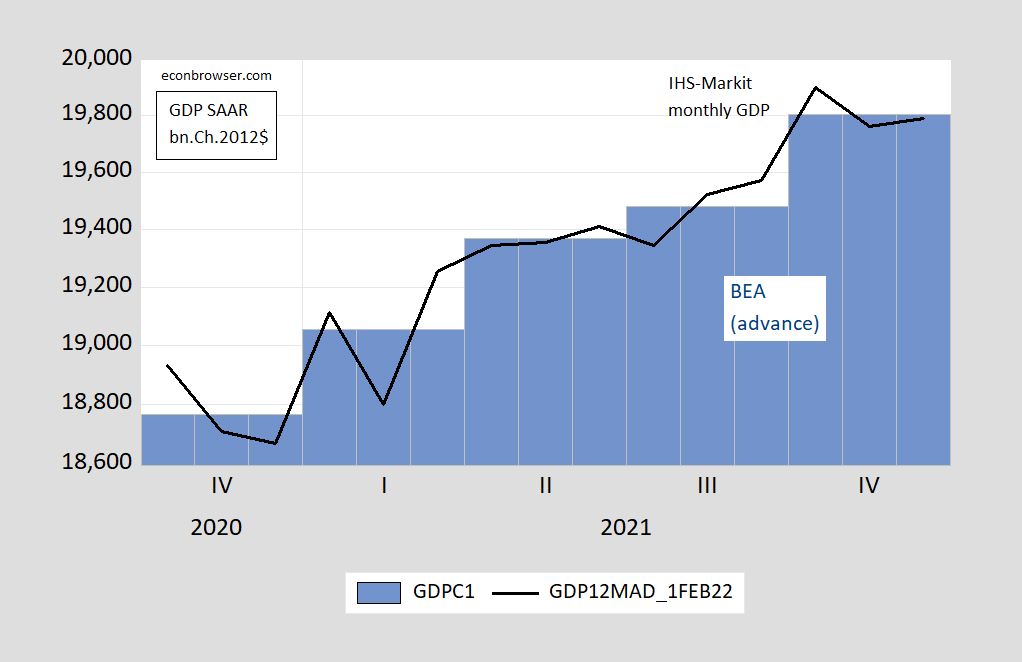
Figure 2: GDP from BEA (blue bar), and from IHS-Markit (black line), both billions Ch.2012$, SAAR. Source: BEA (advance Q4 release), and IHS-Markit (February 1, 2022).
Today’s GDPNow estimate is for 0.1% growth (q/q SAAR) in Q1.
it does not sound like IHS-Markit was figuring for revisions due to this morning’s construction spending report…so fwiw, here’s a copy of what i wrote on that:
Construction spending in December was higher than was estimated by the BEA in their advance estimate of 4th quarter GDP last week, while October’s and November’s annualized construction spending were revised $10.6 billion and $7.6 billion higher respectively…The BEA’s key source data and assumptions (xls) accompanying last week’s 4th quarter GDP report indicates that they had estimated that December’s residential construction would increase by an annualized $1.1 billion from previously published figures, that nonresidential construction would increase by an annualized $1.9 billion from last month’s report, and that December’s public construction would increase by an annualized $0.3 billion from the figures shown in November’s construction spending report….hence, by totaling the changes of those BEA estimates, we find the BEA had estimated December construction spending to be $3.4 higher than previously reported November levels, which have now been revised $10.6 billion higher…since this report indicated that total construction spending for December was $3.4 billion higher than the revised November figure, that means the net of the annualized construction figures used for December in the GDP report was $10.6 billion too low…averaging the differences between the monthly annual rates in this report and those used in the GDP report for the three months of the 4th quarter would mean that this report suggests that construction spending in the 4th quarter GDP report was underestimated by $9.6 billion (at an annual rate), implying an upward revision to the related GDP components at a rate that should result in a net addition of about 0.17 percentage points to 4th quarter GDP when the 2nd estimate is released at the end of the month, an estimate that should be considered very rough, since we have only allowed for an aggregate deflator for the revisions, not one addressing the specific components revised…
BEA’s key source data and assumptions = https://www.bea.gov/sites/default/files/2022-01/GDPKeySource_4q21_adv.xlsx
.averaging the differences between the monthly annual rates in this report and those used in the GDP report for the three months of the 4th quarter: ($10.6 + $10.6 + $7.6) / 3 = $9.6 all nominal billions at an annual rate
I think I asked you this once before and you answered, but i lost track. May I ask again where you do your write ups?? i’m genuinely interested.
It seems like your strong interest is “Fixing” the lags in the data so the data gets matched up in the actual time it occurred?? Am I Wrong on that, or what is your main idea here in the write ups and “disagreeing” (my word, sorry if it misrepresents) with the BEA??
this might be a different answer than i gave you last time, Moses, cause all my work had been cross posted at Econintersect, but the site was bought out by a London outfit who only seems to be posting on cryptocurrencies now…
that said, i post reviews of most regular economic releases here: http://marketwatch666.blogspot.com/
and on upstream oil & gas weekly data here: https://focusonfracking.blogspot.com/
both of those start out as emailed newsletters..
more recently, a lot of my stuff is also being picked up by Angry Bear… ( https://angrybearblog.com/ )
anyhow, i don’t disagree with the BEA on anything (well, maybe on their forcing the contributions of the components of GDP to match the total they arrive at separately); i just try to guess what they’ll report on GDP and income and outlays before they release it..
Appreciate it.
just to clarify what i initially posted here; the BEA publishes the advance estimate of quarterly GDP before the third month construction data is available, so when that construction spending report is published, it constitutes the first big GDP revision of each quarter…that “key source data and assumptions” gives the monthly Census equivalent estimates the BEA used when computing GDP….all i’m doing is comparing that to the revisions, and applying a little sixth grade arithmetic to it…
That helps me grasp it a little better and is also appreciated. Thanks
I pretty casually watch the Fed (more than the average American, sloppily from a peripheral view for someone active in equity/bond markets). It strikes me that the Fed has been all over hell with their signals lately. Something about Bostic saying they might do a 50bps rise?? You wanna run idiot stuff up the flag pole, great. Just please try to make it just one idiot thing at a time.
I think you (or your source) are misrepresenting Bostic’s comments. He mentioned a data-dependent 50bps rise but was Cleese of his expectations for 3x rate hikes at 25bps increments over the year. Overall, he’s saying that the committee is not setting policy on a predetermined path.
https://finance.yahoo.com/news/atlanta-fed-president-raphael-bostic-yahoo-finance-transcript-january-2022-201730701.html?fr=sycsrp_catchall
Fellows – it might help folks if one of you bothered to provide a transcript of what Atlanta Federal Reserve President Raphael Bostic actually said.
He wasn’t just talking at yahoo dear.
I never said this was his only discussion. But YOU never posted a link to what you were claiming. Your laziness is not my fault.
Well, i will say i didn’t see the comment directly with my own eyes. But one day later Bostic was on yahoo, in essence “walking back” his “FT” comments. They apparently thought the market’s reaction was enough to tell him to get his butt out there and bandage it.
https://finance.yahoo.com/news/u-private-jobs-plunged-last-132944066.html
This is a bit weird. A Bloomberg survey of economists puts the median expectation of job increases at 180 thousand but ADP just reported 301 thousand jobs were lost. Month to month data has been insane of late.
Today’s jobs report shows a 301,000 decline vs. estimated 200,000 increase.
Last week, the Consumer Confidence read fell to 67.2.
The USA is still over 3,500,000 jobs short of where the economy was in February 2020, before COVID lock outs.
Labor participation remains depressed.
Perhaps, Fed rate rises and asset run-offs are not ‘cut in stone.’
A matter that might have been considered in asking about an invasion of Ukraine a few days ago; there is an international truce pact that is introduced before Olympic games and such a pact was introduced months before this Beijing Olympics. The truce for those countries who agree, extends from January 28 to March 20. Russia had agreed to the truce, and was surely not about to and will assuredly not dishonor the Beijing Olympics truce agreement.
ltr,
There is a good chance that will hold, and Putinis to be in Beijing tomorrow for the opening. But in 2008 Putin was also in Beijing for the Olympic opening, and that was the very day Russia invaded Georgia.
GDP now completely bombed the 4th quarter. My guess that number will rise as Feb/March figures come out. But they just can’t keep up.
Staten Island Chuck did not see his shadow so an early spring. Oh wait – that groundhog in Pennsylvania did see his shadow. Sort of reminds me of forecasts of jobs growth of late. I just hope my heavy coat survives this winter.
https://news.cgtn.com/news/2022-02-02/Chinese-mainland-records-63-confirmed-COVID-19-cases-17jIbUBBMCA/index.html
February 2, 2022
Chinese mainland reports 63 new COVID-19 cases
The Chinese mainland recorded 63 confirmed COVID-19 cases on Tuesday, with 36 linked to local transmissions and 27 from overseas, data from the National Health Commission showed on Wednesday.
A total of 28 new asymptomatic cases were also recorded, and 810 asymptomatic patients remain under medical observation.
Confirmed cases on the Chinese mainland now total 106,202, with the death toll remaining unchanged at 4,636 since January last year.
Chinese mainland new locally transmitted cases
https://news.cgtn.com/news/2022-02-02/Chinese-mainland-records-63-confirmed-COVID-19-cases-17jIbUBBMCA/img/95f72c1ca9044a1087cf2834afa51c8d/95f72c1ca9044a1087cf2834afa51c8d.jpeg
Chinese mainland new imported cases
https://news.cgtn.com/news/2022-02-02/Chinese-mainland-records-63-confirmed-COVID-19-cases-17jIbUBBMCA/img/8aada5424d34445abec9f551c559484c/8aada5424d34445abec9f551c559484c.jpeg
Chinese mainland new asymptomatic cases
https://news.cgtn.com/news/2022-02-02/Chinese-mainland-records-63-confirmed-COVID-19-cases-17jIbUBBMCA/img/d3dfb32937934901a44bb97f7feae094/d3dfb32937934901a44bb97f7feae094.jpeg
https://www.worldometers.info/coronavirus/
February 1, 2022
Coronavirus
United States
Cases ( 76,516,202)
Deaths ( 913,924)
Deaths per million ( 2,736)
China
Cases ( 106,139)
Deaths ( 4,636)
Deaths per million ( 3)