Nominal and real yields rise, as do inflation breakevens, while yield curve flattens.
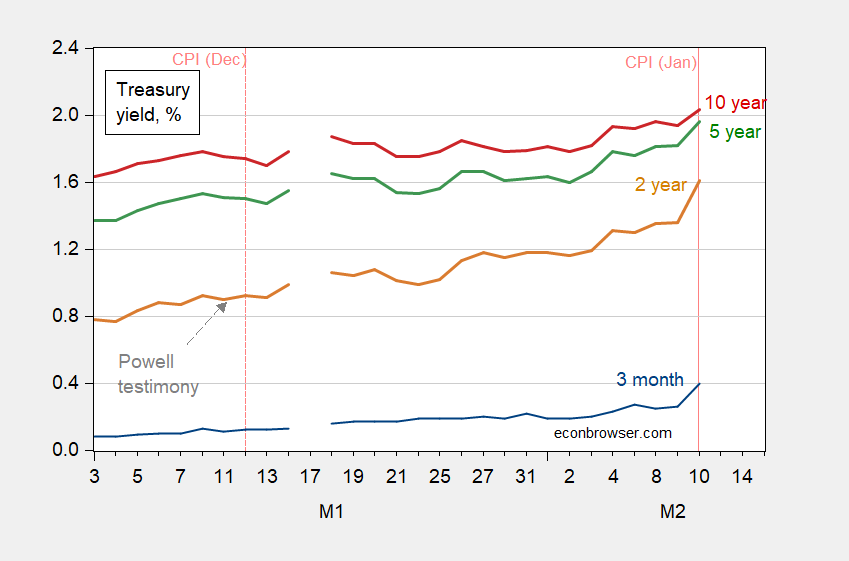
Figure 1: Treasury 3 month yield (blue), 2 year yield (brown), 5 year yield (green), and 10 year yield (red), all in %. Pink dashed lines at CPI release dates. Source: Treasury via FRED.
The sharp jump in yields particularly between 3 months and 2 years suggests a faster increase in short rates than previously anticipated by the market.
At the same time, real rates are rising, as measured by TIPS yields (which recall incorporate liquidity premia).
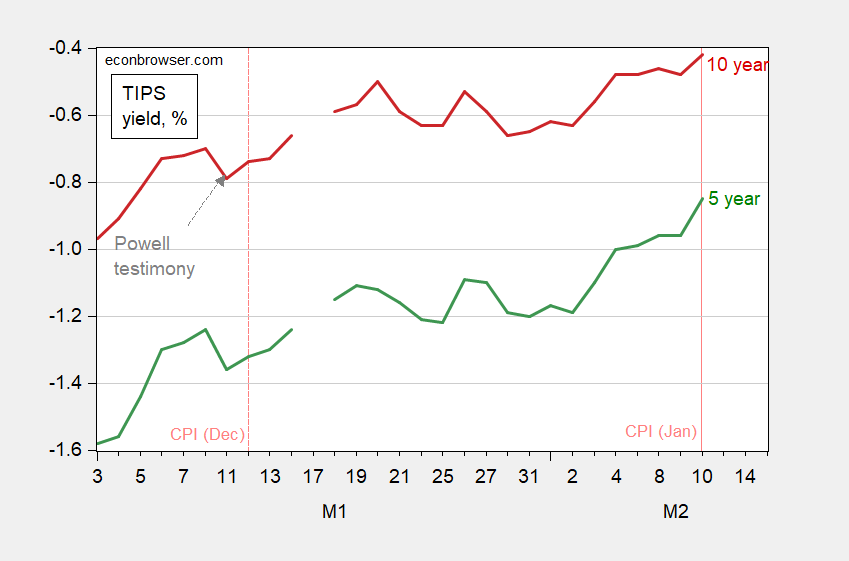
Figure 2: TIPS 5 year yield (green), and 10 year yield (red), all in %. Pink dashed lines at CPI release dates. Source: Treasury via FRED.
Implied expected inflation over the next five years — both current and for five years from now — increased, by 3 bps.
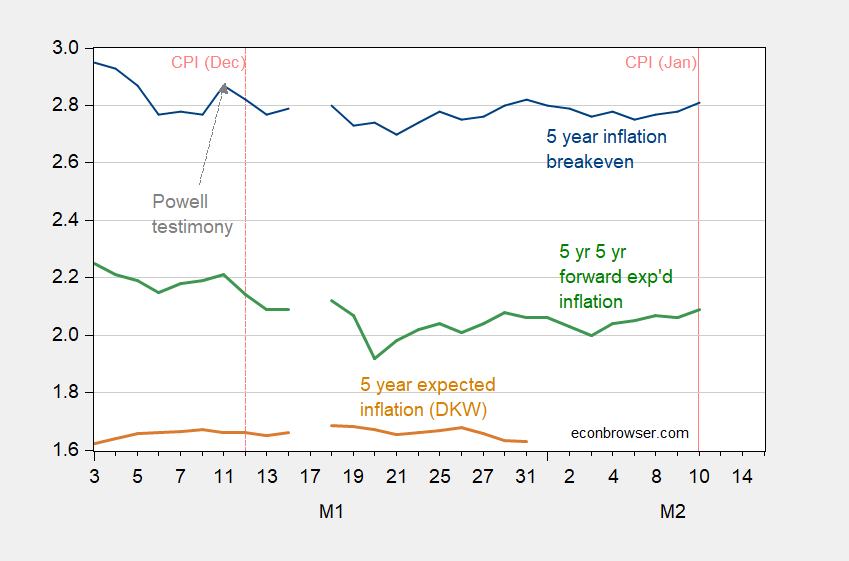
Figure 3: Five year inflation breakeven calculated using 5 year Treasury minus 5 year TIPS yields (blue), five year expected inflation (brown), and five year five year forward inflation breakeven (green). Pink dashed lines at CPI release dates. Source: Treasury via FRED, Kim, Walsh and Wei (2019) following D’amico, Kim and Wei (DKW) accessed 2/10/2022, and author’s calculations.
Given how estimated expected inflation after accounting for risk and liquidity premia (per Kim, Walsh and Wei) differ from the unadjusted inflation breakevens, one has to be cautious about making inferences from these movements, particularly such small ones.
Finally, even with the long yield rising, the term spread shrank by 5 bps.
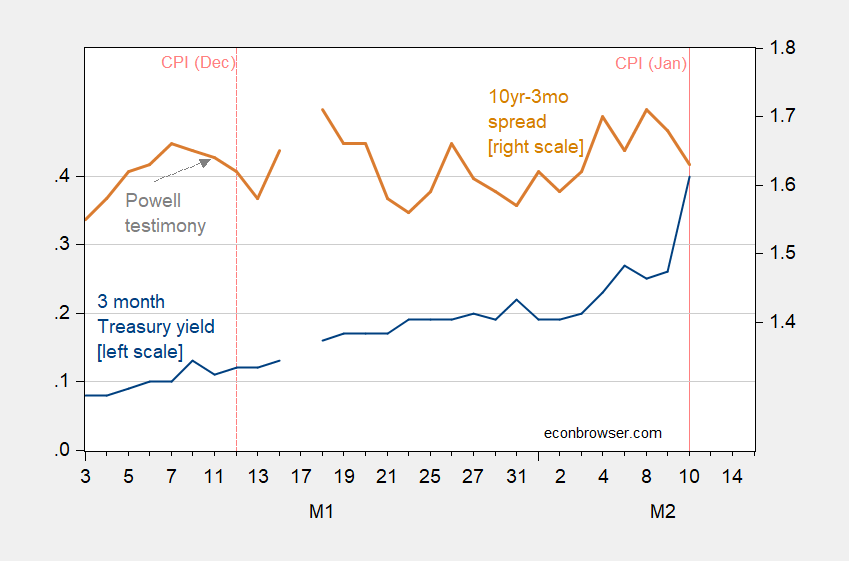
Figure 4: Treasury 3 month yield (blue, left scale), 10 year – 3 month spread (brown, right scale), all in %. Pink dashed lines at CPI release dates. Source: Treasury via FRED, and author’s calculations.
While this yield curve flattening suggests market expectations of deceleration, it needs to be kept in perspective. The current spread is about the same as it was in March of 2021.
What does it mean that the TIPS is negative? Shouldn’t people want a return better than par?
You have never heard of negative real rates? Wake up Rip van Winkle.
It was an innocent naive question. Still have it. What’s the import.
Friday rig count is up.
https://rigcount.bakerhughes.com/na-rig-count
Up 22. Boom baby. Just one week of course. And you get good/bad weeks. But sure helps the average so far this year.
+19 oil, 2 gas, 1 misc…probably geothermal (donno). 7 in the Permian, 4 in Eagle Ford, 3 in the Bakken (go little Bakken!) and 2 in the Marcellus and 2 in OK (one of which in Anadarko).
Good to see my redneck brethren being “undisciplined”. (But actually fits classic economic theory…they are price takers, Saudis are price setters.)
https://twitter.com/MOAR_Drilling/status/1346532124581634053/photo/1
500 oil rigs (600 total, if you figure 100 doing gas) are enough to grow US production at 0.5 MM bopd/year.
~400 (oil directed, so 500 total, if you again figure 100 doing gas) is needed for maintenance.
There’s some diminishing returns, but 650 (oil directed) is probably enough for 1 MM bopd/yr. At 1 MM bopd, you start to impact price. It gets trickier for OPEC (which is a cartel, yes really it is) to hold price.
Right now, we’re at 516 oil, 118 gas. And for all the blabla about shale decline, it’s actually a very small rig count for the amount of production…especially if you look at historical comparisons (back a decade or two or three or four). Especially on the gas side…but even oil. Granted, we do frack stuff like crazy. So rigs are actually delivering more, given the effort put into the ground from fracking.
Why 5-7 Fed rate hikes are on the table, according to J.P. Morgan’s Chair of Global Research (yahoo.com)
Hopefully the link works. Interesting clip.
Apparently Jim Bullard now wants a 50 bps ffr hike in imd-March and a full point by July, although apparently not all of the rest of the Fed ready to go along with that. But he usually gets his way there eventually.
Why is it so hard to see that inflation is irrational noise?
Because most of us buy stuff?
Since you are throwing “irrational” around, mind giving us the definition you have in mind when saying inflation is irrational noise?
Actually, md, rsm likes to think that what he says here is rational noise.
rsm,
Because your statement is simply wrong to the point of embarrassingly worthless.
Money market futures price a 25 basis point hike at 52% odds, 50 bps at 48% at the March meeting. May is priced for 1/3 chance of an increase of 50 bps (25 in March, 25 in May) and 2/3 odds of 75 bps or more (including a 17% chance of 100 bps).
Year-end is evenly split between 150 and 175 bps. Not long ago, money markets were priced for only a 100 bp rise by year-end.
The Fed really has two constraints on its pace of rate hike. One is judgement regarding the economy, the other is judgement regarding financial market stress. Stress measures are tame and markets are pricing in more hikes now than a few weeks ago. That suggests financial market stress is not a big constraint for now.
Amazing how volatile the probabilities are. Yesterday the ending probability for a 50-75 basis point increase was 93.8%.
https://www.cmegroup.com/trading/interest-rates/countdown-to-fomc.html
AS,
I think people have heard about Bullard’s remarks. He really is the key driving individual at FOMC, even when he is not a voting member.
It’s much more apt to be several quarter point rises by year end (this obviously includes March). And just because Bullard gave you the time off his wristwatch once does not mean he’s a heavy hitter at the Fed, if he was he’d have gotten other titles by now.