With the release of industrial production (1.1% m/m vs. 0.5% Bloomberg consensus; mfg 0.8% vs. 0.4% consensus), we have the April reading for another key indicator followed by the NBER BCDC.
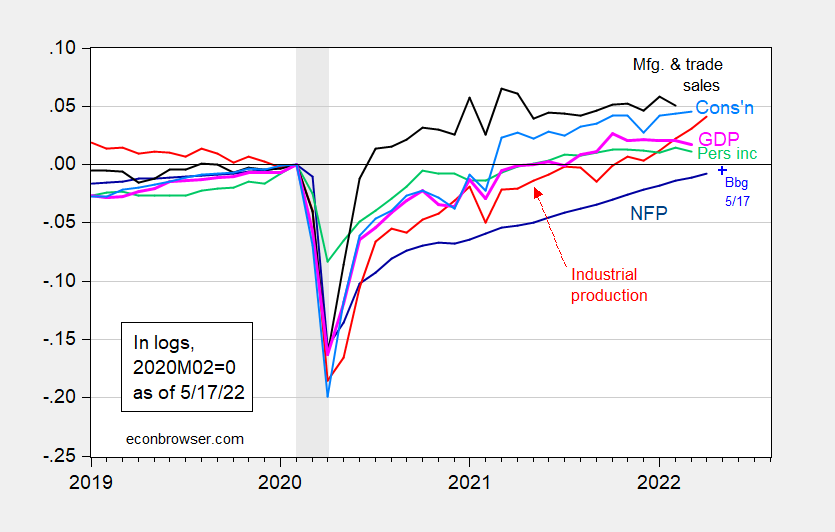
Figure 1: Nonfarm payroll employment (dark blue), industrial production (red), personal income excluding transfers in Ch.2012$ (green), manufacturing and trade sales in Ch.2012$ (black), consumption in Ch.2012$ (light blue), and monthly GDP in Ch.2012$ (pink), all log normalized to 2020M02=0. NBER defined recession dates, peak-to-trough, shaded gray. Source: BLS, Federal Reserve, BEA, via FRED, IHS Markit (nee Macroeconomic Advisers) (5/2/2022 release), NBER, and author’s calculations.
We also had retail and food service sales figures for April released today (0.9% m/m at consensus). Retail and food service sales are not core series followed by the NBER BCDC (at least in previous years), but they can — and are — used to inform views about consumption. I use the relationship in log differences between consumption and CPI-all deflated retail and food services sales to predict April consumption. I also use log differences of retail sales (deflated by PPI finished goods) to predict March and April manufacturing and trade industry sales. This yields the following picture.
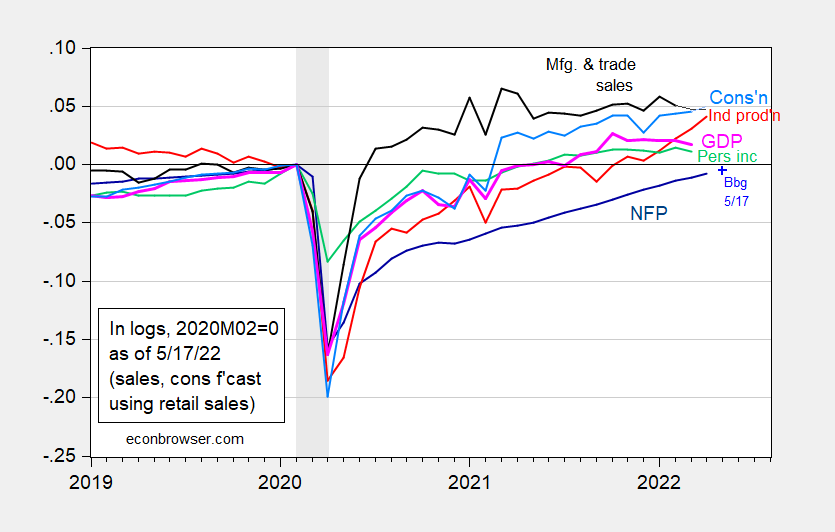
Figure 2: Nonfarm payroll employment (dark blue), industrial production (red), personal income excluding transfers in Ch.2012$ (green), manufacturing and trade sales in Ch.2012$ (black), estimated sales for March and April (light black), consumption in Ch.2012$ (sky blue), estimated consumption for April (light blue_ and monthly GDP in Ch.2012$ (pink), all log normalized to 2020M02=0. NBER defined recession dates, peak-to-trough, shaded gray. Source: BLS, Federal Reserve, BEA, via FRED, IHS Markit (nee Macroeconomic Advisers) (5/2/2022 release), NBER, and author’s calculations.
Bottom line: The US economy appears to continue to grow in April, despite negative q/q official GDP growth in Q1.
The m/m growth rates of the extrapolated series and the extrapolating series are shown in Figure 3.
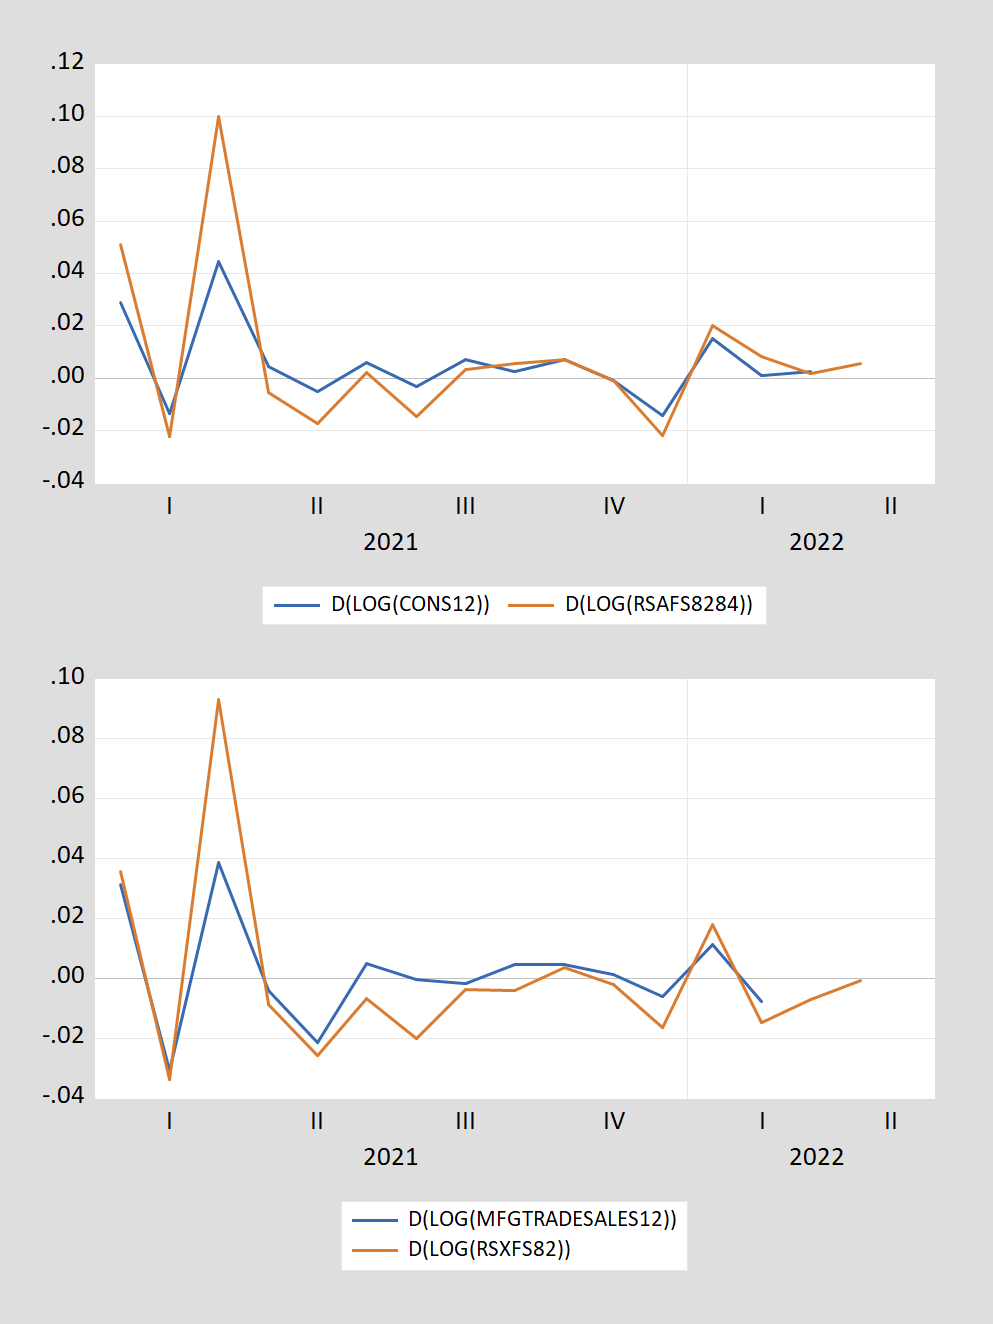
Figure 3: Top panel, m/m growth rate of consumption and of total retail and food service sales (deflated using CPI). Bottom panel, m/m growth rate of manufacturing and trade sales and retail sales (deflated using PPI finished goods). Source: Census via FRED, BLS, and author’s calculations.
Professor Chinn, I wonder if you could comment on the Retail Trade Group data reported quarterly by the BEA, FRED series: USRETAILRQGSP. The data series appears to be stated in 2012 chained dollars.
The group reports the categories shown below.
Industries within Sectors 44 and 45 – Retail Trade
NAICS 441000 – Motor Vehicle and Parts Dealers
NAICS 442000 – Furniture and Home Furnishings Stores
NAICS 443000 – Electronics and Appliance Stores
NAICS 444000 – Building Material and Garden Equipment and Supplies Dealers
NAICS 445000 – Food and Beverage Stores
NAICS 446000 – Health and Personal Care Stores
NAICS 447000 – Gasoline Stations
NAICS 448000 – Clothing and Clothing Accessories Stores
NAICS 451000 – Sporting Goods, Hobby, Musical Instrument, and Book Stores
NAICS 452000 – General Merchandise Stores
NAICS 453000 – Miscellaneous Store Retailers
NAICS 454000 – Nonstore Retailers
The Y/Y percent went negative in 2021 Q3 and stayed negative in 2021Q4.
Professor Chinn,
I assume the log difference D(LOG(CONS12)) for consumption is equivalent to dlog(PCEC96/12). But I cannot properly interpret D(LOG(RSAFS8284)). I thought it might use the average of the CPI All index for 1982 to 1984, but that average is about 100, so seems unlikely. Dividing RSAFS by 288.663, the CPI All index for April 2022 does not seem to show the exact curve in your graph.
AS: Unless I did something wrong (could’ve happened), take FRED series RSAFS multiply by 100, divide by CPIAUCSL. Then take first difference of logged values.
Thanks,
That the answer. I think I was incorrectly trying to state RSAFS in current 2022 M04 dollars prior to taking the log difference.