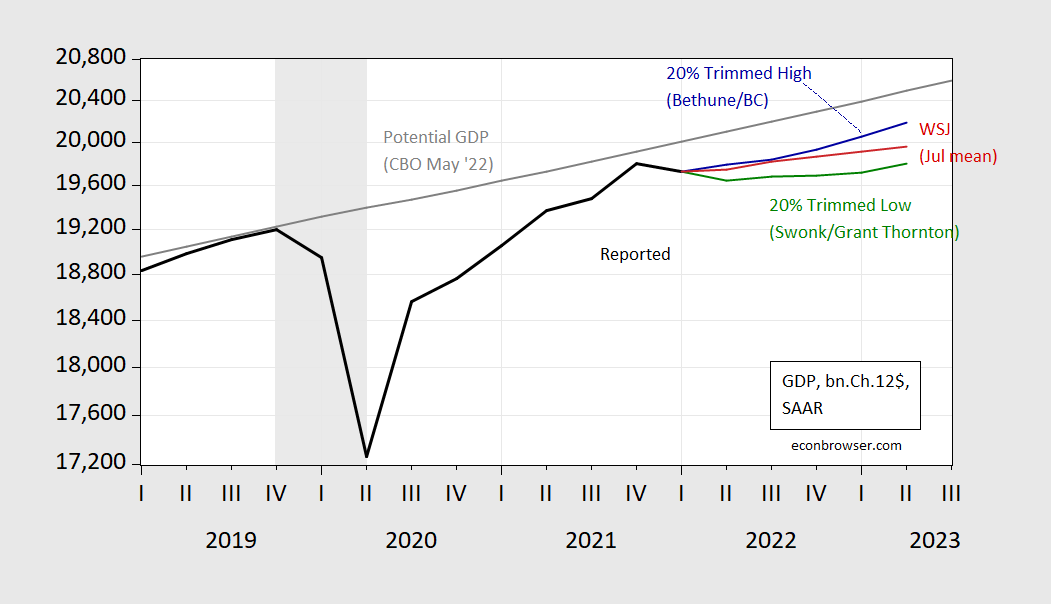
Forecasters are downbeat relative April survey (Figure 1). And about a third forecast negative Q/Q growth in 2022Q2, but the mean (and median) forecast is for positive growth, as shown in Figure 2 (though there being two consecutive quarters of negative growth are not central to determining whether NBER BCDC declares a recession). About a fifth of respondents predict at least two consecutive quarters of negative growth starting later in 2022-23.
Figure 1: GDP as reported in 2022Q1 third release (black), WSJ January survey (green), April survey (tan), July survey (red), potential GDP (gray), all in billions Ch.2012$, SAAR, all on log scale. NBER defined peak-to-trough recession dates shaded gray. Source: BEA, CBO (July, 2022), WSJ survey, various vintages, NBER and author’s calculations.
The January WSJ survey placed output rising fairly smartly, rising above potential (as estimated by CBO in May). By April’s survey, a little over a month after the expanded Russian invasion of Ukraine and commensurate surge in oil prices, the trajectory was lowered somewhat. As of July’s survey, a substantial drop in the trajectory is predicted by the mean response, with an implied output gap widening to -2.6% by 2023Q2 (based on CBO’s estimate of potential, not the survey respondent’s).
There is some notable dispersion in forecasts. This is hinted at in Figure 2, which shows the 20% trimmed upper and lower observations (ranking based on the 2022 Q4/Q4 growth rate).
Figure 2: GDP as reported in 2022Q1 third release (black), Diane Swonk/Grant-Thornton (green), Brian Bethune/Boston College (blue), July survey mean (red), potential GDP (gray), all in billions Ch.2012$, SAAR, all on log scale. NBER defined peak-to-trough recession dates shaded gray. Source: BEA, CBO (July, 2022), WSJ survey, NBER, author’s calculations.
The mean response implies positive growth in Q2. The median (not shown) looks similar for 2022, (although the median respondent also believes that there will be two quarters of negative growth, starting in 2023Q1).
Brian Bethune at Boston College is at the top of the 20% trimmed sample, with 2% for 2022 Q4/Q4). Diane Swonk at Grant Thornton predicts a negative reading on Q2 growth (-1.7% SAAR), with lackluster growth thereafter, so that 2022 Q4/Q4 growth is only -0.5%.
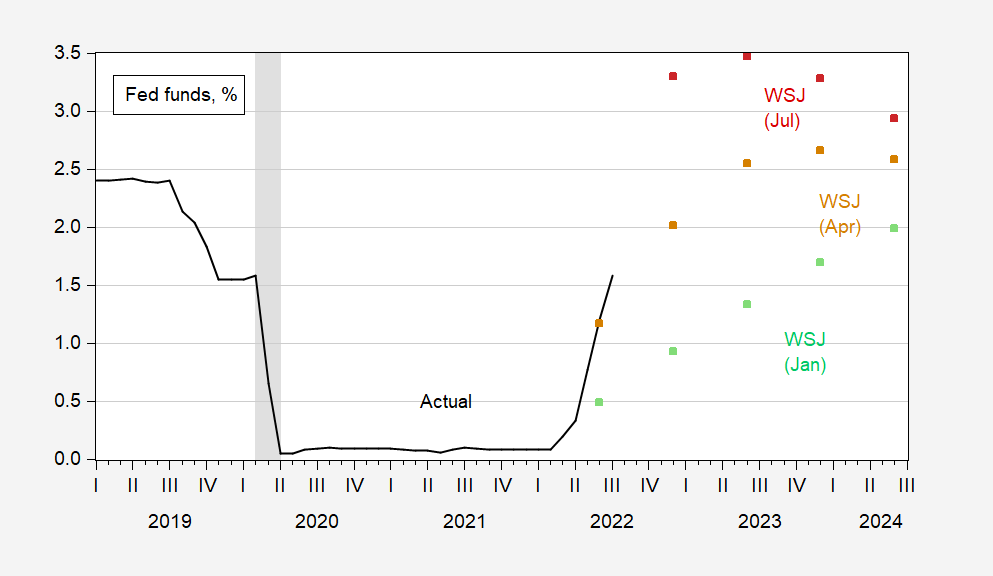
The downgrading of growth prospects is unsurprising; the narrative of rising Fed funds rate to reduce perceived inflationary pressures shows up in the forecasts for interest rates:
Figure 3: Effective Fed funds rate (black), WSJ January survey (green ssquare), April survey (tan square), July survey (red square), all in %. NBER defined peak-to-trough recession dates shaded gray. Source: Federal Reserve via FRED, WSJ survey, various vintages, NBER.
More discussion of the survey results in the WSJ article.


Repeaing myself, but I’m interested to know how forecasts stand up against outcomes. The folklore is that recessions aren’t easy to get right. The recession expected next year has been called “the most widely anticipated recession in history” but that doesn’t make it a recession, contrary to the stated view of some of our commenters.
So, does having a negative 20%-trimmed-low end of the estimate range tell us anything about the odds of recession? Is there information value in that fact, or just healine value?
I think the biggest problem with economic forecasts is that they have to make a lot of presumptions. The forecasts from before Russia invaded Ukraine may have been perfectly good models that would have hit a bullseye – but now they are way off. Not because there was anything wrong with the models, but because a unpredictable but important economic events happened. Also things like the collapse of Bitcoin – although it was predictable that trillions would be lost in those Ponzi scams, the timing was very hard to predict. Panic is another major parameter that influence the outcomes yet cannot really be included in the predictive models. Although we know people will panic we have no way of predicting exactly when and how bad. Rather than simply looking at previous performance I would ask why did the model fail – what was it that made reality stray from prediction. If the delta is explainable by things that could not be predicted – then its still a pretty good model.
Swings in real income can lead to bad results. Vehicle repossession is on the rise. Stupidly, some of the repos are for vehicles with loan-to-value ratios of 120%. Who lends 120% of the sticker price? Hope they end up eating a loss.
https://www.autoblog.com/2022/07/11/car-repossessions-on-the-rise/
I have suspected for the longest time, clear back to the days I was in high school that auto-dealerships intentionally get their customers into negative equity situations with their cars. They get the loan payments for an extended period of time, then get all of the equity back on the car/vehicle when customers can’t make consistent payments. This is why so many of them are so eager to get the financing on the cars/loans instead of the purchaser getting the loan through a bank or a credit union (which would give them a better rate 98% of the time) I think people would drop over dead in shock if they knew how much of auto dealerships’ profits come from financing alone.
https://www.realcartips.com/newcars/135-how-car-dealers-really-make-money.shtml
https://www.forbes.com/sites/jimhenry/2012/02/29/the-surprising-ways-car-dealers-make-the-most-money-off-of-you/?sh=6617cbb71e6f
Then of course they raise their forecasts by the winter once it’s clear those figures are wrong and underlying causes reverse. Data accumulation is flawed by its nature.
Auto repo data are flawed?
“The downgrading of growth prospects is unsurprising; the narrative of rising Fed funds rate to reduce perceived inflationary pressures shows up in the forecasts for interest rates:”
If I’m reading your earlier graphs right – the FED has accomplished the task of reducing GDP to the point that it will not exceed potential output. So mission accomplished – no more tight money please.
And let’s note that the Federal Funds rate has not and will not rise by 7% as Princeton Steve claimed under that earlier post. Yes once again – he sees a graph he does not understand goes off on another one of his patented rants.
Women who have endured miscarriages need medical treatment that is now banned by the states with strict anti-abortion laws:
https://www.msn.com/en-us/news/us/they-had-miscarriages-and-new-abortion-laws-obstructed-treatment/ar-AAZGcue?ocid=msedgdhp&pc=U531&cvid=c4fa964fba7f421092e545690805d66c
Eight months later, in January, Amanda, who asked to be identified by her first name to protect her privacy, experienced another first-trimester miscarriage. She said she went to the same hospital, Baylor Scott & White Medical Center, doubled over in pain and screaming as she passed a large blood clot. But when she requested the same surgical evacuation procedure, called dilation and curettage, or D&C, she said the hospital told her no. A D&C is the same procedure used for some abortions. In September 2021, in between Amanda’s two miscarriages, Texas implemented a law banning almost all abortions after six weeks into pregnancy.
Following the reversal of Roe v. Wade, numerous states are enacting bans or sharp restrictions on abortion. While the laws are technically intended to apply only to abortions, some patients have reported hurdles receiving standard surgical procedures or medication for the loss of desired pregnancies.
The anti-choice zealots have passed laws that will unnecessarily kill many women. Are these zealots this incredibly stupid or do they just not care who dies?
in texas, there are medical centers that will no longer treat pregnant women because of the abortion law. this is becoming very problematic. but a bunch of white males in the texas legislature do not seem overly concerned about women’s medical care in the state of texas.
so in Ohio, a raped 10 year old should be forced to carry the baby to term. and in texas, pregnant women are now on their own if they have medical issues. this is what compassionate conservatism looks like.
Sounds like Rishi Sunak will most likely be Boris Johnson’s replacement, hard to believe it wouldn’t be anything but an improvement.
for those who supported Brexit, did you expect any other outcome than Boris becoming a joke?
Nobody could li more than Boris, but my (limited) understanding is that the leading candidates, including Sunak, are either more right-wing-fringier than Boris, or are pretending to be. The UK and U.S. have that in common.
Below is a summary of the data for the subcategories making up GDP. I looked at the quarterly data and made ARIMA forecasts for the categories. For personal income the monthly series PCEC96 was used to forecast PCECC96. I thought it was interesting how close the forecast comes to using the mountains of data in the GDP Now forecasts.
The forecast using the subcategory data for 2022 Q2 shows a forecast of 16,626 billion chained 2012 dollars or a -2.1% annualized change.
The quarterly compound annualized changes for the categories are shown below.
Real personal consumption (FRED series, PCECC96), 0.6%
Real gross private domestic investment (FRED series, GPDIC1), -1.8%
Real exports (FRED series, EXPGSC1), -3.5%
Real imports (FRED series, IMPGSC1). 7.4%
Real Government Consumption Expenditures & Investment (FRED series, GCEC1), -2.6%
what happens in the midterms if inflation falls through the remainder of the year, gas starts to push $3 a gallon, and we never enter a recession?
https://www.cnn.com/2022/07/18/investing/premarket-stocks-trading/index.html
banks indicate we are not in a recession right now. and we do not seem to be going into a recession anytime soon.
there is a reason a select group of people want so much to push the recession narrative…
“there is a reason a select group of people want so much to push the recession narrative”
Yea – getting an invite to appear on Fox and Friends would be the crown jewel of their pathetic lives.