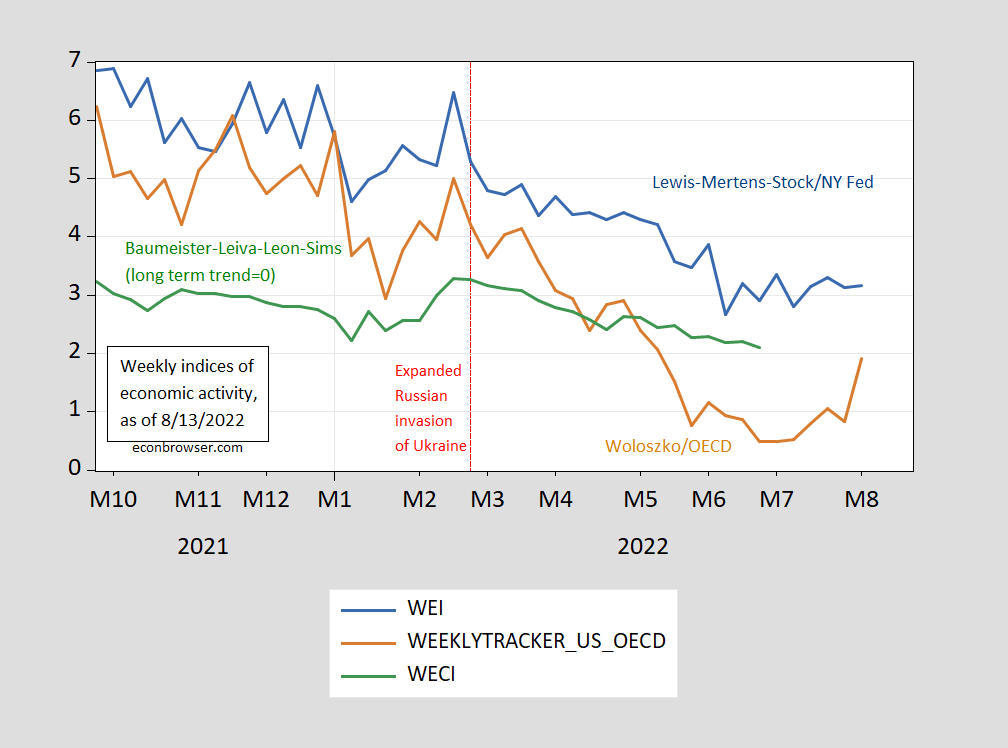
Here are the Lewis-Mertens-Stock Weekly Economic Index (NY Fed) and the OECD Weekly Tracker, covering data through August 20.
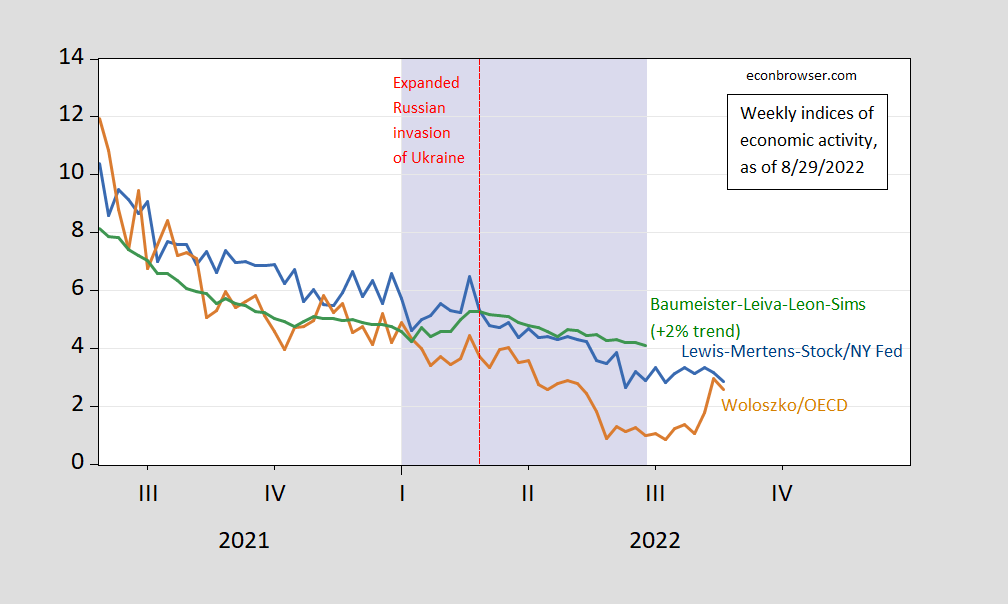
Figure 3: Lewis-Mertens-Stock Weekly Economic Index (blue), OECD Weekly Tracker (tan), Baumeister-Leiva-Leon-Sims Weekly Economic Conditions Index for US plus 2% trend (green) Lilac shading denotes a hypothetical H1 recession dates. Source: NY Fed via FRED, OECD, WECI, and author’s calculations.
The WEI reading for the week ending 8/20 of 2.8 is interpretable as a y/y quarter growth of 2.8% if the 2.8 reading were to persist for an entire quarter. The OECD Weekly Tracker reading of 2.6 is interpretable as a y/y growth rate of 2.6% for year ending 8/20 (note the Tracker previous tracker reading for 8/6 has been revised to 1.1, so there is a noticeable jump from week ending 8/6 to week ending 8/20). The Baumeister et al. reading of 2.1% for the week ending 6/25 is interpreted as a 2.1% growth rate in excess of long term trend growth rate. Average growth of US GDP over the 2000-19 period is about 2%.
Still wondering if China and Europe might drag the USA economy down, if under different external/global circumstances the USA avoids ’23 recession.
That’s the closest thing I have to a “half-theory’ on macro picture ATM.