Employment (NFP, private NFP) exceeds consensus slightly The recession is not here as far as I can tell. Nor does it seem to have been here in H1.
First consider the nonfarm payroll employment level measured in three ways:
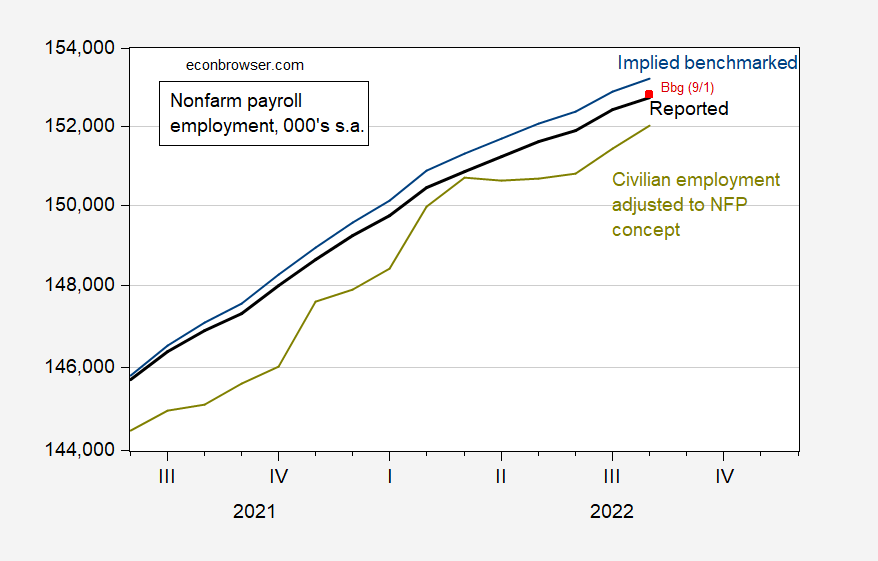
Figure 1: Nonfarm payroll employment as reported (black), Bloomberg consensus as of 9/1 (red square), nonfarm payroll employment incorporating preliminary benchmark revision (teal), and civilian employment adjusted to nonfarm payroll concept (chartreuse), all in 000’s, s.a. Bloomberg consensus assumes no revision to previous months data. Source: BLS via FRED, BLS, Bloomberg, and author’s calculations (see post).
While the NFP series was revised downward over the preceding two months, it was still continuing to rise throughout the months in which some observers have claimed there was a recession. One could fault the establishment survey, upon which the NFP series is based, because of a faulty birth/death model. In fact, it was allegations that the birth/death model understated firm growth (and hence employment level estimates during the GW Bush years) that drove in part the development of a household survey based measure adjusted to the NFP concept. This issue is discussed in detail here.
Another point – the benchmarking of the the level of employment involves use of the Quarterly Census of Employment and Wages, which in turn should account for the near-exact number of firms in the economy. The preliminary benchmark lifted the level of employment for March 2022, which I’ve incorporated into the NFP series graphed above (as Implied Benchmarked). I wedged in the increase into the previous twelve months, then assumed increases per the reported NFP from April onward (see this post).
Since the household survey measure of employment does not involve the birth/death model for firms, that series should be immune to mismeasurement of that type (it’ll have greater measurement error due to the smaller sample size, though). On a quarter-on-quarter basis (i.e., 3 month change on monthly data), no series has registered negative growth. Only on a month-on-month basis did one series (the household series) show negative growth (in April), equaling a -0.5% annualized growth rate. To put this into context, the standard deviation of m/m changes annualized is around 3.9 percentage points over the period 2021M06-22M08 (all percentages calculated in log terms).
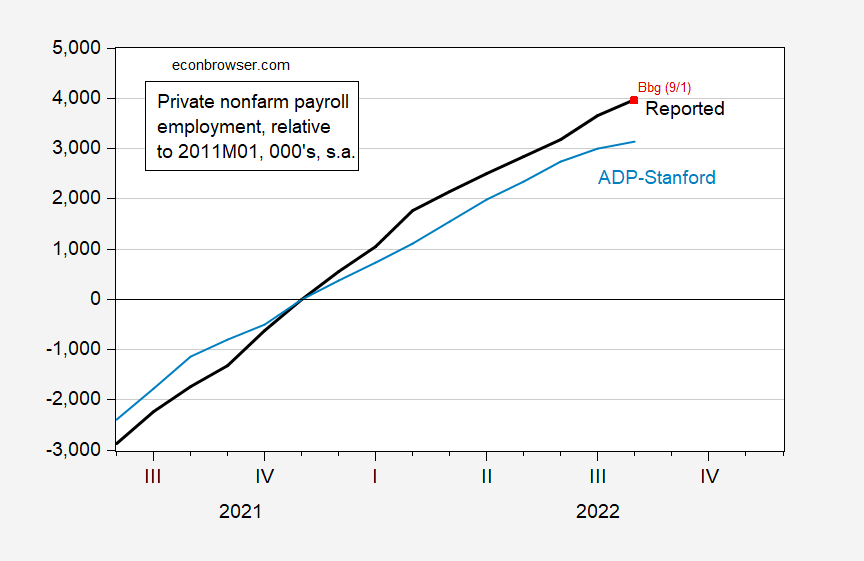
What about completely independent measures of employment growth. The newly revised ADP-Stanford Digital Economy Lab measure registered slower growth than the BLS series (see discussion here). However, it was still rising.
Figure 2: Private nonfarm payroll employment as reported (black), Bloomberg consensus for BLS series (red square), nonfarm payroll employment from ADP-Stanford Digital Economy Lab (light blue), all in 000’s, s.a. Bloomberg consensus assumes no revisions to previous months data. Source: BLS via FRED, ADP, Bloomberg, and author’s calculations (see post).
The BLS series was rising q/q annualized 3.5% vs. ADP-Stanford’s 2.6%.
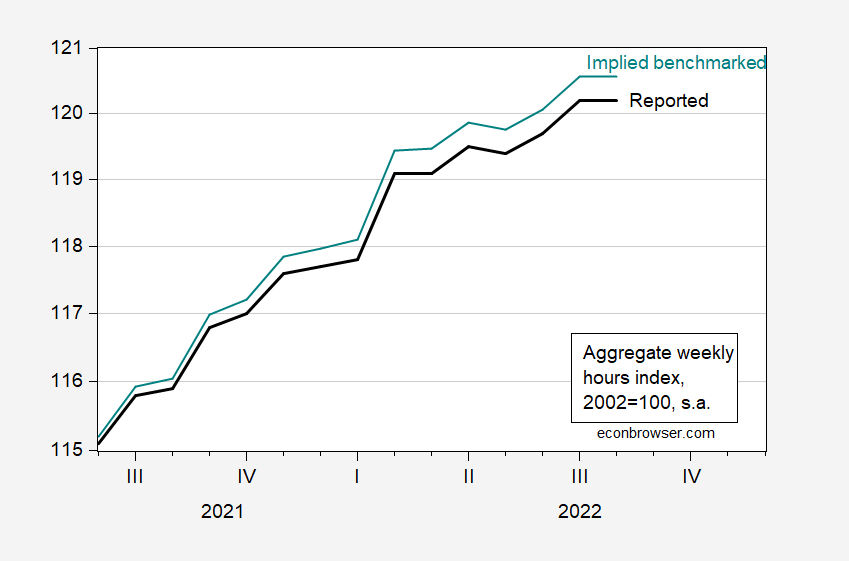
Finally, what about aggregate hours worked. Here’s a picture of that series, including one adjusted for the preliminary benchmark.
Figure 3: Aggregate Weekly Hours Index as reported (black), incorporating preliminary benchmark revision (teal), 2002=100, s.a. Source: BLS via FRED, and author’s calculations (see post).
While aggregate weekly hours are not rising all the time, the are generally up over the past year. Interestingly, there is a big jump in January 2022, right in that period when some observers have argued a recession was beginning.
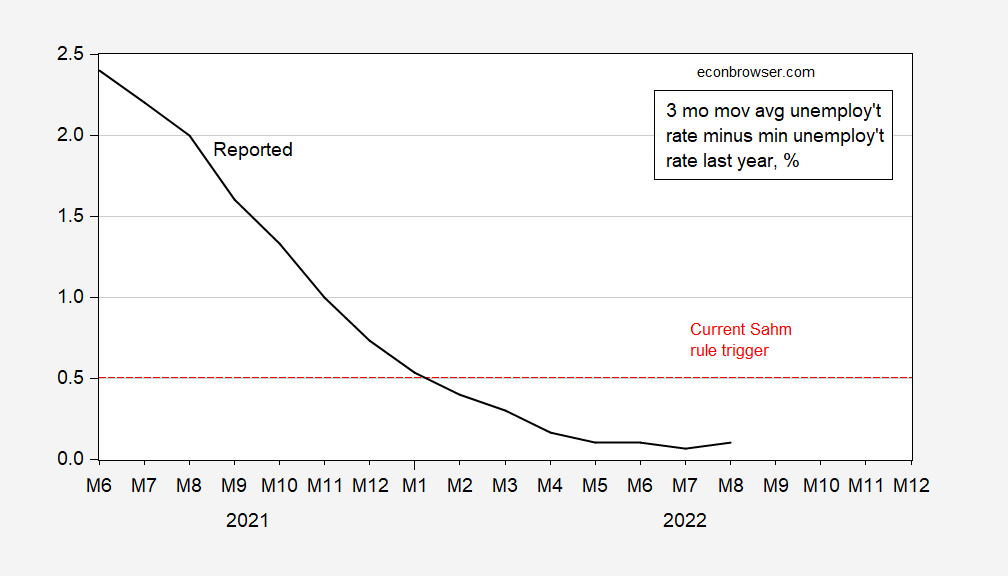
Finally, does the Sahm rule indicate a recession has started (this is usually interpreted as a coincident, not leading, indicator).
Figure 4: Three month trailing moving average of unemployment rate minus minimum unemployment rate in preceding year (3.5%) (black), and trigger value of 0.5% (red dashed line), both in %. Source: BLS via FRED, and author’s calculations.
Note that we are nowhere near the trigger value of 0.5% in the above graph. Nor have we been. (relatedly, see Paweł Skrzypczyński’s post).


The Sahm rule – Note that we are nowhere near the trigger value of 0.5% in the above graph. Nor have we been.
YEA but you are forgetting the Princeton Steve rule – which is basically search every possible number that one can misrepresent and report only what suggests that the economy is “cratering”.
Menzie, remember, when the troll choir finds crazy reasons to say the U.S. is in recession and you point out why they’re wrong – on an economics blog – that means you’re desperate.
MD,
No no no. It means that Menzie has this really enormous ego, almost as big as mine, :-).
Really?? None of us noticed Professor Chinn’s ego even approached yours. That was a really nice effort at equivalency though.
Moses,
I was mocking the people here who like to obsess about Menzie’s supposed large ego. I have elsehwere sharply crirtiized them when they have done so, making it clear as somebody who actually knows Menzie personally that he is not egotistical.
But you are such a stupid liar you are explicitly ignoring that. What a worthless piece of garbage you are, Moses, really.
Isn’t it strange that Macroduck expressed the same sentiments about “Rick Stryker”, Bruce Hall, Kopits and those type complaints on the blog in a way which didn’t circle around back to himself?? I wonder why that is??
Macroduck and I both noted how employment per the household survey rose even more than the reported increase in the payroll survey pushing up the employment to population ratio from 60.0% to 60.1% (another JohnH claim debunked). But wait – the unemployment rate rose. What’s up?
Janet Yellen was interviewed and she noted the increase in the labor force participation rate – which rose for both men and women. So more people are coming back to the labor force which she noted might temper the labor market shortages helping to lower inflation.
She noted in particular how Labor Force Participation Rate – Women has almost reached its pre-pandemic levels:
https://fred.stlouisfed.org/series/LNS11300002
That would be a very good thing.
Employment level is 0.17% since March. Sure, it rose…a trivial amount…but is essentially flat.
https://fred.stlouisfed.org/series/CE16OV
The level is 0.17%. Level v. rate of change? Lord – you are even dumber than Bruce Hall. But gee – an economy that is at potential or even beyond is not seeing employment growth = 10% per year? RECESSION!
https://fred.stlouisfed.org/series/CE16OV
This household survey measure of employment shows an increase over 5.2 million over the last year. Only the dumbest troll ever would say this is an indication we are in a RECESSION. And right on cue here comes Princeton Steve’s BFF!
I just noticed something about the employment to population ratio which is slightly higher than it was in March. It is up for the ladies over this period but it has dropped a wee bit for the men. I would call this noise in the data but something tells me that our usual racists like Tucker Carlson and his favorite viewer (Bruce Hall) will turn this into one of their replacement theory conspiracies.
pgl,
“ladies”? Does this mean that Moses is blackmailing you by threatening to reveal your actual ID and work place? Please do not start telling us how hot Janet Yellen is or making up weird nicknames for prominent women you do not like.
Folks, I know…….. it makes me melancholy also. But the above comment is all a PhD from half a century ago seemingly gets you. Apparently Barkley’s parents gave him the idea that negative attention was better than no attention at all, so here we are.
Hey, Mose, you are the one one who goes on and on about women being hot here, although you have cut that out mostly more recently since Menzie made it clear he did not approve. But you still the one who makes up weird nicknames for prominent women you do not like as you relentlessly attack them with these attacks being way off-topic. It is not me engaging in this nauseating conduct.
My parents would have no problem with my conduct, but how would yours think of yours? Would your mother approve of your ridiculous attacks on Pelosi, Warren, Harris, Clinton, and others?
Since May 27’th China has reported 19,612 diagnosed cases of Covid but not a single death. That is a miracle. UNBELIEVABLE. Yes literally, UNBELIEVABLE
https://www.worldometers.info/coronavirus/country/china/
ltr must reveal the brilliant strategies in medicine and record keeping that allows for such unprecedented success in fighting what in the rest of the world is a deadly virus killing about 1 out of every 500 diagnosed.
Also please explain the brilliance of dear leader’s policy to shut down the economy in an attempt to fight a pandemic that is much less deadly than the annual flue?
“Also please explain the brilliance of dear leader’s policy to shut down the economy in an attempt to fight a pandemic that is much less deadly than the annual flue?”
that is true for people with one of the western vaccines. china has distributed a billion doses of a much less effective vaccine. that is why they cannot reopen. the strange thing is their unwillingness to distribute better vaccines. do they feel it would admit failure on the medical front? at least, ltr can declare these as racist comments in response.
But the Chinese vaccine is so good they don’t have a single death in 3 months after almost 20K new diagnosed cases. None of the western countries have vaccines with such a fantastic reported efficiency.
The reason China is clinging to its fiasco of a vaccine is that they used it as a propaganda tool. They couldn’t stop talking about how much better their vaccine was and how they distributed to the whole world, etc. They are now close to developing their own RNA vaccine, but that is a long delay, just to satisfy national vanity.
It would be interesting if you took this civilian employment adjusted to nonfarm payroll graph and the payroll employment graph further back in time. You were making the point to JohnH and his RECESSION cheerleader nonsense that I noticed back in the Bush43 years. Which is while the household survey employment figure is a lot more volatile than the payroll survey figure, if we look at the two over a 12 month period, their annual increases tend to be a lot closer than their month to month changes.
That the household survey had shown less employment growth for the past few months should have told most people that this month’s household survey increase might be more than the payroll survey increase, which is what happened. But what happened was the opposite of what Know Nothing JohnH was predicting just yesterday.
The reported change in nonfarm payroll for August 2022 was 215k.
The Bloomberg consensus forecasted a change of 300k.
The Econoday consensus forecasted a change of 293k with a range of 200k to 390k.
At a forecasted change of 362k I managed to get within the Econoday range, but no cigar.
Question for readers: Is there a data series released showing new claims for unemployment insurance
by job category? FRED shows series, ICSA, for total new claims and also shows data by state, but not by job category. My guess is that no data are released for new claims by job category.
Oops. actual showed a change of 315K.
AS,
I would never discourage anyone from looking – it’s amazing what data you can find. That said, I’ve been unable to find joblesss claims data by sector. There is, of course, unemployment data by industry:
https://www.bls.gov/web/empsit/cpseea31.htm
You probably knew that.
MD,
Thanks.
The reason I want new claims by job category, such as “hospitality” or FRED series, USGOOD is that the new claims data are released weekly and culd help as a regressor.
@ AS
I think this is (kinda, not really) the data you’re looking for, but it’s not gonna help you on your forecasting, because the most recent data only goes up to July. I wouldn’t give up looking, i’d stay stubborn and keep hunting for more recent UI job category data, but this is probably the best this simpleton can do for you:
https://oui.doleta.gov/unemploy/content/chariu2022/2022Jul.html
Good luck friend!!!!
Moses,
Thanks.
I had spotted the website but did not dig deep enough to find the table you linked.
The problem is that the data are not summarized by month for total claims by job classification.
So to use a cliché, the data is not granulated enough?? Those categories are too broad I guess?? It’s the best I could find. Hope the data is out there somewhere, I’m lost where to look. Maybe some private firm knows. Did you try a key word search with “IHS Markit”?? That might also be worth a try. They seem to be the best in the forecast game, and if you are wanting this data there’s a good chance they have also tried to produce or ferret out this same data.
I have always wondered whether Trump’s sons were retarded. This seals it for me:
https://www.msn.com/en-us/news/politics/trump-jr-melts-down-over-mar-a-lago-scandal-the-fbi-wants-to-persecute-your-grandmother/ar-AA11n0qD
During an appearance on Charlie Kirk’s show, Donald Trump Jr. gave his thoughts on his fathers most recent legal troubles, saying that the FBI’s search of Mar-a-Lago last month was a clear “tactic to intimidate a political enemy.” Trump Jr. went on to say that the photo released by the Justice Department showing recovered classified documents strewn out on the floor of Donald Trump’s Palm Beach resort was “staged.” “This is an absolute farce. It’s absolutely disgusting what’s going on,” he said, later adding that no one should believe that the timing of the FBI’s search had nothing to do with the political season. “You have, you know, the special master happens to be Jeffrey Epstein’s lawyer – total coincidence. He’s an Obama appointee, probably a Trump hater… of the thousands of magistrates chosen, I should say, he happens to be the one guy they get. Like, does anyone believe in this much coincidence?…” “The guys who on the ‘FBI radar,’ they magically shoot up schools or do whatever they’re gonna do because they checked some sort of politically correct box,” Trump Jr. said. “We can’t actually look at them but we can persecute your grandmother because she’s a conservative, or your friend who happened to be within 500 miles of Washington D.C. on January 6,” the former president’s son claimed. “It’s a disgrace what’s happened to the FBI, how politicized they’ve become and how they’ve become weaponized.”
Is Don Jr. telling us that his own grandmother helped Trump Sr. steal those classified documents? As far as shooting up schools, FBI agents are the ones that try to protect our kids from MAGA hat wearing jerks that carry military assault weapons to schools.
Kevin McCarthy’s Electric Code of Liberty???
https://www.mediaite.com/news/morning-joe-crew-mocks-kevin-mccarthys-bizarre-electric-cord-of-liberty-rant-joining-white-house-staff-and-reporters/