Statistics through 2022Q2 – rapid growth in natural gas exports but from small base. LNG exports contribution to change in goods exports quantitatively trivial.
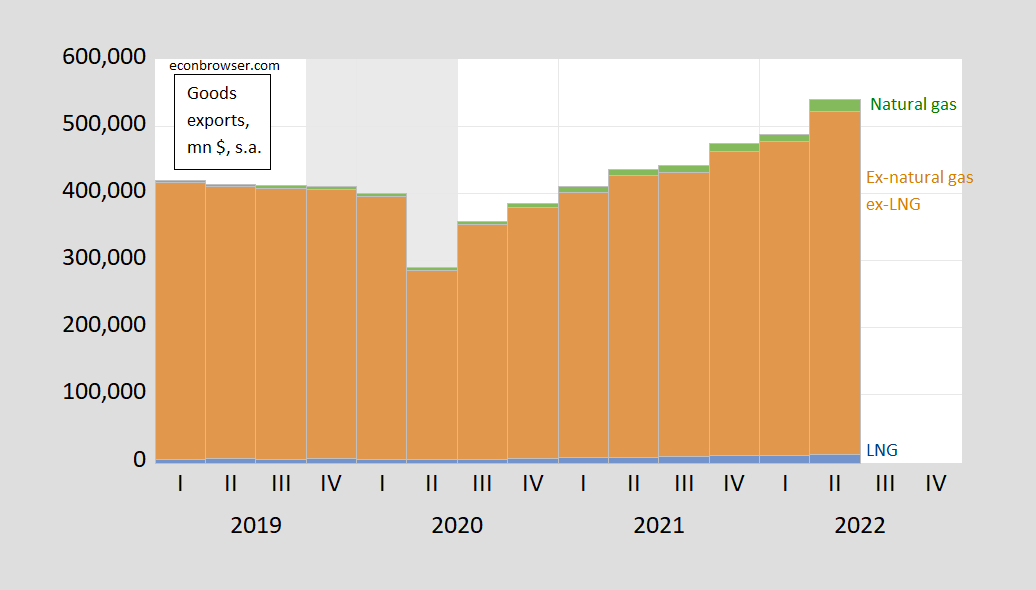
Figure 1: Non-natural gas, non-LNG exports (tan bar), natural gas exports (green bar) and LNG exports (blue bar), all in millions $, quarterly rate, seasonally adjusted. NBER defined peak-to-trough recession dates shaded gray. Source: BEA, NBER, and author’s calculations.
And here is the contribution to changes in goods exports (q/q, millions $, seasonally adjusted):
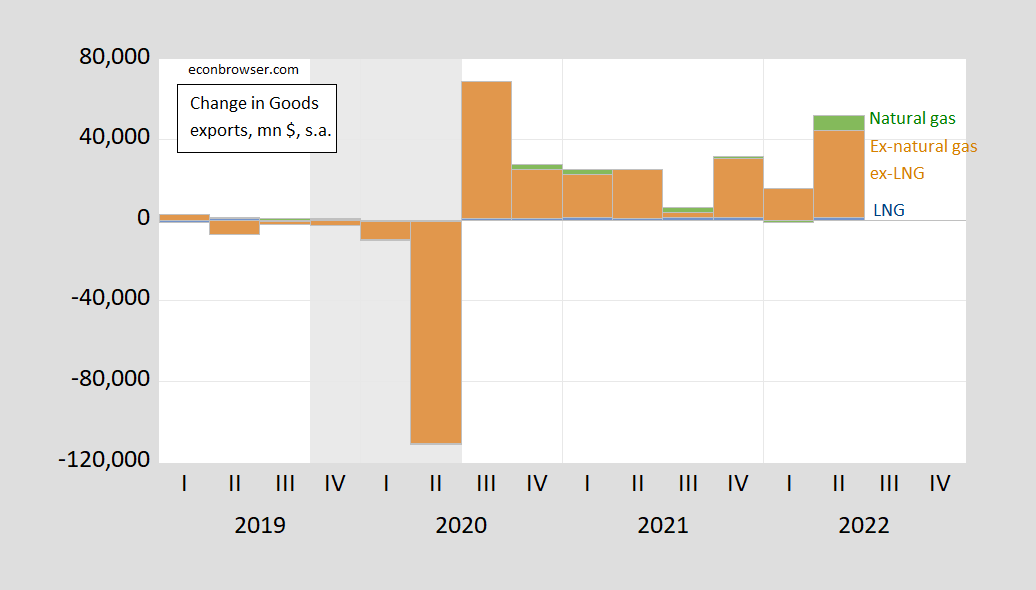
Figure 2: Quarter-on-quarter change in non-natural gas, non-LNG exports (tan bar), change in natural gas exports (green bar), and change in LNG exports (blue bar), all in millions $, quarterly rate, seasonally adjusted. NBER defined peak-to-trough recession dates shaded gray. Source: BEA, NBER, and author’s calculations.
“Statistics through 2022Q2 – rapid growth in natural gas exports but from small base. LNG exports contribution to change in goods exports quaatively trivial.”
That was precisely my point to which JohnH originally claimed I was lying. Yea – now Johnny boy has attempted to change what he originally said as he continues to LIE about what I said.
And of course the detailed data do not yet go into Q3 which was Macroduck’s point. And of course Johnny boy attacked Macroduck for saying so.
Then again had Johnny did the hard work you have done rather than misrepresenting magazine articles that he chose to link to – we could avoided a lot of pointless back and forth. Folks – please check the actual data before hitting the send button.
pgl: I would say JohnH does exactly what he does in order to confuse issues, rather than clarify.
I likely said this before.
lng capacity in usa is largely selling to the northeast usa.
more liquidation, and port infrastructure needed to expand exports.
for example, a liquification infrastructure could build in upper Chesapeake, fed by an expanded pipeline into the area.
such investments are not favored.
“lng capacity in usa is largely selling to the northeast usa.”
can you source this? I don’t think it is accurate.
My impression is that LNG is mostly an export product. Domestic delivery is mostly in the form of compressed, rather than liquified, gas. So it does much matter if a tiny volume of LNG goes to the Northeast.
If the claim were that natural gas is mostly being sold to the Northeast, that’s probably wrong.
“The five states that consumed the most natural gas in 2021 by amount and percentage share of total U.S. natural gas consumption were:
• Texas—4.67 Tcf—15.2%
• California—2.09 Tcf—6.8%
• Pennsylvania—1.81 Tcf—5.9%
• Louisiana—1.75 Tcf—5.7%
• Florida—1.54 Tcf—5.0%”
“The top five dry natural gas-producing states among the 34 states where natural gas was produced in 2021 by amount and percentage share of total U.S. dry gas production were:
• Texas—8.50 Tcf—24.6%
• Pennsylvania—7.53 Tcf—21.8%
• Louisiana—3.41 Tcf—9.9%
• West Virginia—2.54 Tcf—7.4%
• Oklahoma—2.31 Tcf—6.7%
https://www.eia.gov/tools/faqs/faq.php?id=46&t=8
So of the top five consuming states, three are among the top five producing states. Neither of the other top consuming states are in the Northeast.
To look beyond the top five, check here:
https://www.eia.gov/dnav/ng/ng_cons_sum_a_EPG0_VC0_mmcf_a.htm
You’ll find that New York is high on the list, bit so are Ohio and Illinois. Ohio is a sizable producer, nearly on par with Oklahoma. Illinois isn’t. So no, there is not a clear pattern of the LNG being sold largely to the Northeast.
There seems to be a great deal of misunderstanding about the natural gas market, LNG in particular. Mostly, all one has to do is look. Plenty of data out there. The exception seems to be the point of consumption of LNG by state. I haven’t been able to find data on that, presumably because so little is domestically consumed.
People often think they know stuff that they don’t actually know. I guess that’s a necessary condition for believing stuff that ain’t true, and there’s plenty of that in evidence.
I do not follow LNG, as I said.
I suggest reviewing the gas pipeline map to see why there is a large LNG terminal in Boston harbor.
Pipelines is superior to LNG in cost etc, if the pipes exist.
the choice for LNG to New England was made 25 or 30 years ago
while the professor’s chart above show export LNG rather small.
lng produced in the usa does not distribute to New England, from what I understand. at least, lng produced along the gulf coast. lng in New England is actually imported from elsewhere. I think the New England area has some capacity to turn natural gas into lng, but that may be small capacity. at any rate, it seems to be an odd thing that although we produce a lot of natural gas and lng, the economics (both today and yesteryear) seem to indicate New England actually imports lng from abroad rather than domestically.
if there is somebody who is actually familiar with natural gas and lng distribution, would love to have some more clarity.
Baffled, doing due diligence research is easy on the internet. There are 3 LNG IMPORT facilities in North East. All, 1 onshore and 2 off shore, are in the Boston area.
“Constellation’s Everett LNG Facility is the longest-operating liquefied natural gas (LNG) import facility of its kind in the United States. Liquefied natural gas (LNG) is composed of methane and some mixture of ethane used to convert natural gas to liquid form for greater ease and safety in storage transport. It is cooled to approximately -256⁰ Fahrenheit so that it can be transported to countries that demand more natural gas than they produce.” https://www.constellationenergy.com/our-company/locations/location-sites/everett-lng-facility.html
Also fascinating is that a big customer of the Everett facility was the Mystic Generating (Electricity) Stations. It was due to closure in 2022, but FERC extended it into 2024, over the complaint of its owner.
“We have not made a decision to retire Exelon Generation’s nearby Everett Liquefied Natural Gas (“LNG”) Facility (Everett). We are continuing to evaluate Everett’s future and are hopeful that it will continue to operate following Mystic’s retirement. Everett is strategically located, with interconnections to two interstate pipelines and a natural gas distribution system, and a large LNG trucking operation. Marketers and utilities in the Northeast have relied on LNG from Everett for decades as an integral peaking fuel to supplement their pipeline supplies.”
https://www.constellationenergy.com/newsroom/2020/statement-regarding-the-retirement-of-mystic-generating-station-.html
I asked for people familiar with nat gas and lng distribution for a reason. I have already searched the internet myself, covid, I don’t really need your opinion on the matter. but there are questions, related to how the topic first started, which are not readily answered. those facilities allow lng to be shipped in and distributed. however, it is not clear exactly where the lng is coming from. my impression is they are actually imports, from foreign nations. the lng produced in the gulf coast is not distributed in New England by the domestic ports. perhaps some comes in through the Canadian port from the gulf coast?
“lng capacity in usa is largely selling to the northeast usa.”
this was at the statement by Anonymous. again, not sure if it is correct. that is why I asked for an expert, not a novice internet sleuth. our gulf coast capacity seems to be meant as a true export, not redistributed domestically.
Baffled, as I’ve recently noted your ego is your shield, but why filter knowledge? ” I have already searched the internet myself, covid, I don’t really need your opinion on the matter. ”
Had you ACTUALLY done your due diligence you would know that LNG imports to those Boston plants are from Trinidad and Tobago. Just to be even more clear, they are FOREIGN entities versus the Gulf of Mexico from which you cited “US” production is NOT.
The liberal mind does amaze.
https://english.news.cn/20221101/f550e38b1f4747479053357dfd67a682/c.html
November 1, 2022
Chinese company hands over Nigeria’s first deep sea port
LAGOS — China Harbor Engineering Company Ltd (CHEC) on Monday handed over Nigeria’s first deep sea port to the government after the completion of the huge maritime project in the country’s economic hub city of Lagos.
The port will meet the needs of Nigeria’s economic development, said Cui Jianchun, Chinese ambassador to Nigeria, in an interview with Xinhua at the handing over ceremony held in Lagos.
As a commercial project of tripartite cooperation between China, France and Nigeria, Lekki port is of great significance for promoting the Belt and Road cooperation in Africa, said the ambassador.
Constructed by the CHEC, the Lekki Deep Sea Port is the largest seaport in Nigeria, and one of the biggest in West Africa. The construction of the port commenced in June 2020, and is designed to handle 1.2 million standard containers annually.
“This new port will position Lagos as a new maritime logistics hub not only in West Africa, but in the whole Central and West African region,” said the Governor of Lagos State Babajide Sanwo-Olu at the ceremony.
The newly completed project will create nearly 200,000 direct and indirect jobs in Nigeria in the coming years, unlock the country’s economic potential, and boost the country’s revenue, he said.
With the construction of Lekki port, Lagos’ Lekki area has become a hot place for investment, Deputy General Manager of the CHEC Wu Di told Xinhua, adding that the port will soon be put into commercial operation and is full of development prospects….
A reader referred to Chinese port building and operation as a critical focus of the Belt and Road Initiative. The port in Nigeria is among a number of African ports that are BRI developments. China has also partially built and is partially operating ports in Haifa, Israel and Piraeus, Greece and Hamburg, Germany. The ports in Greece and Germany connect directly to rail lines in China.
ltr,
Is it not the case that the PRC has now officially moved beyond the BRI, although still completing some of its projects, and is now pushing something called the Global Development Initiative, GDi?
BTW, not getting any answer from ltr or anybody else on this, my understanding of the main difference between BRI and GDI is that the former emphasized bilateral deals between China and various nations, whereas the latter is supposedly going to be something more multilateral or simultaneous or whatever, although I have yet to see any details of what it might entail more specifically.
https://www.nytimes.com/2022/11/01/business/economy/fed-rates-company-earnings.html
November 1, 2022
Corporate America Has a Message for the Fed About Inflation
If Federal Reserve Chair Jerome H. Powell and his colleagues look at company earnings reports, these themes might catch their eye.
By Jeanna Smialek and Isabella Simonetti
Federal Reserve officials are battling the fastest inflation in four decades, and as they do they are parsing a wide variety of data sources to see what might happen next. If they check in on how executives are describing their companies’ latest financial results, they might have reasons to worry.
It’s not because the corporate chiefs are overly gloomy about their prospects as the Fed aggressively raises interest rates to control rapid inflation. Quite the opposite: Many executives across a range of industries over the last few weeks have said that they expect to see sustained demand. In many cases, they plan to continue raising prices in the months ahead.
That is good for investors — the S&P 500 index gained 8 percent last month as companies began reporting quarterly profits — but not necessarily welcome news for the Fed, which has been trying hard to slow consumer spending. The central bank has already raised rates five times this year and is expected to do so again on Wednesday as part of its campaign to cool off the economy. Although companies have warned that the economy may slow and often talk about a tough environment, many are not seeing customers crack yet.
“While we are seeing signs of economic slowing, consumers and corporates remain healthy,” Jane Fraser, the chief executive of Citigroup, told investors recently. “So it is all a question of what it takes to truly tame persistently high core inflation.” …
https://www.nytimes.com/2022/11/01/business/food-prices-profits.html
November 1, 2022
Food Prices Soar, and So Do Companies’ Profits
Some companies and restaurants have continued to raise prices on consumers even after their own inflation-related costs have been covered.
By Isabella Simonetti and Julie Creswell
A year ago, a bag of potato chips at the grocery store cost an average of $5.05. These days, that bag costs $6.05. A dozen eggs that could have been picked up for $1.83 now average $2.90. A two-liter bottle of soda that cost $1.78 will now set you back $2.17.
Something else is also much higher: corporate profits.
In mid-October, PepsiCo, whose prices for its drinks and chips were up 17 percent in the latest quarter from year-earlier levels, reported that its third-quarter profit grew more than 20 percent. Likewise, Coca-Cola reported profit up 14 percent from a year earlier, thanks in large part to price increases.
Restaurants keep getting more expensive, too. Chipotle Mexican Grill, which said prices by the end of the year would be nearly 15 percent higher than a year earlier, reported $257.1 million in profit in the latest quarter, up nearly 26 percent from a year earlier.
For years, food companies and restaurants generally raised prices in small, incremental steps, worried that big increases would frighten consumers and send them looking for cheaper options. But over the last year, as wages increased and the cost of the raw ingredients used to make treats like cookies, chips, sodas and the materials to package them soared, food companies and restaurants started passing along those expenses to customers.
But amid growing concerns that the economy could be headed for a recession, some food companies and restaurants are continuing to raise prices even if their own inflation-driven costs have been covered….
It’s a longer story than that, really. Better to look at 2012 to 2022. Think about the time it takes to build one of these facilities. These are huge capital projects, not widget factories responding to pricing by running a night shift. You can’t ship more than capacity and it takes 5-6 years to build more capacity…and then when the capacity is there, it runs except for dramatic occurrences (e.g. Covid), since the fixed cost is sunk.
A dramatic related story has been in oil, where we went from 5 MM bopd to 12+ MM bopd during the last 12 years. Still less than our consumption, but a huge net decrease in imports. (The actual amount of exports is mostly irrelevant, happens based on crude grade mismatch and geographic factors, but the total impact is one of less net imports.)
You can also look at NGLs, notably propane, where we went from imports to exports. May not be dramatic on a GDP scale, but a dramatic change for those in the industry and in petrochemicals.
All of the above are of note, for a blog that used to spend a lot of time on energy economics, pushing a bit of a peak oil slanted narrative (not the most insane, but still down that path…and proven rather wrong by shale even as it downplayed that evolution of then industry.)
It’s a longer story than that, really. Better to look at 2012 to 2022. Think about the time it takes to build one of these facilities….
[ Please explain what building “one of these facilities” pertains to. I assume this relates to liquid natural gas, but how?
Thank you. ]
Liquefaction plant. Almost all US export growth has been via LNG. (some by pipe to Mexico and Canada, but Canada is under a lot of price pressure to ship south.) It takes about 3-5 years to build such a plant. (more likely the longer part of that range.) And more if you include pre FID work (feasibility studies, conceptual design, site selection, permitting). And it’s about 10 bills for a typical plant. Not a small project.
These are basic aspects of the industry that can be researched via popular articles. Make sense to know, for context. Because it affects the behavior of firms.
Liquefaction is a bottleneck. When the pricing in Europe exploded, all the plants could do was try to delay maintenance or the like. But it’s not like they could add shifts. This is not widgets. And nobody is going to build a 20 year life facility that won’t start for 5 years based on a near term price incentive. This is basic engineering economics. There is no “2022” sales column on the NPV spreadsheet for a new LNG plant. 😉
The converse of course also applies. Overbuilt capacity has an incentive to run (until negative cash costs), even if the plant is not covering fixed costs. Capital costs are sunk costs. To a large extent the costs are sunk after FID, let alone construction, because at that point you have already sent in big purchase orders to GE or whoever is making the long lead time items (compressors and pumps and such). That’s why FID is such a big deal scrunch factor decision.
Liquefaction plant. Almost all US export growth has been via LNG. (some by pipe to Mexico and Canada, but Canada is under a lot of price pressure to ship south.) It takes about 3-5 years to build such a plant. (more likely the longer part of that range.) And more if you include pre FID work (feasibility studies, conceptual design, site selection, permitting). And it’s about 10 bills for a typical plant. Not a small project.
These are basic aspects of the industry that can be researched via popular articles. Make sense to know, for context. Because it affects the behavior of firms.
Liquefaction is a bottleneck….
[ Really helpful. Notice as well:
https://www.eia.gov/energyexplained/natural-gas/liquefied-natural-gas.php
May 19, 2022
Natural gas explained
Liquefied natural gas
I am grateful for the clarification. ]
https://www.eia.gov/energyexplained/natural-gas/liquefied-natural-gas.php
May 19, 2022
Natural gas explained
Liquefied natural gas
What is LNG?
Liquefied natural gas (LNG) is natural gas that has been cooled to a liquid state (liquefied), at about -260° Fahrenheit, for shipping and storage. The volume of natural gas in its liquid state is about 600 times smaller than its volume in its gaseous state in a natural gas pipeline. This liquefaction process, developed in the 19th century, makes it possible to transport natural gas to places natural gas pipelines do not reach and to use natural gas as a transportation fuel.
LNG increases markets for natural gas
Where natural gas pipelines are not feasible or do not exist, liquefying natural gas is a way to move natural gas from producing regions to markets, such as to and from the United States and other countries. Asian countries combined account for the largest share of global LNG imports.
LNG export facilities receive natural gas by pipeline and liquefy the gas for transport on special ocean-going LNG ships or tankers. Most LNG is transported by tankers called LNG carriers in large, onboard, super-cooled (cryogenic) tanks. LNG is also transported in smaller International Organization for Standardization (ISO)-compliant containers that can be placed on ships and on trucks.
At import terminals, LNG is offloaded from ships and is stored in cryogenic storage tanks before it is returned to its gaseous state or regasified. After regasification, the natural gas is transported by natural gas pipelines to natural gas-fired power plants, industrial facilities, and residential and commercial customers.
[ Natural gas is transported on specially designed ships as liquefied natural gas (LNG). LNG is natural gas that is cooled to -260° Fahrenheit, the temperature at which natural gas becomes a liquid. The volume of the liquid is 600 times smaller than the gaseous form. ]
In the United States, some power plants make and store LNG onsite to generate electricity when electricity demand is high, such as during cold and hot weather, or when pipeline delivery capacity is constrained or insufficient to meet increased demand for natural gas by other consumers. This process is called peak shaving. The power plants take natural gas from natural gas pipelines, liquefy it in small-scale liquefaction facilities, and store it in cryogenic tanks. The LNG is regasified and burned by the power plants when needed. Some ships, trucks, and buses have specially designed LNG tanks to use LNG as fuel.
U.S. LNG imports peaked in 2007 ….
The peak oil debate is mostly full of people talking past each other. We have an example of that here, even as we hear from only one side of the debate.
M. K. Hubbert made a forecast in 1956 that, based on existing technology, proven reserves and a forecast of future reserve discoveries, U.S. petroleum production would peak between 1965 and 1970. Output peaked in 1970, demonstrating the rightness of Hubbert’s model.
Note, however, that Hubbert specified “existing technology”. Technology changed. Asserting that peak oil hypothesis is “down the path” of insanity because it missed the shale-oil boom misunderstands the hypothesis.
Ridicule of the peak oil hypothesis also misses the important underlying reality that allowed Hubbert to get the peak right the first time; there is a limit to oil production under any given technology. One can believe that oil will be endlessly available under some as-yet undiscovered technology, just as one can believe Covid will “go away in April with the heat”, but belief isn’t evidence. We have, in fact, pretty good evidnce of “peak gas” in a number of U.S. basins. There are also credible estimates for peak production for other mineral resources like copper. Peak production is a clear possibility for any non-renewable resource. Heck, we could probably come up with a reasonable model for peak production for renewables, too.
Somehow, even though the original idea underlying peak oil is clearly correct, and even though peak oil forecasts under Hubbert’s rules, including “existing technology”, have been successful, this “peak oil is wrong” thing keeps being repeated as a sort of received wisdom. It often shows up out of nowhere, when it’s not germane to the discussion – one of those talking points that certain people feel the need to repeat.
1. Read the 1956 paper (I have, several times). He did not say under existing technologies. To the contrary actually. His paper was actually better than defenders like you realize. What he said was that technology enables new production, giving an example in the Illinois basin, of repeaked production, due to development of seismic technology. However, what his 1956 paper was, was an effort to look at “all the sedimentary basins” and regardless of new technology, predict a new peak. And…he was wrong.
2. He predicted world, US, TX peaks for oil and for gas. Every one was wrong, both the eventual peak timing and the area under the curve (which to give him credit was more his focus). As such, Hubbert’s predictions were similar to many earlier predictions, probably from confirmation bias. Hubbert himself had been wrong in the 30s (read the Mason Inman biography). And many earlier predictions are easy to cite.
3. Technology development is an expected issue in oil (and any natural resources business, e.g. copper mining, gold mining). There’s a long history of it. Going “all else equal” is silly in that case. Would you do the same with computing power? Granted, it hasn’t developed as fast. But it certainly has developed and continues to do so.
4. The two caveats that Hubbert had were no development of “tar sands” (Vz, AB) or oil shale (NOT shale oil, we talking synfuels, Green River stuff).
5. Fracking was a known technology from the 40s. Horizontal drilling was a known technology from the 20s. Of course they have developed over time, but that’s par for the course, in this industry and in many industries!
6. Both the Bakken and the Spraberry (major “shale” formations) were discovered and started to be drilled in the 40s, 50s. OF course they weren’t as well developed until price and technology allowed. But they sure weren’t “new sedimentary basins”.
7. Depletion, OF COURSE, is an issue in natural resources. But Hubbert ignored the issue of price and how it unlocks new projects. I would think an econ blog would care about this. Pretty basic MBA thinking. In reality, depletion removes productive resource, while “technology” (broadly defined to include actual technology as well as discoveries, opening public lands, etc.) enables it. The two fight each other. Peak oilers make the mistake of only concentrating on one. Not a very microeconomic attitude.
I also don’t need to go to Hubbert. I can just discuss the peak oil flavored articles and blog posts, from this blog creator. It is trivial to look at his 2011 talk on YouTube, where he said once an area peaks, it is unlikely to repeak…and we have to go to new areas (then showing his classic state by state peak curves). And those curves look a little silly now, given that the overall US has repeaked and so has TX!
And that’s not an outlier, this vein of argument was repeated often in articles and blog posts (including the famous “hundred dollars here to stay”, which I half jokingly say jinxed us.)
And this was certainly a case where shale development was in the news. We’re not talking 2005, here. So, not something where he was completely blind sided. Something where the trend was well reported and he downplayed it. Should have had at least a more uncertain Bayesian prior. And…this is speculation…but I think his peak oil flavored articles were influenced by some element of wishcasting. I mean when he said “hundred dollars here to stay”, did he bet on it?
Anonymous,
So I have gone back to look at what went on around here regarding the peak oil issue. The major action was back in 2005, with Jim Hamilton taking the peak oil people seriuosly while remaining “skeiptical.” One of the leading peak oil people, Stuart Staniford of Peak Oil, participated a lot. I made some comments there, which look pretty good even now.
There was an Anonymous commenting then. was that you? that one was seemed a lot smarter than you do, “Anonymous.” He described himself as a “peak oil moderate.”
Very few people who are around now were there then. There were far more people clearly using their real names, a “T.R. Elliott” was especially vocal and intelligent. where is he now? And while there were plenty of disagreements and some vigorous debate, the tone was indeed far more civil and less nasty than we see now. Things have really changed on that front, and I recognize that I am among those who have changed on this score, a bit embarrassing.
Anonymous,
Oh, I did not see anything from 2011. I so not know what you are referring to there, with Jim supposedly being a peak oil fan. In the 2005 exchanges he always maintained a moderately skeptical economist view, even as he provided space for the peak oilers.
The next round of the discussion occurred in 2013. By then it was clear that both US and world oil production were rising. Fracking was coming on strong in the US. That period was symbolized by the title of one of Jim’s posts from that period: “Peak Oil is Over.”
A few more people now around were showing up then, including Steven Kopits and Bruce Hall. “Anonymous” was also around in that period, again, looking more reasonable than you do.
Bruce Hall came across as pretty dumb, arguing, for example, that prices and technology are not important in the oil production, but rather it is controlled by taxes and regulation. Gag.
So, “Anonymous,” if you are the same person as that earlier one, what happened to you? How is it that you lost so much of your mind?
Barkley, actually it was 2012, not 2011 the talk I’m referring to:
https://www.youtube.com/watch?v=D9z1Ikn84Aw
(but the line of reasoning with the state by state charts was in several papers from 2011-2014)
Jim was too dismissive of shale as late as 2014 “hundred dollars here to stay” paper. Rightly being called out by John Kemp at the time:
https://twitter.com/jkempenergy/status/492660177389494272
And Hamilton bleated in disbelief when prices crashed in late 14 that the oil was “worth” $85/bbl…despite the, uh, MARKET not pricing it there.
Anonymous,
You are right that Jim got caught in 2014 predicting inaccurately that “hundred dollar oil is here to stay,” even though a year earlier he had declared on this blog that “Peak Oil is Over” based on fracking, or what in the paper he called “tight oil.”
In the 2014 he did not produce a bunch of state charts and only referred to PA, OH, and WV having peaked long ago, with some discussion about how much more can be gotten out of Alaska. He in fact noted that many people were forecasting that there might be substantial increases in production further from ND and TX of “tight oil,” which does make me wonder how he came up with his conclusion that hundred dollar oil was here to stay.
Do note two things. One, as Steven Kopits has noted, Hubbert was right under the assumption of roughly constant technology, and we did hit peak oil production in the US about the time he forecast, 1970, at a time when the price was very low and prior to the large price increases of the 1970s, which did not lead to a turnaround in production to overcome that peak. it took the major technological change of fracking much later to bring on the second peak we have seen more recently. Personally I do not know if we can surpass March 2020 or not, with Steven K. being skeptical that we can.
The other point is that he accurately noted trends in much of the rest of the world. Some major pools had peaked and were sharply declining and continue to do so, e.g. Cantarell in Mexico, which at one point was the second largest producing pool in the world after al Ghawar in KSA. The largest pool in China also peaked and had gone down, making China into a substantial net oil importer, although he did not focus on China per se. Rather he noted rising demand from the “emerging economies,” which includes Chna. He also noted geopolitical problems in many nations, such as Libya and Iraq, some of which continue today.
In the paper he was somewhat equivocal about OPEC, although I think basically accurate. He noted increased efforts at drilling in many nations not leading to much increased production (why is not fracking happening in some of these places?). He noted the important swing role of Saudi Arabia, but in the end threw up his hands saying that while they seemed to be somewhat playing a role as the key swing producer, it was not clear exactly what they were up to. Their crucial role continues, and there remain a number of unknowns about what their situation is.
Indeed, back in the 2005 discussions, there was much discussion of the Abqaiq pool, which I think was fifth in the world at the time. But then and now, the far larger al Ghawar remains much more important and also still a matter of not knowing how much it has.
Oh, Stuart Staniford was with Oil Drum, not “Peak Oil.” I gather that by 2013 he agreed with Jim that “Peak Oil is Over,” despite having been a leading advocate of the idea.
BTW, one other point Jim made accurately is that the lowest cost and highest quality sources of oil are being used up, even though cost remains very low in Kuwait and Saudi Arabia for now. But a special matter is that while it has played the crucial role in bringing about increased production, fracking is much more expensive than more traditional oil production methods, which Jim also noted.
off topic, but i’m figuring an upward revision on the order of 75 basis points to 3rd quarter GDP based on this morning’s construction spending report….that’s the largest GDP revision i’ve ever seen from any single report, & i’ve been doing these estimates about 8 years…herewith are the numbers, y’all can check my quick & dirty arithmetic:
Construction spending during September 2022 was estimated at a seasonally adjusted annual rate of
$1,811.1 billion, 0.2 percent (±1.0 percent)* above the revised August estimate of $1,807.0 billion.
https://www.census.gov/construction/c30/pdf/release.pdf
the annualized August construction spending estimate was revised 1.4% higher, from $1,781.3 billion to $1,807.0 billion, while the annual rate of construction spending for July was also revised 1.4% higher, from $1,793.5 billion to $1,817.9 billion…
The BEA’s key source data and assumptions that accompanied the 3rd quarter GDP report indicates that they had estimated that September’s nominal residential construction would decrease by an annualized $10.8 billion from the previously published figures, that nonresidential construction would decrease by an annualized $0.7 billion from last month’s report, and that September’s public construction would increase by an annualized $0.7 billion from last month’s report….hence, the total of the figures used by the BEA for total September construction in the 3rd quarter GDP report were a net $10.8 billion lower than the previously published August figure…since this report indicates that September construction was up by $4.1 billion from an August figure that was revised $25.7 billion higher, that means that the net September construction figures used in the GDP report were a total of $40.6 billion too low…averaging that underestimation with the $25.7 billion upward revision to August construction spending and the $24.4 billion upward revision to July’s construction spending means the aggregate annualized nominal construction figures used in the 3rd quarter GDP report were roughly 30.2 billion too low, suggesting an upward revision of about 0.75 percentage points to 3rd quarter GDP to account for what this report shows…
NB: i’m on record, about a month ago, saying that there’s no way 3rd quarter GDP growth could hit 2.4%. i was obviously very wrong.
GDPNow tacks on 0.3% to its prior forecast for gross private domestic investment, knocks off 0.8% for real PCE, with ISM factory data and construction spending as the new inputs. The subcomponent charts show an additional small drag from both residential and non-residential investment (?). I do not know why. That doesn’t line up with the just-note revisions in the text.
Factory building was a big part of the September change and August revisions were upward for private residential and non-residential construction, as well as for public construction. The first two of those are, obviously, private investment.
I no longer maintain GDP tables, but my mental model is confused. I’m happy to assume your math is right, which means you and the GDPNow model had made very different assumptions about construction spending as of August data. Don’t know why that would be.
Have you considered dumping GDPNow tables and comparing their earlier assumptions and today’s revisions to you own?
Thanks for sharing you work, by the way.
i don’t know what the Atlanta Fed is doing…i was under the impression that they were only producing forecasts of future reports, not revising reports that had already been published….if they are forecasting a revision to Q3 GDP, give me a link for that…
when the 3rd quarter GDP was published last week, they cautioned that the source data was incomplete and also subject to revisions; ie, September construction, September trade in services, and non-durables factory inventory data had not yet been reported or formally estimated…so the BEA assumed a $14.0 billion increase in exports of services, a $30.8 billion increase in imports of services, a $10.8 billion decrease in residential construction, a $0.7 billion decrease in non-residential construction, a $0.7 billion increase in public construction, and a $0.1 billion decrease in nondurable manufacturing inventories for September before they estimated the 3rd quarter’s output;; those items estimated without data are marked by #s in the Key source data and assumptions (xls file) that accompanies the GDP report…you can see that the monthly construction spending reports are used directly as source data for 3 subcomponents of GDP; investment in private non-residential structures, investment in residential structures, and government investment outlays, for both state and local and Federal governments…all i am doing here is pulling out the estimated figures that the BEA used and correcting them with the newly published hard data…..my estimate aggregates them together to simplify my calculations, and makes no adjustment for the likelihood that the inflation adjustments to the individual components would be different than that of the aggregate total..
My mistake.
https://fred.stlouisfed.org/graph/?g=zSG6
January 4, 2020
Interest rates on 10-Year Treasury Bond minus 3-Month Treasury Bill, 2020-2022
https://fred.stlouisfed.org/graph/?g=N741
January 4, 2020
Interest rates on 10-Year Treasury Bond minus 2-Year Treasury Note, 2020-2022