Consumption flat, at expectations. We now have the following picture of key indicators followed by the NBER’s Business Cycle Dating Committee.
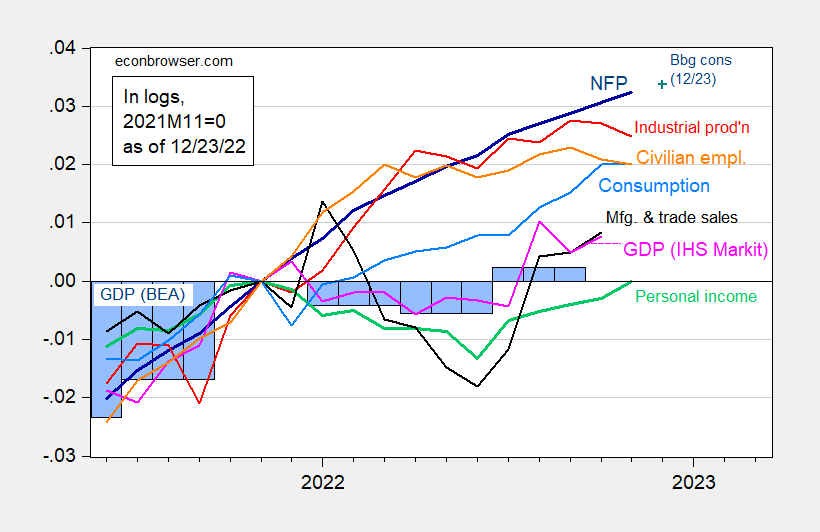
Figure 1: Nonfarm payroll employment, NFP (dark blue), Bloomberg consensus (blue +), civilian employment (orange), industrial production (red), personal income excluding transfers in Ch.2012$ (green), manufacturing and trade sales in Ch.2012$ (black), consumption in Ch.2012$ (light blue), and monthly GDP in Ch.2012$ (pink), GDP (blue bars), all log normalized to 2021M11=0. Q3 Source: BLS, Federal Reserve, BEA, via FRED, IHS Markit (nee Macroeconomic Advisers) (12/1/2022 release), and author’s calculations.
Note that nonfarm payroll consumption rose throughout H1, while personal income excluding current transfers fell. NFP and civilian employment trends throughout H1 do not fit well the recession narrative. However, there has been some discussion of whether nonfarm payroll employment series is correctly measuring growth. I show in Figure 2 cumulative growth rates since 2021M11 for alternative series.
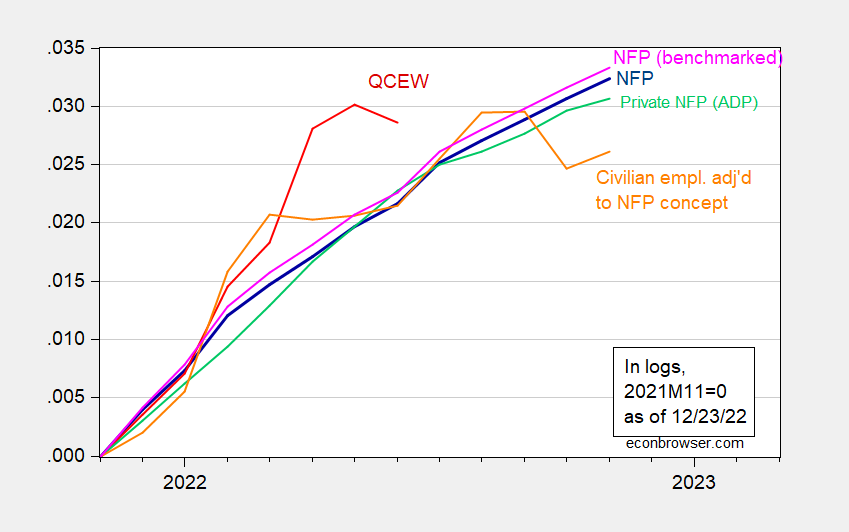
Figure 2: Nonfarm payroll employment, NFP (dark blue), preliminary benchmrked NFP (pink), civilian employment adjusted to NFP concept (orange), private NFP reported by ADP (light green), total covered employment in Quarterly Census of Employment and Wages (dark red), all log normalized to 2021M11=0. QCEW employment seasonally adjusted by author using Census X-11 after X-13 log transformation. Source: BLS, Federal Reserve, BEA, via FRED, and author’s calculations.
Notice that taking into account taxation/regulatory data, the preliminary benchmark revisions for March 2022 implies a higher trajectory for nonfarm payroll employment. I show this as the pink line (see discussion here).
Given the historical correlations, it makes more sense to put weight on the establishment series than the household series. The fact that the ADP series tracks the BLS NFP series buttresses the argument that employment is actually rising throughout H1.
Official number of Covid cases 3K actual number 37 million in China – in a single day!!!
https://edition.cnn.com/2022/12/23/china/china-covid-infections-250-million-intl-hnk/index.html
Nothing like government control of information. This is going to be way more than their health system can handle.
Rewinding a bit here, there has been a fair amount of discussion here of how bad the Cameron economy was for the average Brit. It turns out that the UK Office of National Statistics did a study that directly addresses this issue.
“The median equivalised household disposable income in the UK was £26,300 in the financial year ending 2016 (2015/16). After taking account of inflation and changes in household structures over time, the median disposable income … is £1,000 higher than the pre-economic downturn level observed in 2007/08.” That amounts to 3.9% over 8 years. Not great.
https://www.ons.gov.uk/peoplepopulationandcommunity/personalandhouseholdfinances/incomeandwealth/bulletins/householddisposableincomeandinequality/financialyearending2016#median-household-disposable-income-1000-higher-than-pre-downturn-level
However, when compared with the performance of the Obama administration over a comparable eight year period, it does not look so bad: real median household income dropped 1.8% between 2007 and 2015. https://fred.stlouisfed.org/series/MEHOINUSA672N/
Interesting as the above facts may be, it does not take away from the point I was trying to make: most of the decline in UK real wages occurred when inflation rose; most of the recovery in real wages occurred when inflation abated. But what was more interesting to me is that when inflation approached zero in the UK, many prominent economists were warning about how bad deflation would be for people, when in reality people’s’ incomes had recovered and would do much better…until inflation rose again.
What’s also interesting is that pgl loves to demonize Cameron for poor management of the economy but will never criticize Obama for performance that was even worse! A true partisan hack… Perhaps he doesn’t like Cameron because incomes for the top quintile fell 3.37% while incomes for bottom quintile rose by 13.21%.
Still acting as the economic spokes person for the Tories. JohnH – proponent of cutting government spending to pay for supply side tax cuts.
More nonsense from pgl, who attributes to others whatever pops into his head in the hope that some of his BS sticks.
I hope you realize that everyone here has a great laugh at your feeble and pointless attempts to attack others. Come dude – try making a real point someday. Oh wait – you don’t get paid for being honest. Never mind.
“That amounts to 3.9% over 8 years. Not great.”
You figured that out? Amazing. 0.5% growth per year is indeed not great. But gee an economy that EVENTUALLY recovered from a prolonged recession. An economy that has a very modest amount of growth per capita. Cameron pulled off the GREATEST ECONOMIC MIRACLE of all times!
Jonny boy – your defense of right wing policies is as feeble as your grasp of basic economics.
Funny! pgl has it in for Cameron but won’t criticize Obama for worse economic performance over a comparable period. And he wouldn’t criticize deficit hawks in the Democratic Party—like Pelosi—for implementing austerity, just like Cameron. pgl is a determined political hack, which results in a lot of hilarious hypocrisy and not much principled opinion.
Yea we get that you hate Democrats. After all – you are MAGA hat wear clown.
“Interesting as the above facts may be, it does not take away from the point I was trying to make: most of the decline in UK real wages occurred when inflation rose; most of the recovery in real wages occurred when inflation abated. But what was more interesting to me is that when inflation approached zero in the UK, many prominent economists were warning about how bad deflation would be for people, when in reality people’s’ incomes had recovered and would do much better…until inflation rose again.”
Now if your “point” is that keeping an economy far below full employment for an extended period of time – which is why inflation fell – is good for real wages, then why have you not written up your “advanced” model for submission to the American Economic Review like we asked you to do. I’m sure the editors need a good laugh. But lots of luck with your little paper there.
I wonder why Jonny boy did not note this:
Growth in median household income closely mirrors growth in GDP per head for much of this time, rising during periods of economic growth and falling during or immediately after recessions. The effect of the recent economic downturn on median incomes was delayed relative to the fall in GDP per person. Between 2007/08 and 2009/10, GDP per person fell by 6.7%, while median disposable income changed little. However, between 2009/10 and 2012/13, GDP per person grew by 2.7%, while median household income decreased by 4.5%. Since 2012/13, UK median household income has grown at a faster rate than GDP per person (9.1% and 4.9% respectively).
Oh wait – that is what I’ve been saying for years. Oh well another little detail that contradicts Jonny boy’s little gold bug macroeconomic theory. Jonny – come on. Read the entire discussion before you link to it. DAMN!
Funny! 2009-2013, when real disposable income fell, inflation was at its highest, so of course real incomes fell. Inflation reduces the real value of wages, something pal just can’t wrap his head around!
Blah, blah, blah. Jonny boy pretending he is the teacher in a Charlie Brown cartoon. Funny thing – even Charlie Brown knows more economics than little Jonny boy.
“Inflation reduces the real value of wages”
The classic Bruce Hall fallacy. No moron – you must also specify what is happening to nominal wages. DUH. Yea a prolonged large output gap reduces inflation but it tends to reduce nominal wage growth too.
This is basic economics which of course a moron like you will never grasp.
That fall in the high income group came from the continuing impact of weak aggregate demand which of course you celebrate as an economic miracle. That is what you link said – could you please once in your pathetic little life be honest about your own links? Such as the closing paragraph from section 5:
‘Taking a longer-term perspective, the median disposable income for the richest fifth of households in 2015/16 was 2.3 times higher than in 1977 (when comparable records began). The median income of the poorest fifth of households has also grown over this time, but the rate of growth has been slower (2.0 times higher in 2015/16 than 1977).’
So when one looks over a period longer than a year, it seems income inequality in the UK did not improve but worsened.
Hey Jonny boy – you gave us something useful to read for once. Too bad you never read the whole thing.
See this graphic.
Yeah, the inflation in the UK in 2022 has really whacked real earnings. But the ONS report shown that back in 2015/22016 they were above their 2007/2008 level…unlike the US.
Maybe you should walk down to your community college and sign up for Principles of Macroeconomics as you do not even get the basics. Heck – I’ll pay your tuition if you step writing the same stupid garbage over and over.
“but the ONS report shown that back in 2015/22016 they were above their 2007/2008 level”
That is not even remotely true. I read that report and noted to you that they were not even close to the 2007/8 level. And the graph in the link that Dr. Chinn provided shows real wages in 2015/6 were lower than they were in 2007/8.
Come on Jonny boy – even Mr. Magoo can see that. Of course you have lied over and over about this so why stop now?
“But the ONS report shown that back in 2015/22016 they were above their 2007/2008 level”
Now I realize Jonny boy does not want to be reminded of this post where his lies were blatantly exposed but the 4th graph clearly shows that real wages in 2015/2016 were considerably lower than their 2007/2008:
https://econbrowser.com/archives/2022/11/how-to-end-and-endless-debate
This simple point has been made to Jonny for years here and over at Mark Thoma’s former blog. And Jonny boy continues to blatantly lie about this.
I like the logic of this Twitter:
Real wages in the UK are today lower than 18 years ago (!), and workers have seen substantial real wages losses since austerity started under the Tories in 2010.
But Jonny boy hates DEFICITS. It is if he is the economic advisor for Rand Paul as Jonny boy is also an advocate of returning to the gold standard. After all in Jonny’s macroeconomic model, inflation is an exogenous variable and not something caused by aggregate demand relative to potential GDP.
Impressive credentials. Of course Jonny boy will dismiss him as a mainstream economist and partisan hack.
https://wiiw.ac.at/philipp-heimberger-s-1138.html
Philipp Heimberger is Economist at wiiw. His research focuses on macroeconomics, public economics and international economics. He holds a PhD in economics from the Vienna University of Economics and Business. His experience includes a research position at the Institute for Comprehensive Analysis of the Economy (Johannes Kepler University Linz), where he has worked on macroeconomic divergence and structural change in the European Union, the macroeconomic effects of fiscal policy, and the coordination of European fiscal policies in conjunction with the problems related to estimating potential output.
JohnH,
If inflation is so bloody importanyt in all this, how is it UK supposedly did better than US during this period despite having much higher inflation through moat of the period than we had in the US?
Roster…that’s a great one for a renowned economist like yourself to ponder. Maybe it isn’t the absolute level of inflation that is key. But we can now observe in real time that real wages in the US are starting to rise again just as inflation has begun to fall.
Feeble reply but at least you did not call Barkley a partisan hack. Is Philipp Heimberger a partisan hack? After all – he is a very good macroeconomist who gets the fact that Cameron’s fiscal austerity did not lead to higher UK real wages. Learn to read a damn graph. Geez!