Core PCE inflation was at consensus, 0.2% m/m. Are we in a new inflation regime?
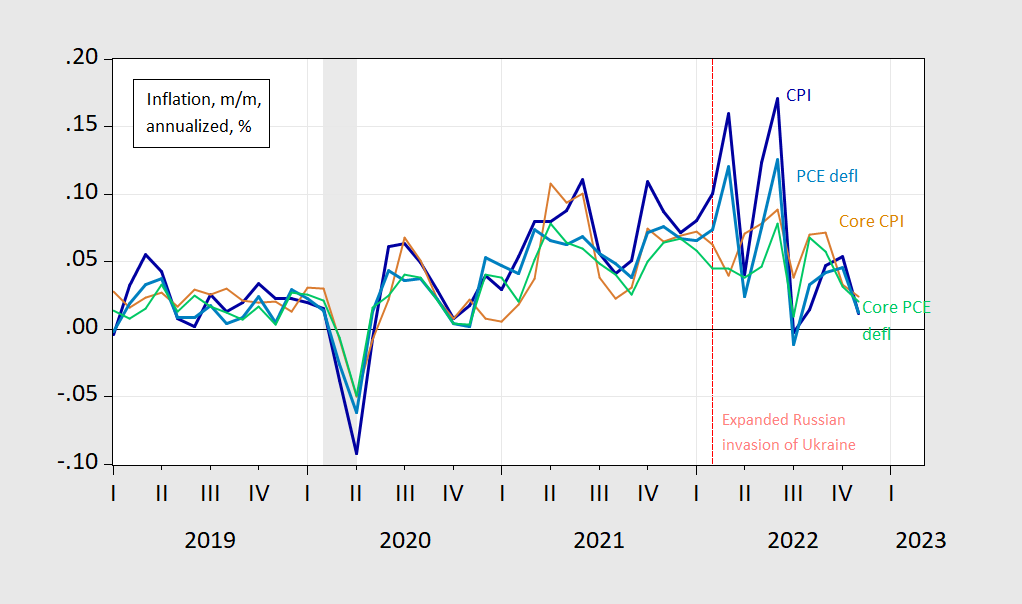
Figure 1: Month-on-month inflation annualized, for CPI (bold blue), core CPI (tan), PCE deflator (bold sky blue), and core PCE deflator (light green). NBER defined peak-to-trough recession dates shaded gray. Source: BLS, BEA via FRED, NBER, and author’s calculations.
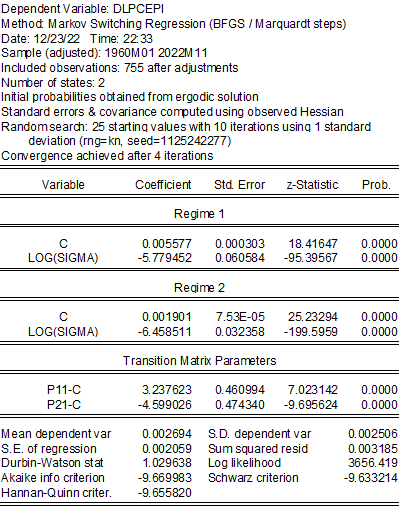
Headline CPI and PCE deflator month-on-month inflation looks like they’re down. So too for core CPI and PCE deflator. In order to make a more formal assessment, I estimate a simple Markov-switching model (two regimes, different variances) over the 1960-2022 period.
This yields the following regime probabilities (filtered, smoothed):
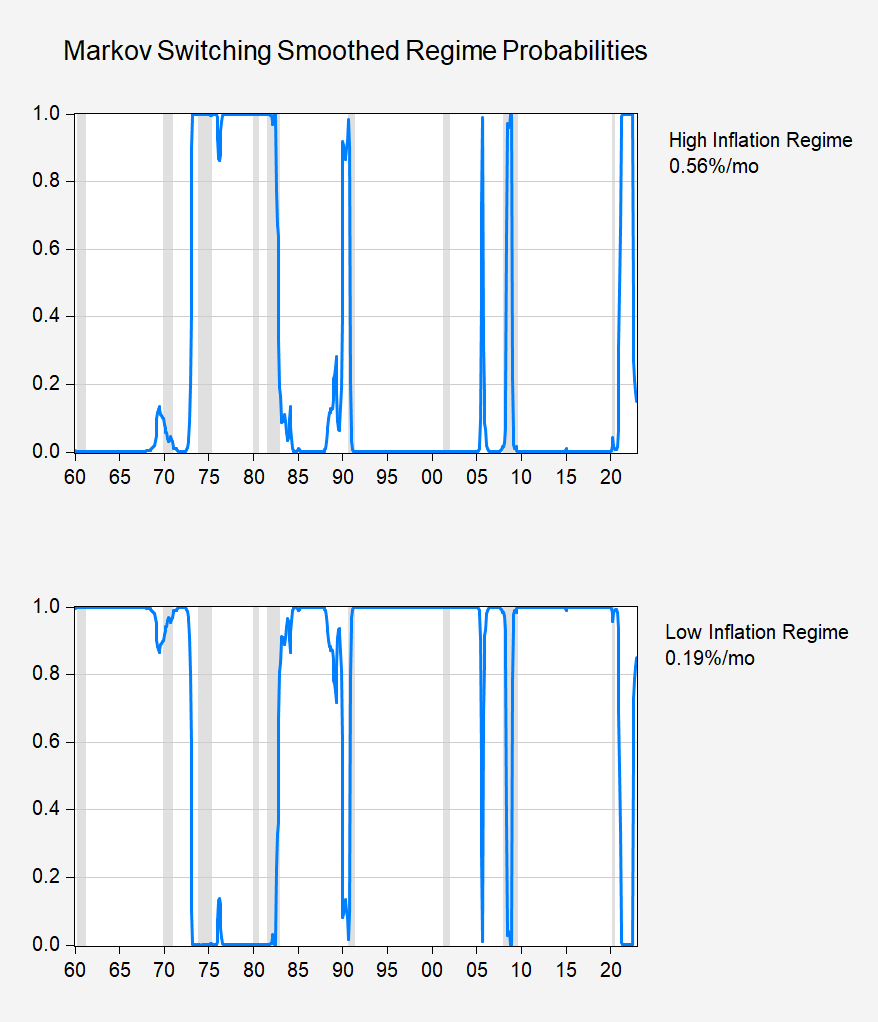
Figure 2: Estimated regime probabilities (sky blue). NBER defined peak-to-trough recession dates shaded gray. Source: Author’s calculations.
As of November 2022, the probability of being in the high inflation regime is 15%.
Since the decline in core inflation is less marked, the estimated probability for being in the high inflation regime is 80%.
Another factor we may want to look at in assessing whether we are entering a low(er) inflation regime is the dispersion of price increases. The San Francisco Fed keeps track of PCE price dispersion:
https://www.frbsf.org/economic-research/indicators-data/pce-personal-consumption-expenditure-price-index-pcepi/
Generally speaking, more items show rapid pricerise now than on average over the pastten years, but the nhmber of high price-rise items is coming down. If, by some measures, we are not yet in a low inflation regime, we appear to be in transition toward a low inflation regime.
I find it interesting that Larry “beatings of the working class must continue until morale improves” Summers now says that we are seeing a “transitory deflationary impact” on prices and the Fed must stay the course on raising rates and the working class – you and me – will just to have to feel more pain and deal with unemployment to protect values for the asset-holding class. https://www.washingtonpost.com/opinions/2022/12/19/larry-summers-fed-inflation-next-steps/
BTW – thanks for maintaining this blog Menzie (with the collapse of Twitter – old school blogs seem to be back in style) and best wishes for new year.
Wait – high interest rates favor the rich over the working class? Not that I disagree with you but have you met JohnH? He wants to claim the opposite occurs. Of course JohnH never learned economics so be careful if you make the mistake I made and try to reason with this troll.
Funny! Real wages are back to where they were in 2019…and pgl thinks that the beating of workers should continue.
https://fredblog.stlouisfed.org/2018/02/are-wages-increasing-or-decreasing/
Posted on February 8, 2018
Jonny boy forgot to read the date of the link. Come on Jonny boy – please, please, please pay attention to your preK teacher as the other kiddies are laughing at you.
Professor Chinn,
Thanks for showing the EViews model. I initially thought that the model may have been done using annualized data as shown in Figure 1. When the results were different from your model, refocusing I used dlog(pcepi) or dlpcepi as shown in the model. Then the model agreed with yours. Using the correct data and correct model always makes the difference. A bit slow here.
Something I see using monthly annualized data is that the probability of being in the high regime is 31%, vs. 15% using dlpcepi.
Any enlightenment would be appreciated.
Thanks
Upon further review, it looks like both answers agree. A gremlin must have crept in. It did not seem that multiplying by a constant should change the answer.
AS: Did you use “annual” inflation rate (monthly y/y) or the “annualized” month-on-month. The two will definitely yield different answers. For instance, if m/m log change is white noise, a 12 month change will have a 11th order (k-1) moving average.
Professor Chinn:
I used annualized monthly data for models #1 and #2.
Below is what I did. EQ03 is the same model as what you presented.
EQ01 is compound annualized.
EQ02 is annualized log difference.
EQ03 is monthly log difference, dlog(pcepi)
Model 1: I used pcepi_annlzd=(pcepi/pcepi(-1))^12-1
Probability of high regime is 0.12, close to what you presented.
Model 2: I used dlpcepi_annlzd=(log(pcepi/pcepi(-1)))*12
Probability of high regime is 0.31 different from Model 1 above.
Model 3: Same as your model, I used dlpcepi=dlog(pcepi)
Probability of high regime is 0.15 same as you presented.
Another factor we may want to look at in assessing whether we are entering a low(er) inflation regime is the dispersion of price increases. The San Francisco Fed keeps track of PCE price dispersion. Generally speaking, more items show rapid price rise now than on average over the past ten years, but the number of high price-rise items is coming down.
https://www.frbsf.org/economic-research/indicators-data/pce-personal-consumption-expenditure-price-index-pcepi/