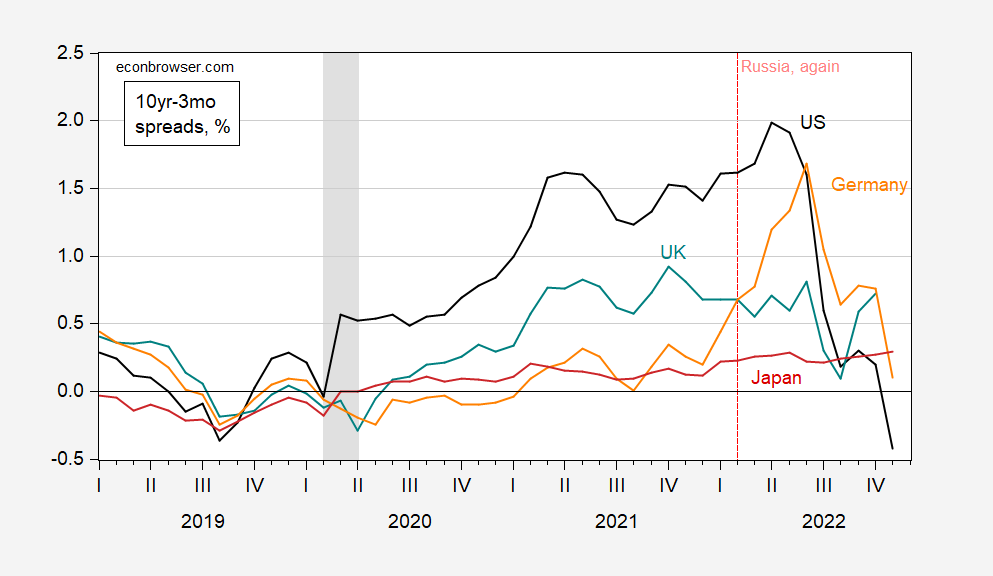
Here is a snapshot of four key term spreads spreads through November (an examination prompted by a Deutsche Bank missive title “The Looming Recession” which dropped into my inbox today).
Figure 1: Ten year government bond yields minus three month rates for US (black), UK (tea), Germany (orange), and Japan (red), %. Three month rates are government bond yields for US, interbank rates for others. NBER defined peak-to-trough recession dates shaded gray. Source: Treasury via FRED, OECD Main Economic Indicators, updated with Tradingeconomics.com, NBER, and author’s calculations.
Note that US and German (proxy for euro area) spreads are declining; UK spread rebounded in October, but I don’t have (comparable) November data. Japan’s spreads continue to trend sideways. Side note: These spreads inverted before the 2020 recession, suggesting that even if Covid had not struck, a recession may very well have occurred. In any case, more curves are inverting, although at different parts of the curve.
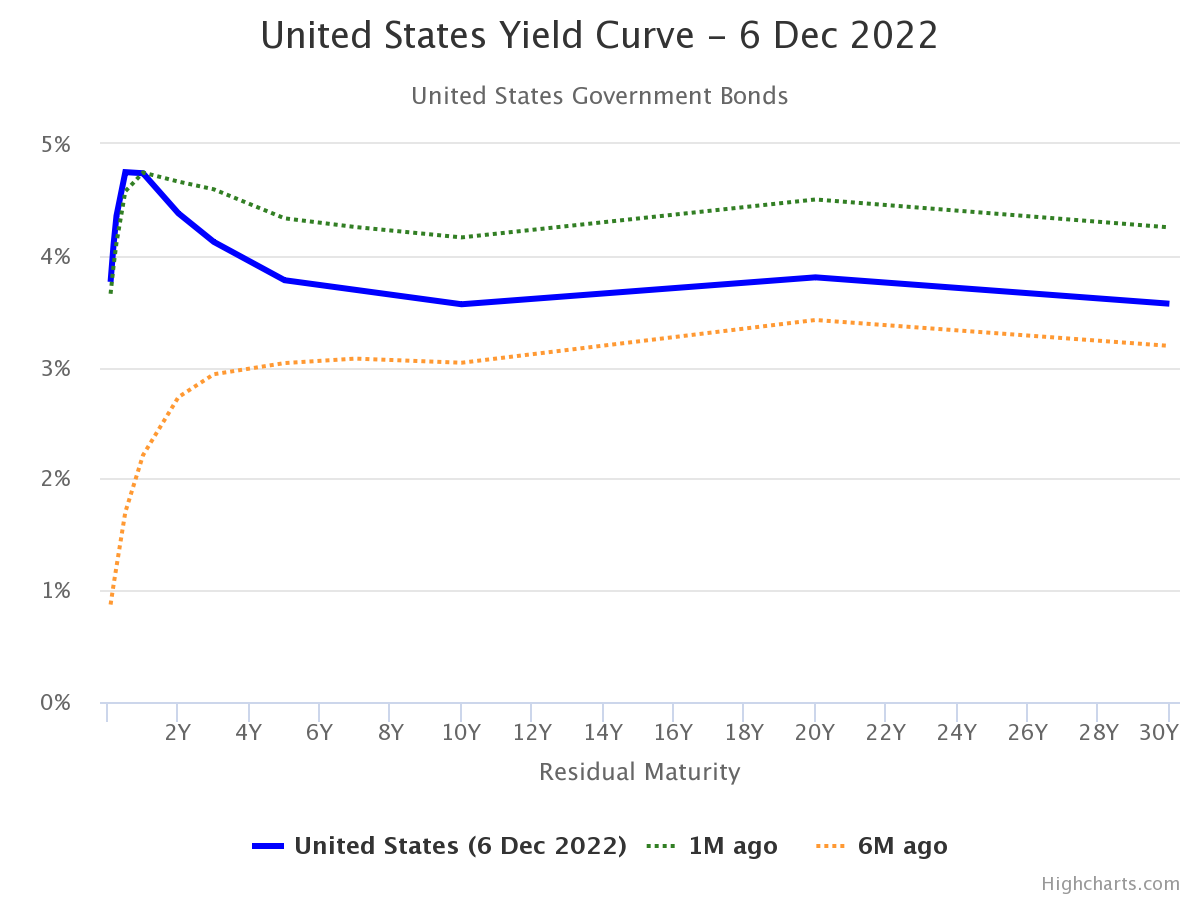
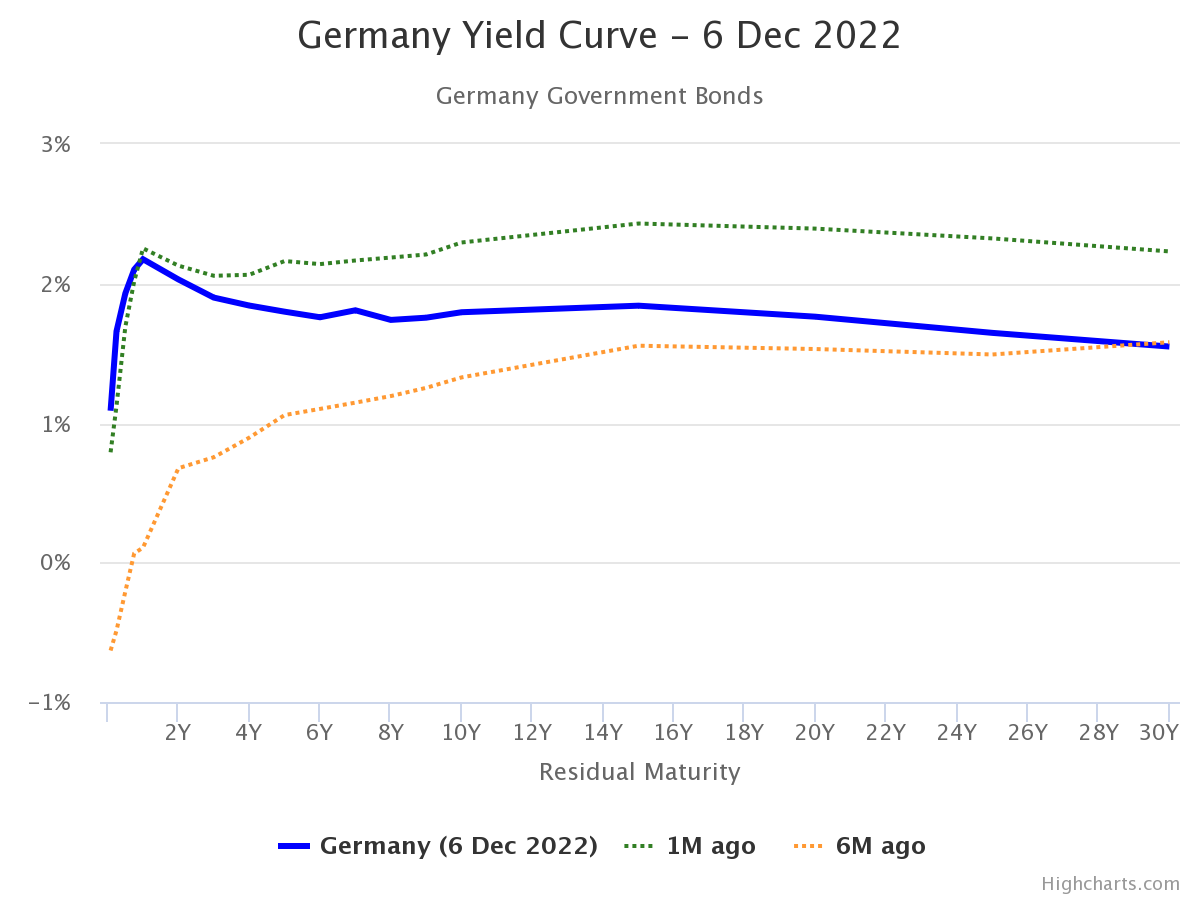
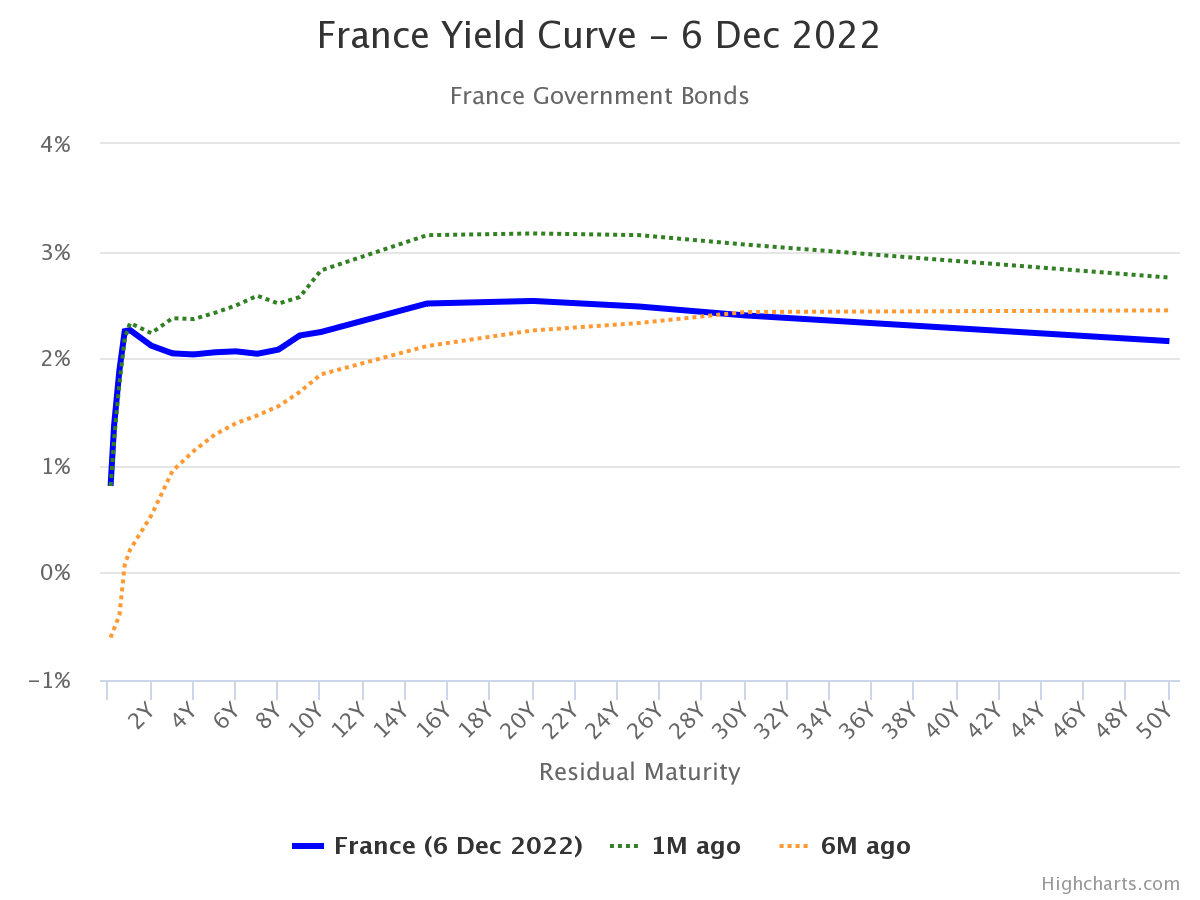
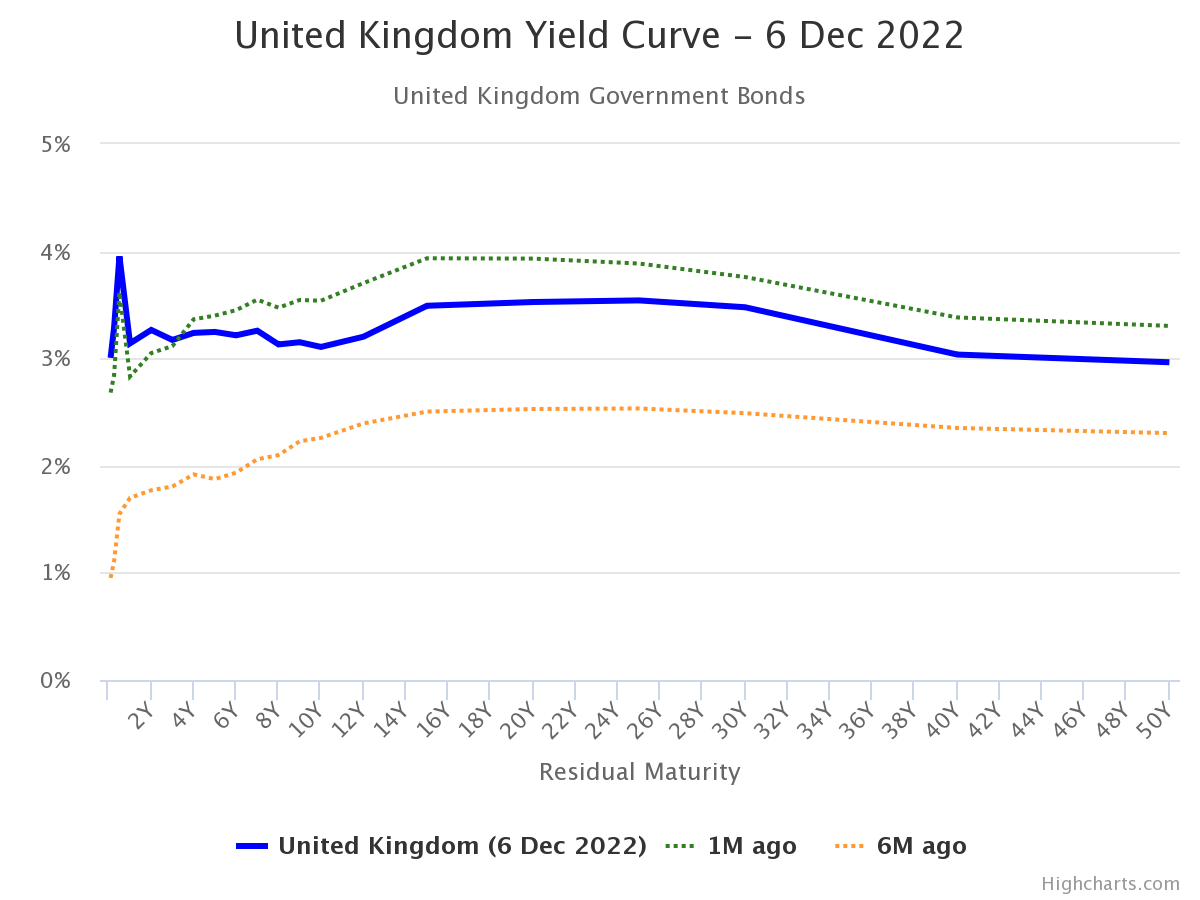
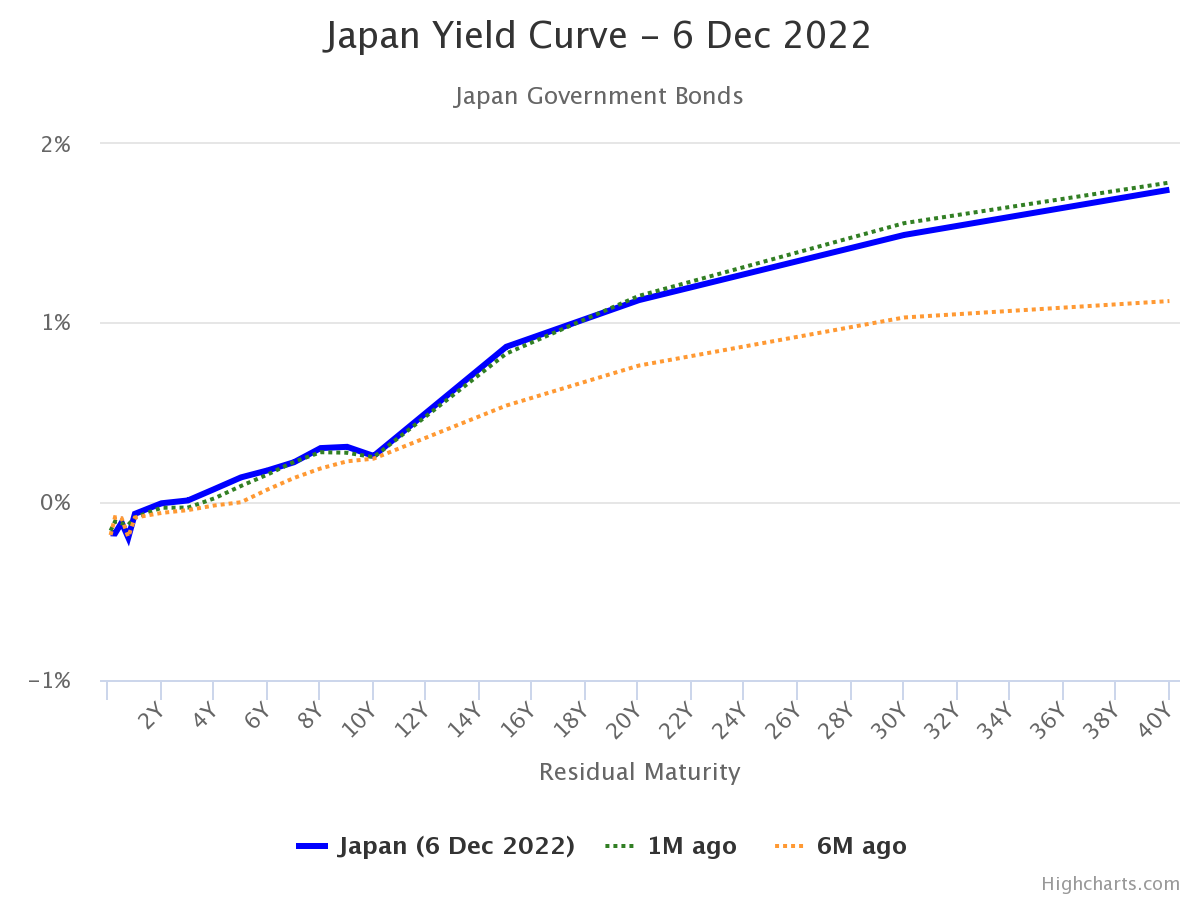
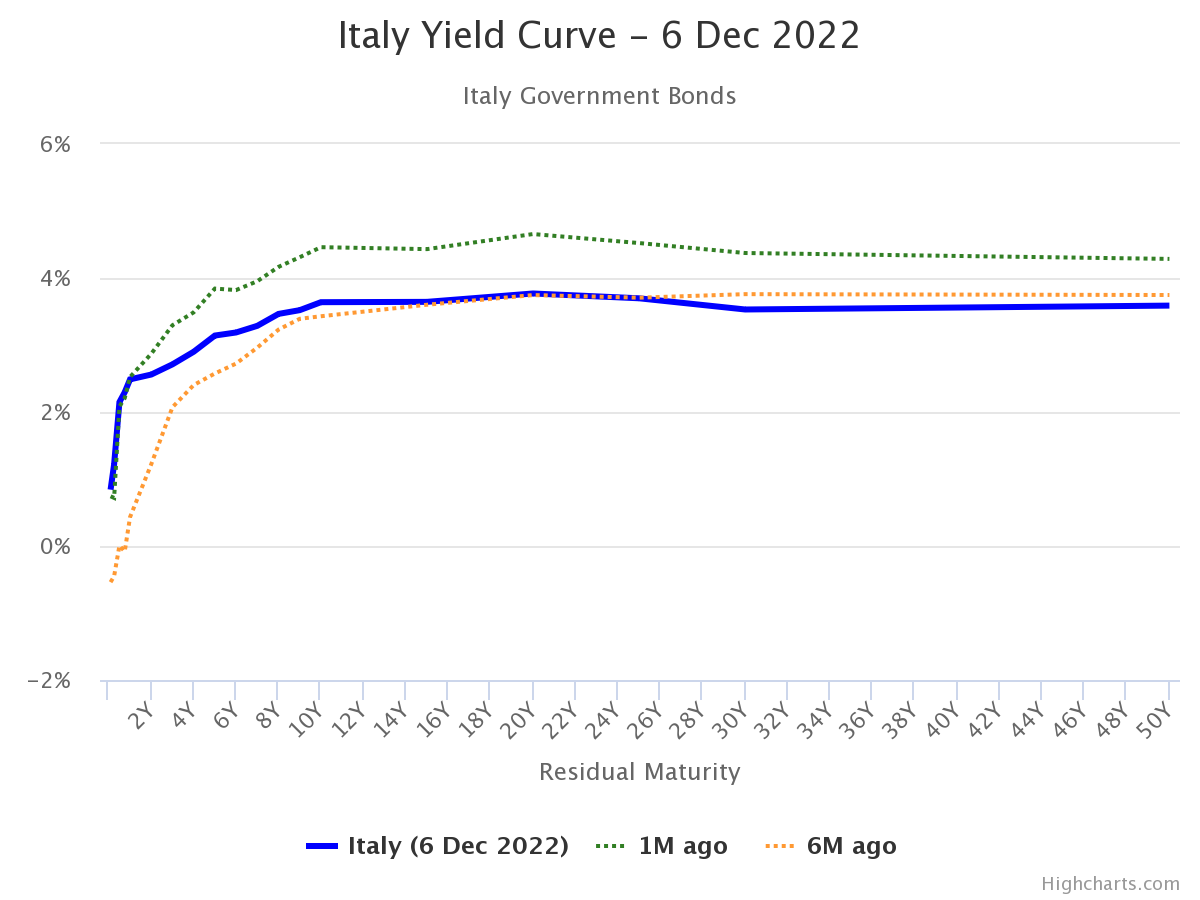
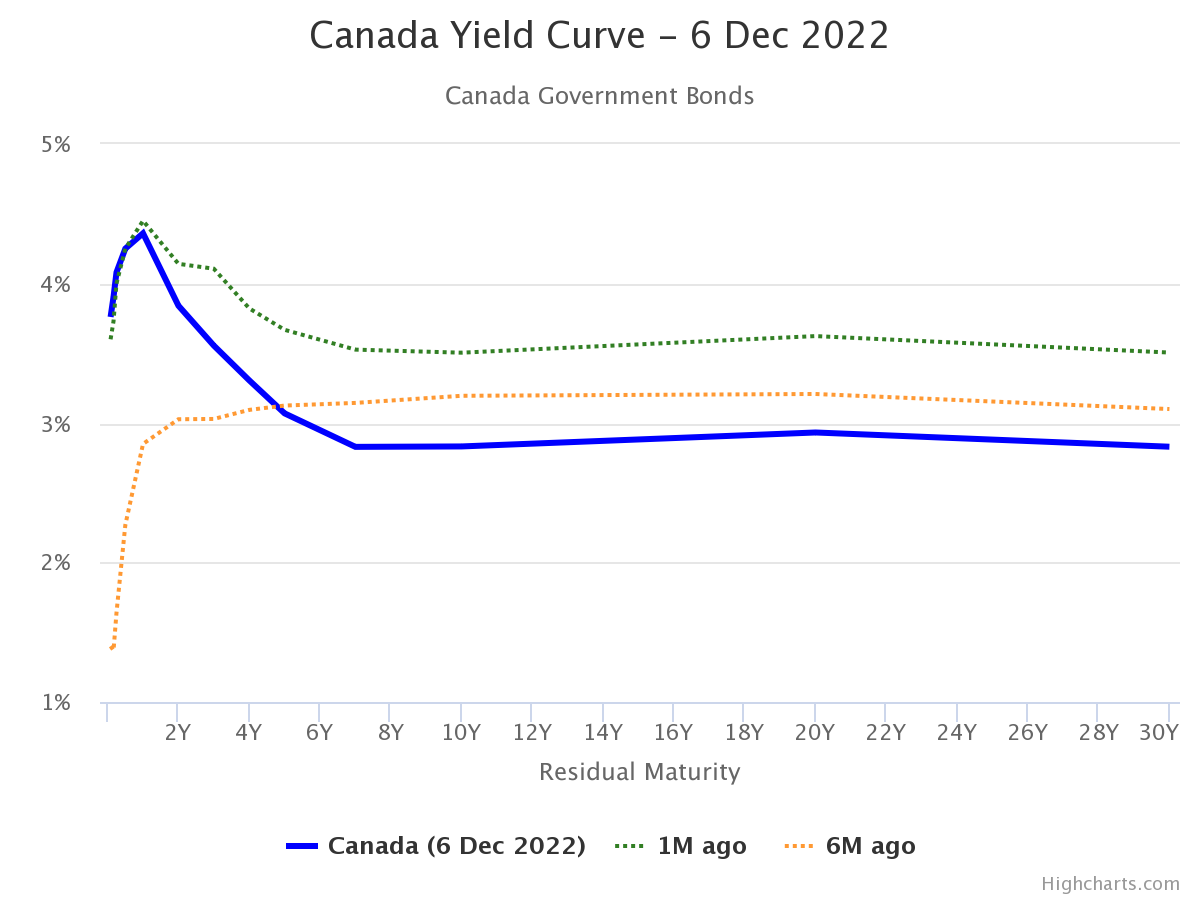
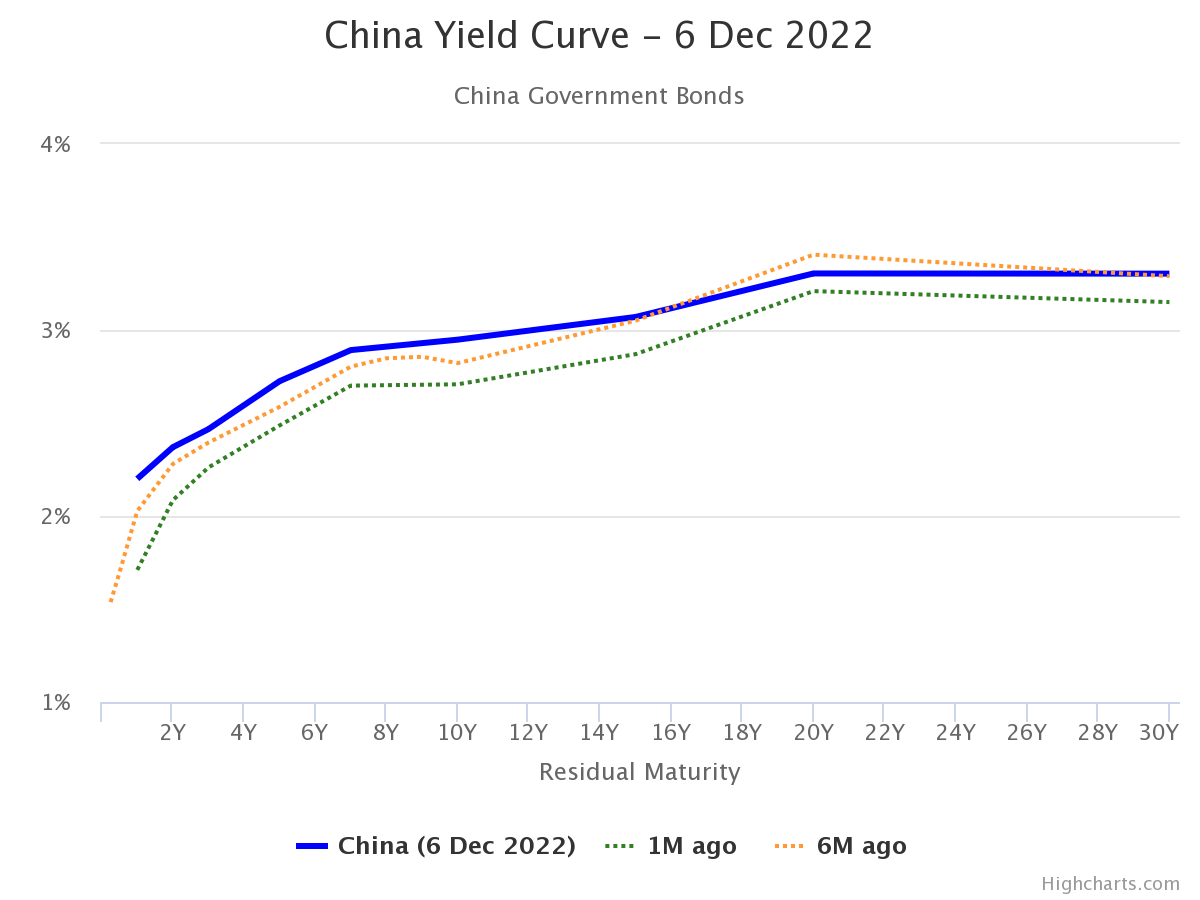
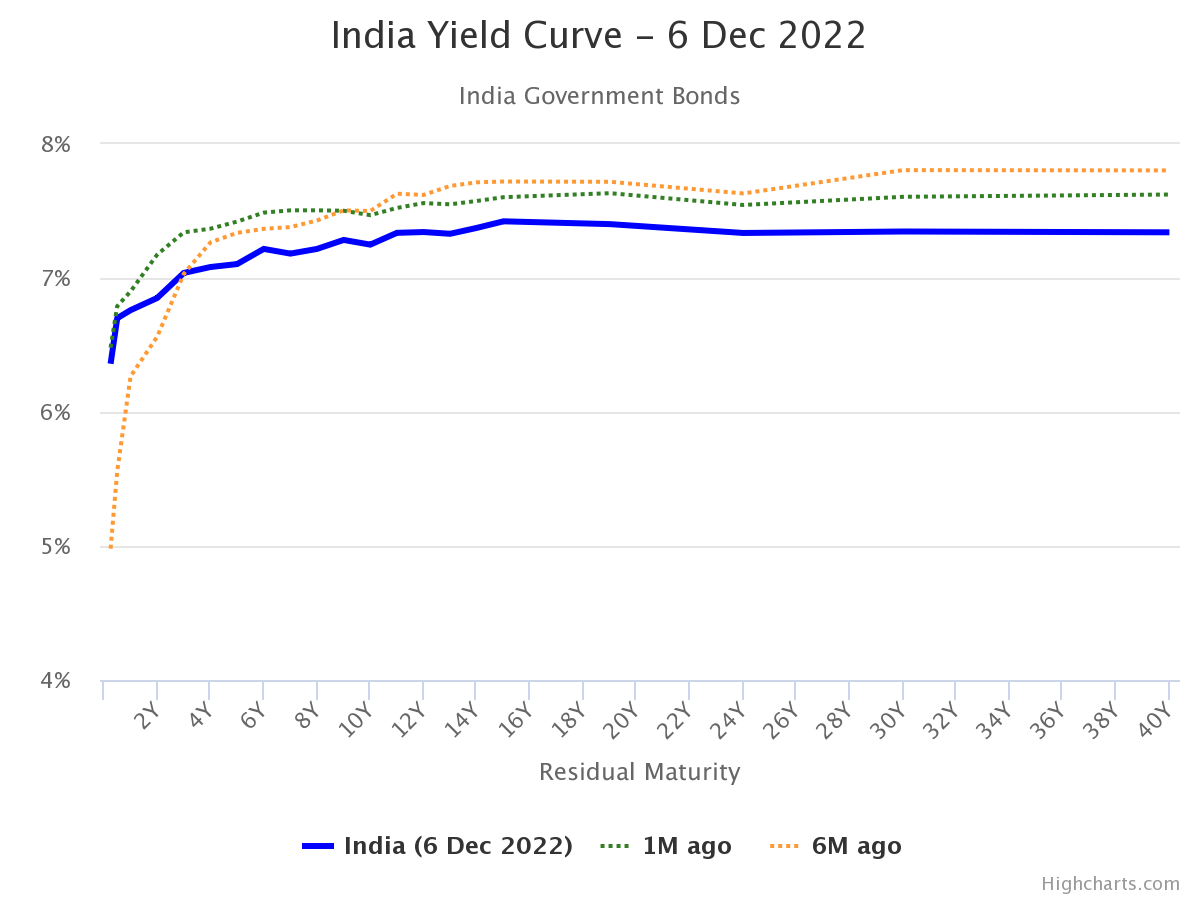
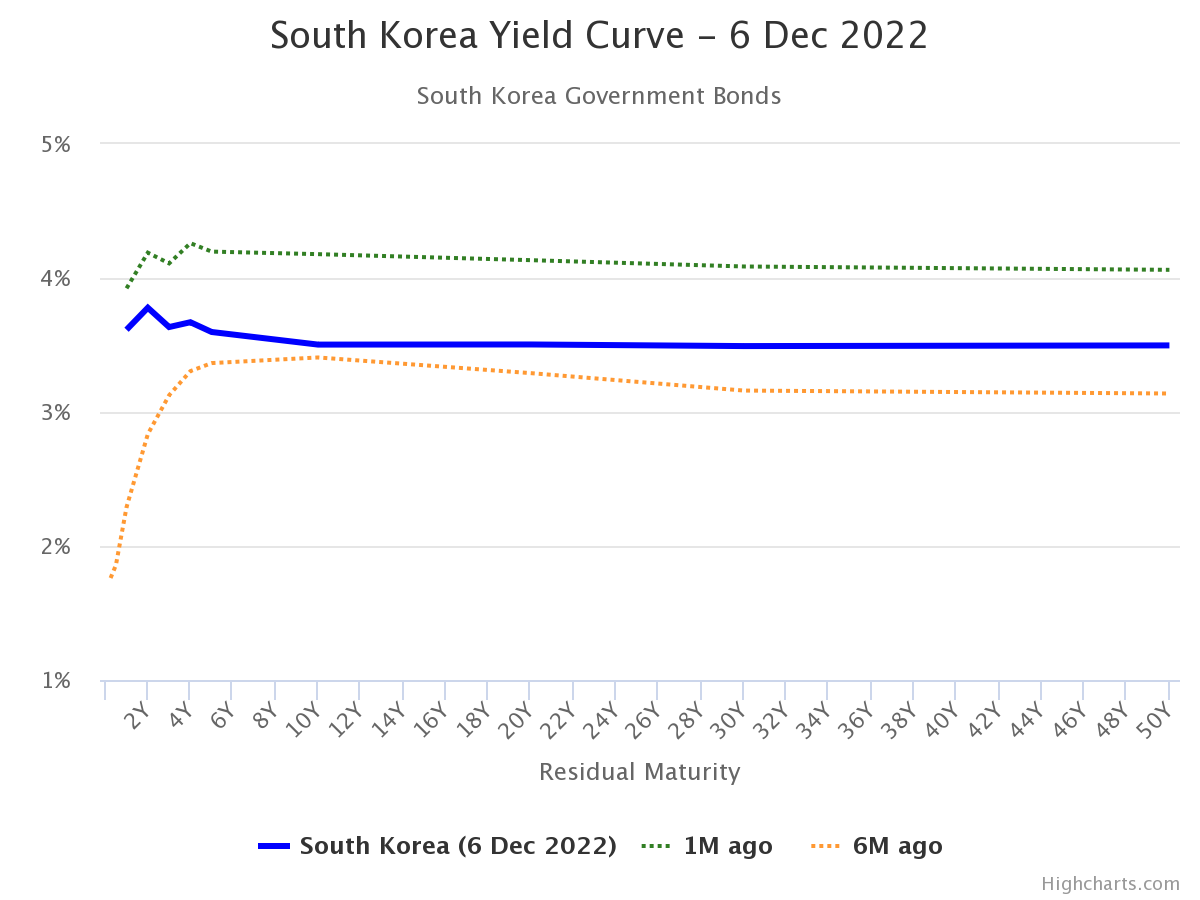
Here are yield curves for G-7 countries, as well as other large economies, recorded on December 6th, by worldgovernmentbonds.com.
Two other large economies not included in the G-7:
And one other large economy, Korea.
Chinn and Kucko (2015) found that the 10yr-3mo yield curve predicted recessions in US, France, Germany and (if including 3 month yield) Japan.
Some additional studies (including on China) recounted here.
While it doesn’t take away from the appeal and informativeness of the post, it’s worthy to note Deutsche Bank has been yelling out recession since roughly last April:
https://www.cnn.com/2022/04/26/economy/inflation-recession-economy-deutsche-bank/index.html
( “No”, he said, looking at his shoes, my memory is not that good, I saw it on the Google-muh-thingy )
This strikes me as a pretty promising data point for Warnock. If he is consistently doing better in this many counties, unless we think Warnock voters have some proclivity to vote early, to my eyes this pretty much makes it a slam dunk that Warnock wins tonight:
https://fivethirtyeight.com/live-blog/georgia-senate-warnock-walker/351668/
Warnock declared the winner.
Some might say it’s “obvious” but to me this is still a pretty outstanding point, and one I think I kind of knew, but hadn’t thought of so coherently:
https://fivethirtyeight.com/live-blog/georgia-senate-warnock-walker/351670/
“I think any difference that was going to emerge in the two margins was always going to be about differential turnout — i.e., if one side’s voters had disproportionately stayed home.”
BIS has noticed the large spread between mortgage rates and Treasury rates. “ There are emerging signs of fragility in the markets for agency mortgage-backed securities (MBS). As MBS trading volumes declined in 2022, their yield spreads over US Treasuries became unusually volatile compared with those over the past 35 years.
A shift in the composition of MBS buyers in 2022 could be a sign that the market has become more prone to bouts of volatility. Small investors and leveraged funds have become the main buyers, and they have been traditionally less forthcoming than banks in providing liquidity in times of stress. At the same time, monetary policy priorities may make it challenging for the Federal Reserve to backstop the MBS market, should the need arise. In this environment, surges in selling pressure could be particularly disruptive. “ A.graph in the article shows how high the spread has become.
https://mishtalk.com/economics/bis-warns-of-leverage-liquidity-risks-and-the-need-for-a-fed-backstop
What’s funny is that pgl, our resident genius and judge, could not even grasp the concept of unusually high spreads between mortgage rates and Treasury rates!
“Mishtalk”?!?!?! OMG, ZeroHedge’s ugly redheaded stepchild. Hahahahaah!!!! Hilarious. What’s next, are you going to give us Stacy Herbert quotes on cryptocurrency??
I decided to actually read this fluff. Note
” their yield spreads over US Treasuries became unusually volatile compared with those over the past 35 years. ”
The graph showed some measure of volatility rather than the actual spread. And Jonny boy does not know this difference? OK!
“What’s funny is that pgl, our resident genius and judge, could not even grasp the concept of unusually high spreads between mortgage rates and Treasury rates!”
Never mind the fact that I and Macroduck were discussing this spread well before you ever did. You have serious mental issues dude – take care of those before you have this weird need to lie needlessly again.
Hey Jonny boy – you may think that graph shows a spread = 0.6%, which would not be that high. But of course you cannot even read the legend of a graph as your weird “expert” was showing volatility not the level of the spread. So one more time SLOWLY just for you – this is how the grownups calculate credit spreads:
30-year mortgage rate as of 12/1/2022 = 6.49%
30-year government bond rate as of 12/1/2002 = 3.64% (not the 10-year rate morons like you use)
Spread = 2.85%
Now that is high as Macroduck and I both noted long before you ever did. Now I get all the little kiddies are now laughing at your utter incompetence so please pay attention to your preK teacher. DAMN!
Here’s the BIS link. Mishtalk quoted them correctly.
https://www.bis.org/publ/qtrpdf/r_qt2212.pdf
People you don’t like can still provide valuable information, particularly when they include links to highly respected sources. But Moses prefers to shoot the messenger rather than obtain good information and analysis. Is this SOP in economics today?
Maybe you did not notice but this BIS document is 90 pages. Now I doubt you have read anything beyond what your new favorite hack wrote. Then again – my comments, which did not shoot the messenger, noted how you utterly misrepresented what little you read.
Come on Jonny boy – your mother deserves not to be constantly embarrassed by her son this way.
The MBS discussion is in Box A, which is on pages 4 and 5 from this very long document. I read the entire discussion of MBS markets and it discussed rising volatility but never noted the actual credit spread at any point in time.
Now Jonny boy has been told by his preK teacher over and over to attend remedial reading lessons but I guess Jonny boy refuses to do so.
The graph clearly shows that the MBS spread to Treasuries is over 2x what it has been at any time during the last decade. It is over 3x the median spread from 1991 to the present.
Basically BIS is confirming what the WSJ wrote a couple weeks ago: “Nobody wants mortgages.” BIS: “ Small investors and leveraged funds have become the main buyers.” Bye-bye Fed, banks and institutional buyers, even with extraordinarily high spreads over Treasury.
As a result mortgages won’t become affordable to homebuyers unless BOTH the Treasury rates fall AND the spread over Treasury reverts to its long term. Housing market RIP for the foreseeable future.
Like leading a horse to water, providing credible to pgl is no guarantee that he’ll the least clue about what it says.
“The graph clearly shows that the MBS spread to Treasuries is over 2x what it has been at any time during the last decade. It is over 3x the median spread from 1991 to the present.”
Permit me to say this SLOWLY since you did not get my point the first time. The graph, which is clearly labeled, is showing volatility of the spread and not the actual spread. Yes – volatility is high. Now the spread may also be high but that is not what the graph shows. And this spread has been high before.
Jonny – let me ask a serious question. HOW EFFING STUPID ARE YOU? Damn!
https://www.stlouisfed.org/on-the-economy/2020/july/mortgage-rates-not-matching-declines-in-treasury-yields#:~:text=DESCRIPTION%3A%20The%20figure%20shows%20the%20mortgage%20spread%20from,with%20spikes%20during%20periods%20of%20extreme%20rate%20volatility.
‘The graph clearly shows that the MBS spread to Treasuries is over 2x what it has been at any time during the last decade. It is over 3x the median spread from 1991 to the present.’
This statement is clearly wrong and shows you have no clue what the data shows. Yes the spread – as I properly calculated – was most recently 2.85% but if you think the average spread is less than 1%, check out this FRED blog chart. And note in late 2008, this spread reached 3%.
You make some of the dumbest comments ever but this claim is beyond idiotic. You are referring to a chart of the volatility of the spread and not the spread.
Look dude – most people who have embarrassed themselves so utterly and so often might just quit writing the intellectual garbage you excel in. Until you learn to read an EFFING graph – SHUT UP!
This one is truly hilarious!!! pgl used a two year report to discredit what I said about current, extraordinarily high mortgage spreads!!!!
As if mortgage-treasury spreads haven’t dramatically risen in the last year year!!!
Come on, pgl, if you’re going to dispute my comments about what is happening today, you have to use current data.
Investopedia has some nice tutorials – this one explaining the concept of credit spreads with some references to MBS spreads.
https://www.investopedia.com/terms/n/nominal_yield_spread.asp#:~:text=Nominal%20yield%20spreads%20are%20a%20convention%20frequently-used%20in,point%20equal%20to%20their%20weighted%20average%20life%20%28WAL%29.
All sorts of good stuff including the need to match maturities between the private debt instrument and the corresponding government bond:
‘A nominal yield spread is the difference, expressed in basis points, between the Treasury and non-Treasury security of the same maturity.’
Yes the very 1st sentence. So why does JohnH use the 10-year government bond yield when looking at 30-year mortgage rates? Oh yes – he is an idiot.
Now the grown ups here might noted that a lot of mortgages are amortized over time so the duration is actually less than 30 years. But Jonny boy does not get advanced finance as the poor boy has to take off his shoes to count past 10.
Johnny, Johnny, Johnny…
We’ve been over this. Just because you’ve finally become aware of something doesn’t mean others have been unaware. In fact, you can safely assume that when you become aware of something, everyone else already knows. That is certainly the case with mortgage spreads. Everyone who went through the mortgage crash in the 2000s is aware of spreads, including pgl. You’re the slow kid.
You’ve made this claim about pgl and spreads before. Repeating it now is just dishonest. You know, lying.
There is a big difference between Jonny boy and the rest of us. The rest of us know how to calculate a credit spread. Jonny on the other hand does not even know what a credit spread even is.
Can MacroDucky and pgl provide any evidence that they had any clue about today’s extraordinarily high MBS to Treasury spreads?
When MacroDucky talked about mortgages recently, it had to do with getting Treasury rates down, not getting the spread over Treasury down. And he certainly failed to mention liquidity concerns.
It seems to me that the BIS concerns about mortgage markets liquidity would be a prime topic for discussion here, particularly since secondary mortgage market meltdowns have featured in many recessions in the last 50 years.
I read his very informed comments and he has done so many times. I have to but have your research assistant at the Kremlin to go back to my previous comments. Oh wait – if he does, then Putin will realize how utterly pathetic his little pet poodle really is.
I am wondering if there has been as much studying of the relationship between inverted yield curves in other nations as there has beein in the US. Do they have as strong a relationship in these other nations as seems to hold in the US?
Barkley Rosser: Mehl (2009) does a pretty good review, for 5yr-3mo spreads.
So, does Mehl find the yield curves providing similar forecasts in at least some of these other nations as they do in the US?
Link to paper, no paywall
https://www.econstor.eu/bitstream/10419/153125/1/ecbwp0691.pdf
Thanks for the link, Moses. As you like to point out from time to time, you are much better than I am at providing actually functioning links.
Anyway, I note that this paper does not really address the question I asked, which was about how well yield curves make these forecasts in the economies Dr. Chinn was talking about. I am especially curious about Japan. Rather this paper focuses on 14 emerging market economies, although our co-host did show curves for China and India. It does find that both their domestic yield curces as well as those in the US and the eurozone have some predictive capability regarding their future economies.
My suspicion is that this varies across nations, with, again say, the Us and Japan differing on this matter. But I do not know if that has been studied.
Barkley Rosser
It seems it is impossible to be courteous or show any kind of grace to you (“Reason A” on why I rarely attempt to), as your response is always to attempt to inflate your own ego. My first inclination when you asked this question~~which in my opinion was kind of a dumb question for you to ask based on Menzie’s prior posts and papers~~was, had you even read the Chinn and Kucko paper which kind of addresses very clearly the same damned question you were asking.
Moses,
I guess I am not sure what has set you off with this blast at me. I thank you in all sincerity for providing the link for the Mehl paper, even admitting my ongoing bungling regarding providing links here, something you have denounced me for quite vigorously on several occasions.
So, what do you do? You denounce me for not having read the Chinn and Kucko paper. But Dr. Chinn posted that here in response to my question after I noted that this Mehl paper did not answer the question I had raised. Are you on my case because I had not read this 2015 paper PRIOR to his posting it here?
Sorry, Moses, maybe I should be reading every paper Dr. Chinn writes. But, sorry, I do not have rime to do that. How many other people should I be reading every single paper of? I understand that you do not know what I do. I am editor of a journal. I am slso the coeditor of the New Palgrave dictionary, whose third edition is over 13,000 pages with over 2700 entries. I am reading a whole lot of papers by lots and lots and lots of people all the time as part of my professional responsibilites, quite aside from reading papers by students. But you take me to task because I have not been reading every single paper by our co-host?
Are you actually aware of what you did here? Did you somehow think that I made my comment about the Mehl paper AFTER Dr. Chinn made his post that provided his paper with Kucko that answered the question I raised in my comment? Is this rant against me here a result of you being completely out of it?
Anyway, here I am being I think polite and appreciative towards you, and you just stupidly and inappropriately crap all over me. Wow.
To whom it may concern:
We’re pretty much wrapped up for tonight election wise, Walker has conceded on Twitter:
https://fivethirtyeight.com/live-blog/georgia-senate-warnock-walker/351835/
Walker’s conceding is perhaps the one classy move he has made during the entire campaign. Maybe he has a sense of shame or a tiny portion of conscience?? Who knows, but at least on that one front he’s better than Kari Lake etc. Let’s give the bum that much.
Walker said respect the Constitution? I bet that set Trump into a rage.