Plain vanilla probit models indicate a high probability of recession, especially using the 10yr-3mo spread:
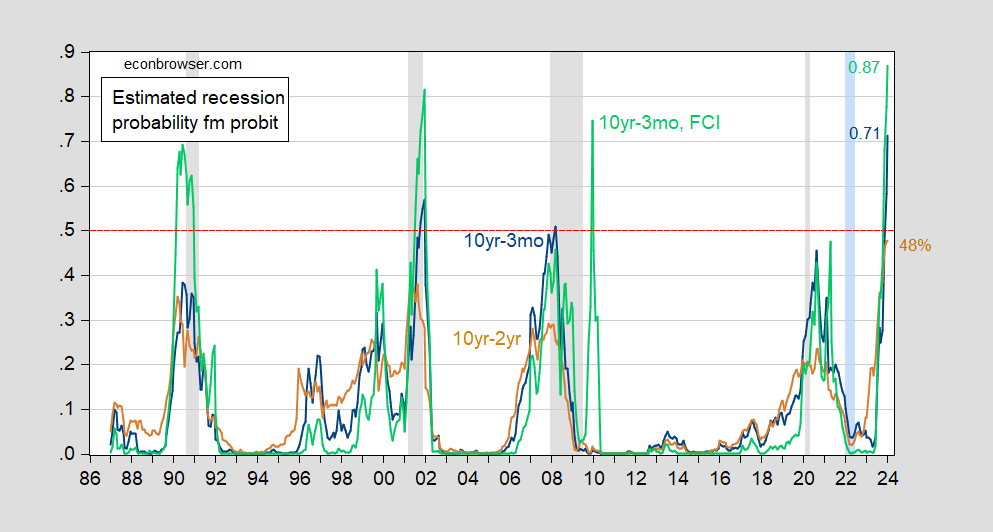
Figure 1: Forecasted probability of recession from 10yr-3mo term spread (blue), from 10yr-2yr term spread (tan), 10yr-3mo term spread augmented by FCI (green). All models estimated over 1986M01-2023M01. NBER defined peak-to-trough recession dates shaded gray. Red dashed line at 50% probability. Source: author’s calculations, NBER.
The 10yr-3mo spread implied recession probability breaches the 50% threshold; while the 10yr-2yr does not, it comes very close. Adding in a financial conditions index pushes the probability to 87%, but this specification also yields a false positive in 2009-10.
These are the spreads as of today (January data runs through January 30th).
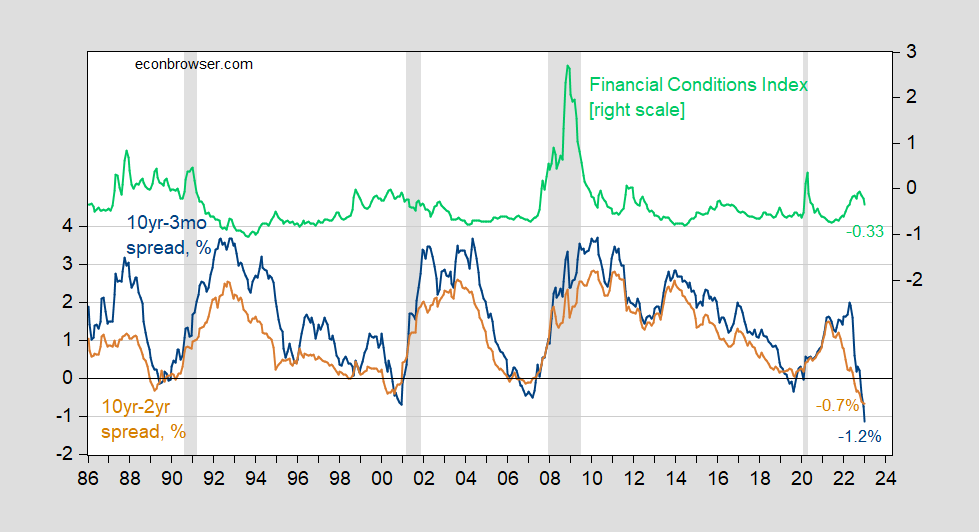
Figure 2: US Treasury 10yr-3mo term spread (blue, left scale), 10yr-2yr (tan, left scale), both in %, and Chicago Fed National Financial Conditions Index (green, right scale). January 2023 spreads thru 1/30; FCI thru 1/20. NBER defined peak-to-trough recession dates shaded gray. Source: Treasury, Chicago Fed via FRED, NBER, and author’s calculations.
Interestingly, one of the main early proponents of the term spread as indicator, Campbell Harvey, has argued that this time is different:
Despite the curve being inverted for the ninth time since 1968, Harvey said it’s probably not a harbinger for a recession.
…
‘Dodge the Bullet’
Harvey’s model was linked to inflation-adjusted yields and he said the fact inflation expectations are inverted — meaning traders see price pressures easing through time — also eases odds for a recession ahead.“When you put all this together it suggests we could dodge the bullet,” Harvey said. “Avoiding the hard-landing — recession — and realizing slow growth or minor negative growth. If a recession arrives, it will be mild.”
Indeed, the term structure of inflation expectations is (or was) also inverted, as opposed to what occurred before the 2007-09 and 2020 recessions.
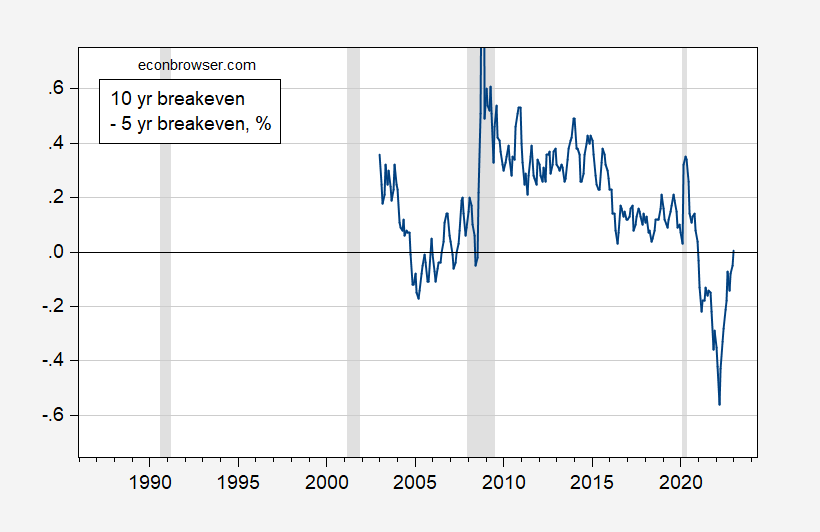
Figure 3: 10 yr inflation breakeven minus 5 yr inflation breakeven, calculated using Treasury-TIPS spreads, % (blue). NBER defined peak-to-trough recession dates shaded gray. Source: Treasury via FRED, NBER and author’s calculations.
The estimated term structure of inflation expectations from the Philadelphia Fed indicates lower expected inflation at longer horizons, and this is more pronounced than it was a year ago, and even a month ago (see Philadelphia Fed estimates). He reiterated this point just a few hours ago [video].
So, we’ll see if this time is indeed different…
[I don’t have ready access to the foreign term spread for January, so I can’t estimate the Ahmed-Chinn specification.]
Would you believe me if I told you this small state uni bachelor’s degreed slow-minded (at times) dude told you the last thing you addressed in the post was the first question I was going to ask you in the thread??
Interesting.
Yesterday [30 January] afternoon on FOXBUSINESS, the Duke U. Finance prof who [they say] first pointed to the inverted/negative yield curve as recession predicter says “It’s different this time.”
He cited strong labor demand.
Still significantly above pre-pandemic levels. I see continuing huge liquidity among households. FDIC-insured banks’ aggregate deposits are just under $20 trillion, though down about $400 billion in the past two quarters.
At least this time a “this time its different” guy gave a half decent (not a half assed) explanation. I still think the use of a categorical parameter (recession yes or no) on something that clearly is a continuous parameter (economic growth parameters and their rates) is a bad idea. Sure a 5-year old may scream for a “yes – or – no” answer, but adults should be able to handle something a little more informative.
PS: That last sentence would be my standard answer to a house GOP committee member asking stupid questions.
Better get ready for a stinking pile of BS as GOP is trying to explain away exactly how they are going to balance the budget
https://www.cnn.com/2023/01/30/politics/white-house-debt-ceiling-kevin-mccarthy/index.html
It is great to see Biden getting ready to do an aggressive PR fight against the GOPs insanity. Even if they (as expected) refuse to explain the details of their cuts, then the democrats can simply make up (Fox style) unpopular cuts that GOP supposedly are proposing. Slowly forcing them to say that they will not cut this and not cut that until they are cornered in needing to make 100% cuts on everything they have not yet exempted. This could become a great show of white house competence vs GOP.
Are you one of the six guys that still follows CNN?
COMPETENCE is what got us here.
It’s very simple.
Either tell Powell to debit UST assets and credit the US Treasury checking account for $5 trillion OR order the engraving office to print 5 trillion more in Federal Reserve Notes.
Easy Peazy
The same story was covered by MSNBC. Now go back to watching Tucker Carlson while you don your KKK outfit.
Since April 2022, 25 bp, 50 bp, 75 bp, 75 bp, 75 bp, 75 bp, 50 bp, 25 bp [today] – altogether 450 bp FF target rate hikes to 4.50% – 4.75%, from 0 – 0,25%.
Prine rate will increase to 7.75%.
And GDP growth is positive. And unemployment is at near 50-year lows.
Just the facts.
I know Dr. Chinn is not fond of youtubes but your level of stupidity rivals even Dr. Evil:
https://www.youtube.com/watch?v=LCZMhs_xpjc
Dr. Evil One Hundred Billion Dollars
EIA 914 is out. Small drop from OCT 12.410 MM bopd to NOV 12.375. The OCT number was revised up from 12.381 as of last month.
https://www.eia.gov/petroleum/production/#oil-tab
On the gas side, total withdrawals were up ~1 BCF/d, from 121.593 BCF/d to 122.574. But if you factor out AK (and you should, it’s not connected to the gas grid and 90% gets pushed back into the ground), L48 was up 0.2 BCF/d over the month. Which equates to 2.4 BCF/d/year, which is a decent rate of increase. Traditionally we’ve done about 3 BCF/d/yr during the shale boom.
https://www.eia.gov/petroleum/production/#ng-tab
Gas has recovered more strongly since Covid and is already well above the pre-Covid peak of 116.885 BCF/d in NOV2019. Oil is still more than a half million bopd under the pre-Covid peak of 13.000 MM bopd in NOV2019.
I’m expecting a drop in oil next month reported (DEC2022) based on seasonality (essentially winter in ND). Gas may continue to rise.
Picked up $25 of gasoline yesterday at $2.87. But I am no bozo and I check around. I would say the average price in my area for gasoline is $3.05
Anyone need a solid laugh for their Tuesday afternoon?? Check out Kimberly Dumbbell’s commentary on page A13 of the Jan 27 WSJ. Her gist?? “Oh no!!! the Evil Left is not just coming to take your guns. Now they are coming for your natural gas range stove!!!!!! Aaaaaaaaahhhh!!!!”
Hahahahaah!!!! Kimberly Dumbbell is hilarious!!!!! Slow news week for Ms. Dumbbell.
I respect, I greatly respect, any man who goes “against the grain” and even “sorta kinda” against his own research paper—-RESPECT to Cam Harvey. MUCH respect