Our short answer: yes.
From NBER working paper No. 30737 (update of findings in this post) by myself and Rashad Ahmed, out today (abstract):
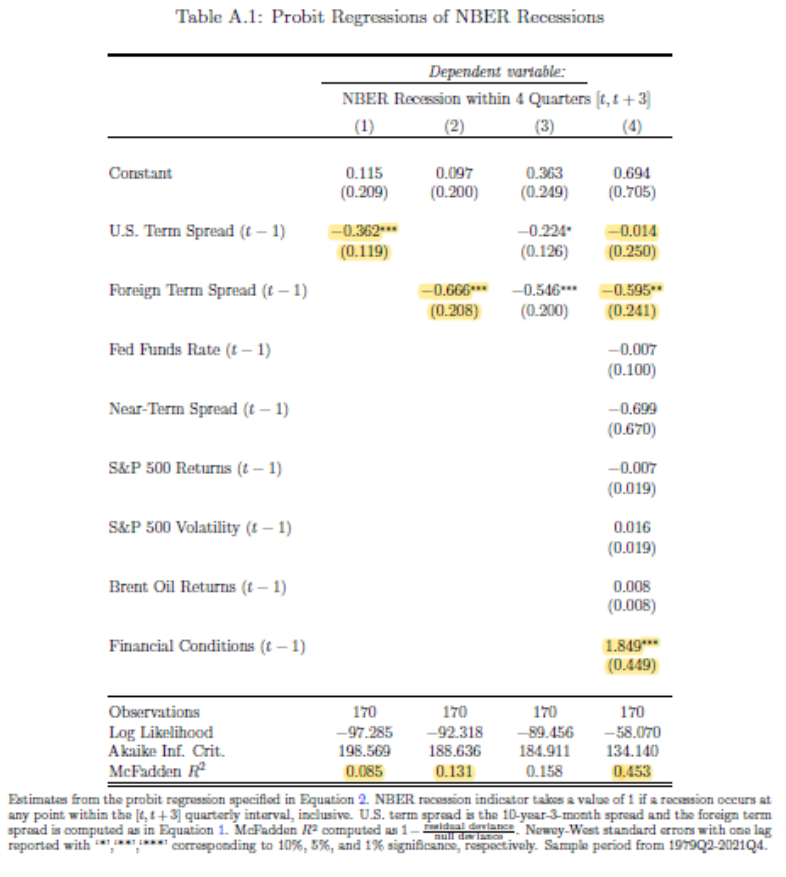
This paper shows that foreign term spreads constructed from bond yields of non-U.S. G-7 constituents predict future U.S. recessions and that foreign term spreads are stronger predictors of U.S. recessions occurring within the next year than U.S. term spreads. U.S. and foreign term spreads are both informative of the U.S. economy but over different horizons and for different components of economic activity. Smaller U.S. term spreads lead to smaller foreign term spreads and U.S. Dollar appreciation. Smaller foreign term spreads do not lead to significant U.S. Dollar depreciation but do lead to persistent declines in U.S. exports and FDI flows into the United States. These findings are consistent with the proposition that foreign term spreads embed growth spillovers from the U.S. and the resulting Dollar strength and slowdown abroad spill back to the United States.
Here’s the AUROC for US term spread only (model 1), for foreign term spread only (model 2), and US and foreign term spread plus other variables plus financial conditions index (model).
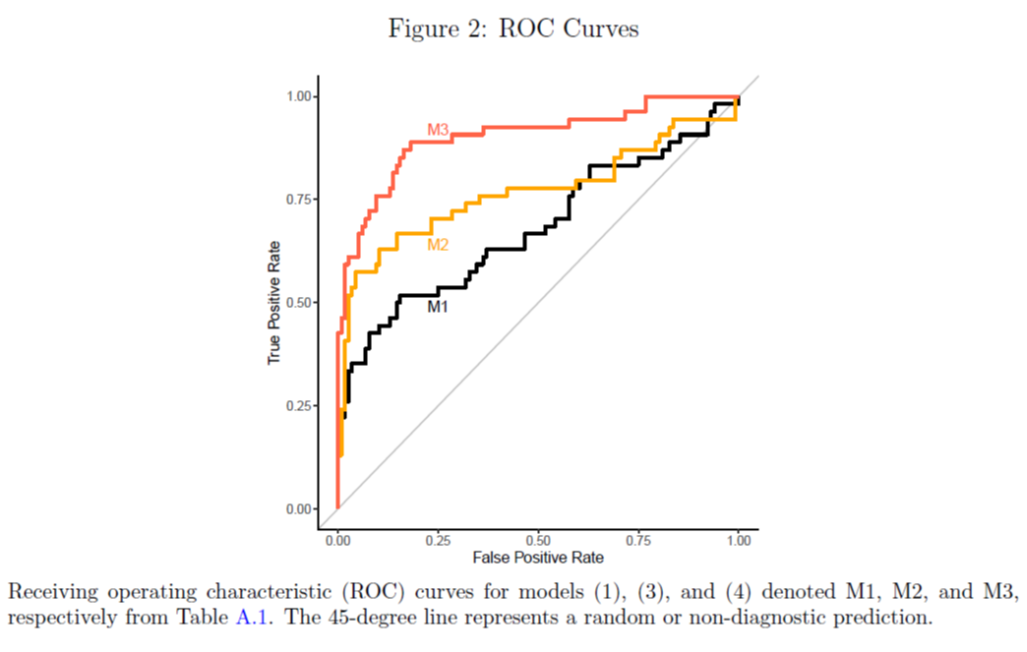
These AUROCs pertain to columns (1), (2), and (4) in Table A.1. Notice we are not saying the US term spread is not predictive; just that including the foreign term spread and a slew of other US variables, results in a not-statistically-significant coefficient on the US term spread (the US term spread does show up as signficant in column (3)).
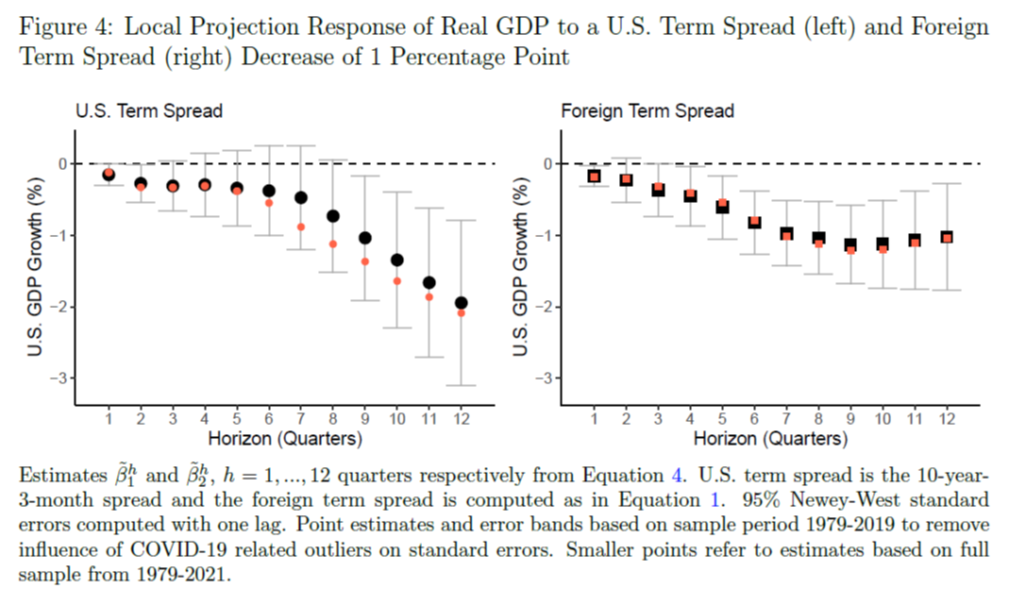
Turning to GDP growth, Figure 4 shows impulse response functions in response to a 1 ppt increase in the US(foreign) 10yr-3mo spread.
Here si the current situation with respect to 10yr-3mo spreads (Treasury minus 3 month Treasury or interbank, depending on what OECD reports):
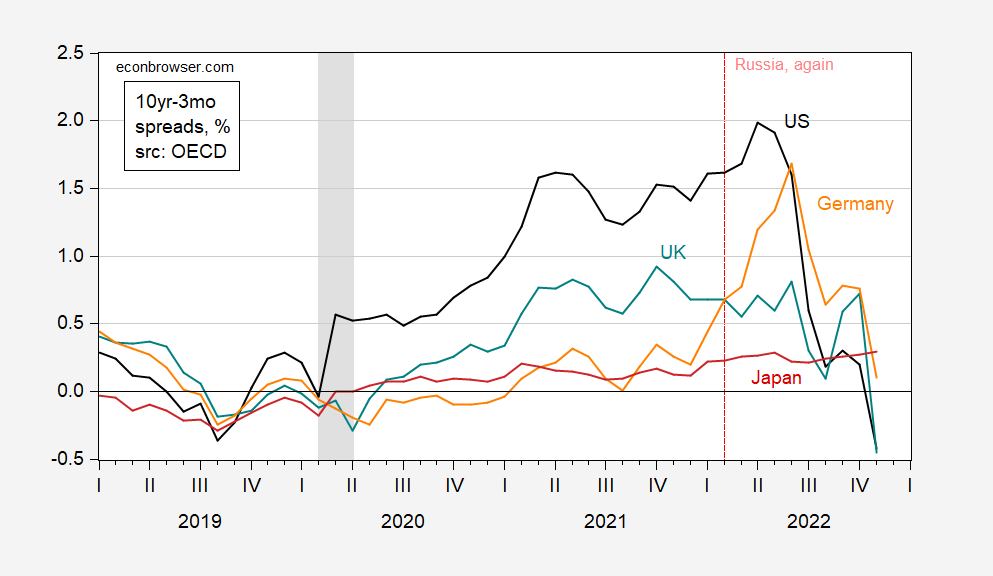
Figure 1: Ten year government bond yields minus three month rates for US (black), UK (teal), Germany (orange), and Japan (red), %. Three month rates are government bond yields for US, interbank rates for others. NBER defined peak-to-trough US recession dates shaded gray. Source: Treasury via FRED, OECD Main Economic Indicators, updated with Tradingeconomics.com, NBER, and author’s calculations.
Foreign yield curves in Germany (proxy for Euro area) and UK are inverting. The Japanese term spread remains positive however.
We also identify the response of the dollar to term spread shocks.
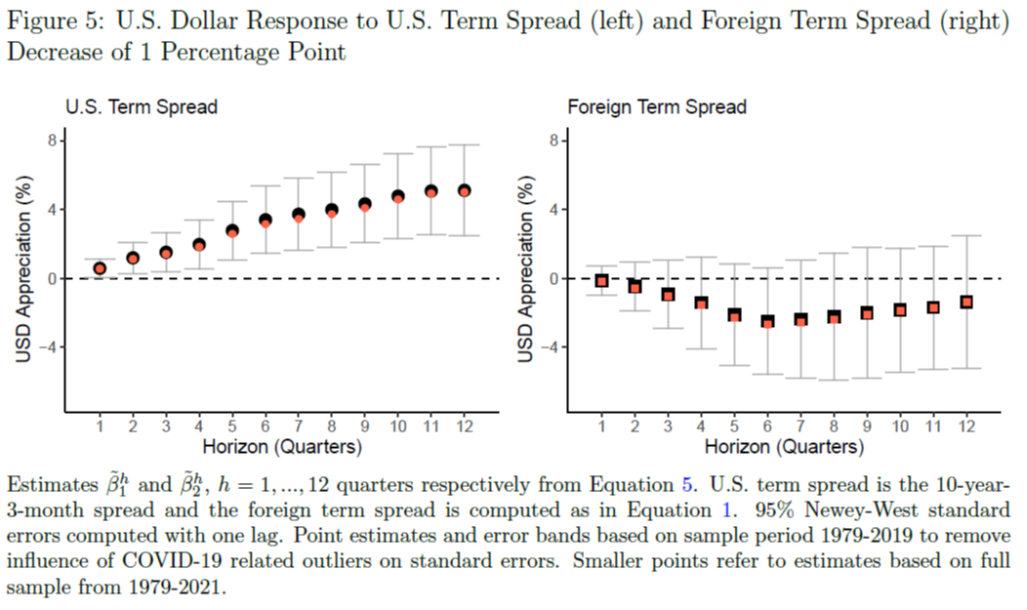
A positive shock to the US spread appreciates the dollar, while one to the foreign spread depreciates the dollar. However, only the US IRF shows statistical significance. This finding is consistent with Chen and Tsang (2013).
Addendum, 3:52pm Pacific:
Rashad Ahmed adds an update to account for current data:
Using data available as of December 13, 2022, our model forecasts a recession probability within the next 12 months of 68.1%. This is up from a probability of 42.5% taken August 15, 2022. For context, the median recession probability from the model was 16.7% over the 1979-2021 period and even lower when excluding recession periods. A reading as high as 68.1% had a false positive rate of 1.7 percent and a true positive rate of 59 percent between 1979- 2021. In the 6 recessions since 1979 to 2021, a reading of 68.1% or higher was virtually always followed by a recession.
Currently the following term spreads are inverted:
- US – inverted
- Germany – not inverted
- Japan – not inverted
- UK – inverted
- Canada – not inverted
| Input | Source, Date | Value |
| US 10Y-3M | Bloomberg, 12/13/22 | -0.80% |
| Foreign 10Y-3M | Market Watch & Investing.com, 12/13/22 | 0.36% |
| Fed Funds Rate | FRED, Nov 2022 | 3.78% |
| US 2Y-3M | Bloomberg, 12/13/22 | -0.08% |
| Stock Return | Yahoo! Finance, 9/12/22-12/12/22 | -4.38% |
| Stock Volatility | Yahoo! Finance, 9/12/22-12/12/22 | 26.59% |
| Brent Oil Return | Investing.com & FRED, 9/14/22-12/13/22 | -14.34% |
| Financial Conditions | FRED, 12/2/22 | -0.22078 |
“Smaller foreign term spreads…lead to persistent declines in U.S. exports and FDI flows into the United States. These findings are consistent with the proposition that foreign term spreads embed growth spillovers from the U.S. and the resulting Dollar strength and slowdown abroad spill back to the United States.”
Findings are consistent with ROW serving as a positive feedback mechanism from U.S. growth to U.S. growth, yes? Is there some way to differentiate between feedback and impulses originating abroad? That is to say, could developments abroad, not originating in the U.S., account for some or all of the result?
Maybe some “big data” text analysis of international news to connect the “developments originating abroad”?? They call it “machine learning”?? Seems like overkill to me, but I’m lazy type, so…… I mean I think those things would be consequential enough most of the time so as not to need to create an algorithm watching Reuters or something. Maybe the effort is worth it, but at first thought seems like overkill, similar to DSGE. How and when has DSGE “tipped us off” or given us early foresight on anything?? Name one, I’d love to hear it. But people get government grants to do them, so I guess the social welfare component of grants etc to do DSGE must be nice for PhDs I’m sure.
Moses,
What are you talking about here? This paper has no machine learning and no DSGE modeling. It is pretty straightforward and the reasoning is pretty reasonable, that developments in other nations impact the US economy through changes in our exports.
“Is there some way to differentiate between feedback and impulses originating abroad? That is to say, could developments abroad, not originating in the U.S., account for some or all of the result?”
I could find a fourth grader, who if they had read the blog thread in an orderly fashion, instead of letting an oversized ego gloop out liquid manure out of their every skin pore, would have known the question I was addressing. God help the reputation of PhDs across America if you are to be considered representative of their reading comprehension.
Moses,
Yeah, egomaniacal me got it that you were commenting on the reasonable comment by your “brother” Macroduck. The problem was that your comment on it was ridiculous and incoherent nonsense.
Has this undergone “peer review” from BlueStatesResidentKopits yet?? (I only made this comment, in a cheap, down and dirty attempt to make Menzie mouth-vomit).
I never met Mike Leach personally, but he was my favorite active college football coach. Similar to my fanaticism of Kevin Durant, I will gravitate to being a fan of whatever team he was currently connected with (Like I immediately became a fan of the Brooklyn Nets when they acquired Durant). I liked Mike Leach best, because he never played college football, but proved you don’t have to BE an egg in order to know how to cook an egg. Mike never divorced his wife (not worthy of an award, but rare in today’s world) or cheated on her. That’s how they did it in the old days folks. Marriage is a promise for life. It’s actually a simple concept. Mike Leach was a man who truly marched to the beat of his own drummer, unleashed a kind of ‘tough love” on his players, had a degree in Law (how many football coaches do?). Was literate in a hodge-podge of topics and was willing to take on the extreme hypocrisy of the NCAA bureaucracy. He’s going to be missed by the people who personally knew him, and greatly missed by people like me who admired him for afar, or just enjoyed reading and listening to his comedic quips and William Burroughs-like comedic routines. He was stolen from his family at the age of 61. I suspect this will be one of the better “write ups” about him:
https://247sports.com/college/mississippi-state/Article/Mike-Leach-Mississippi-State-strange-friends-200240095/
Honestly, one of the coolest things I’ve seen you post.
Consumer Price Index Summary
https://www.bls.gov/news.release/cpi.nr0.htmrise even
One should wander over the Kevin Drum’s place for his discussion of this BLS plus bonus coverage showing inflation adjusted weekly earnings. Inflation last month was quite low so real earnings managed to partially offset some of the year’s previous declines.
Of course Bruce Hall told us inflation was going to rise – which it didn’t. Brucie and his barking dog CoRev told us overall energy prices would rise even though gasoline prices are falling. Turns out overall energy prices fell last month.
So yea – skip what these two clowns claimed as Kevin Drum’s blog post are a lot more honest.
https://www.bls.gov/news.release/cpi.nr0.htm
Use this link please.
Having read the bloviating BS from Bruce Hall who must have received a PhD in disinformation, I thought I should share what Kevin Drum posted:
Inflation dropped like a stone in November
https://jabberwocking.com/inflation-dropped-like-a-stone-in-november/
At the end of some good details Kevin wrote:
The big newspapers all reported that inflation was “easing,” which is the right take. But they underestimate just how much it’s easing because reporters focus on headline inflation and on the useless annual figures. That’s precisely the opposite of what they should do. The meaningful data is core inflation measured monthly, and in November it plummeted to 2.4% on an annualized basis. That’s noisy data, so don’t take it as gospel, but at the same time it’s very good news. Core inflation measures the bedrock economy, and this month’s figures say the economy is in pretty good shape.
One way to take the noise out the m/m numbers is to report what has happened in the last 3 months. By this measure the annualized rate is only 3.69%. Not 7.1% and not Bruce Hall’s little lie about 13%.
pgl,
LOL! You need to be able to read more carefully before you attempt to make snide and disparaging comments. Just do a quick search for “reading comprehension made simple”.
Oh, and try reading everything in the context it was written.
For example, from January 2021 to June 2022, inflation as measure by the CPI rose almost 13.3%; since June 2022 there has been virtually no measured overall inflation.
https://www.rateinflation.com/consumer-price-index/usa-historical-cpi/
See, I did you a favor by including the link again. I’m really quite considerate.
Brucie – while you might rely on something written by clowns on the internet, I rely on the reporting from the BLS. Now little boy – get back to your preK classes and finally learn something.
Hey Bruce – I get you are incapable of checking the BLS data and comparing it to your goofball source so I had a little table for you:
Date BLS Bruce
2021-01-01 262.200 261.582
2022-06-01 295.328 296.311
Your moronic source got the data wrong. Of course Brucie got a PhD in getting everything wrong!
Brucie – your source writes some really dumb things:
USA inflation summary for November 2022
Updated: December 13, 2022
Next update: January 12, 2023
Current USA inflation rate
November 2022
7.110%
The Consumer Price Index for United States of America is 297.711 for the month of November 2022. The inflation rate year over year is 7.110% (compared to 7.745% for the previous month). Inflation from October 2022 to November 2022 was -0.101%.
*** Let’s stop there – are they doing yr/yr or m/m? They do not say. But check this:
Previous USA Inflation Rate
October 2022 to November 2022
-0.101%
Month-to-Month USA Inflation Rate
October 2022
7.745%
**** WTF? These guys are bozos ***
Their reporting for the CPI for Nov. 2022 was not consistent with what BLS says. They say they are using BLS data but I guess these morons are reporting a different version of CPI than what people refer to as the headline rate. OK Brucie – this is your source. Please tell us which version of CPI your bozos are using. Do you even know? I did not think so.
pgl, another thing: Rex Nutting at Marketwatch was making the same 3.7% claim based on excluding cabanas, figs, and bikinis or some such arbitrary adjustment meant to make everyone feel better. The 3-month moving average is fine for filtering some noise. You could pick 6 months, too, if you wanted a little more smoothing.
But I’m more interested in trends and turning points which are a little more difficult to pick up without additional history. Year-over-year inflation numbers still show inflation despite the CPI showing less than 1% upward change since June (which appears to be at least a temporary turning point). Those yr/yr changes mean upward inflation is recognize too late (the Fed is notorious for that) and reduced inflation is recognized too slowly (again the Fed).
You want to agree with me, but you’re too invested in not doing so.
“You could pick 6 months, too, if you wanted a little more smoothing.”
Then do so – oh wait, that also shows how stupid your rant was. Never mind. Rex Nutting at Marketwatch reported was what BLS reported for the overall price index not some subset. You might have noticed that had you bothered to check the actual data. But Brucie is not capable of doing so relying on some clown who posts trash on the internet.
Keep it coming little troll as knocking down your garbage is so fun.
“Rex Nutting at Marketwatch was making the same 3.7% claim based on excluding cabanas, figs, and bikinis or some such arbitrary adjustment meant to make everyone feel better.”
Nutting was properly using the overall index seasonally adjusted. Your moronic secondhand source was reporting different numbers. Do you have the slightest clue why your moronic source had different numbers? Did they leave out cabanis or are you so high on canabis that you never noticed these clowns using not seasonally adjusted numbers without telling you?
Come on Brucie – we get you lie for Kelly Anne Conway. We get you are dumber than a rock. But damn – your latest little episode is embarrassing even for you.
https://news.bloomberglaw.com/us-law-week/kavanaugh-holiday-party-appearance-raises-more-ethics-questions
Politico reported that Justice Brett Kavanaugh attended a private holiday party on Friday night at the home of Matt Schlapp, who is chairman of the Conservative Political Action Coalition (CPAC), and that attendees included Stephen Miller, whose group America First Legal Foundation has interests in cases now pending before the court. Kavanaugh’s party-going raises questions about when a justice’s personal relationships cross a line and become problematic. Democrats have recently renewed calls for sitting Supreme Court justices to follow a formal judicial code of ethics.“ Supreme Court justices should be extraordinarily careful in not only having no actual ethical difficulties but having no appearance of an ethical conundrum as well,” said Tonja Jacobi, a professor at Emory University School of Law. Especially now, given “the legitimacy of the court at the moment is taking,” she said.
Ethics issues aside – we want to know how much beer did he consume? After all – it would be bad if he started trying to rape the ladies at this party.
https://talkingpointsmemo.com/meadows-texts
THE MEADOWS TEXTS
A Plot To Overturn An American Election
The messages you are about to read are the definitive, real-time record of a plot to overturn an American election.
https://fred.stlouisfed.org/series/M2V
Velocity of M2 Money Stock
Macroduck has taken up the good work trying to convince Princeton Steve that the Quantity Theory of Money is nothing more than a worthless identity with no value in any model of macroeconomics. Of course most people knew that decades ago but we know Princeton Steve is a stubborn loud mouth clown. His latest is to claim GDP/M2 is mean reverting but he has no clue what the mean that velocity reverts to. His claim was that the mean should be seen as 1.5
FRED provides this ratio back to 1959. For 30 years it did hover around 1.8 not 1.5. Then it rose for a while and then fell back to circa 1.45. Of course over the past few quarters, it has been just over 1.1. Of course Stevie has this brilliant idea that we are in a new era of QTM version 3.0. I guess he has redefined the mean to 1.2.
Yea – this is all idiotic babbling by Princeton Steve. But come on folks – that is all he ever does regardless of the subject.
A MAGA judge trying to end birth control?
Matthew Kacsmaryk, a Trump appointee to a federal court in Texas, spent much of his career trying to interfere with other people’s sexuality. A former lawyer at a religious conservative litigation shop, Kacsmaryk denounced, in a 2015 article, a so-called “Sexual Revolution” that began in the 1960s and 1970s, and which “sought public affirmation of the lie that the human person is an autonomous blob of Silly Putty unconstrained by nature or biology, and that marriage, sexuality, gender identity, and even the unborn child must yield to the erotic desires of liberated adults.” So, in retrospect, it’s unsurprising that Kacsmaryk would be the first federal judge to embrace a challenge to the federal right to birth control after the Supreme Court’s June decision eliminating the right to an abortion.
Last week, Kacsmaryk issued an opinion in Deanda v. Becerra that attacks Title X, a federal program that offers grants to health providers that fund voluntary and confidential family planning services to patients. Federal law requires the Title X program to include “services for adolescents,” The plaintiff in Deanda is a father who says he is “raising each of his daughters in accordance with Christian teaching on matters of sexuality, which requires unmarried children to practice abstinence and refrain from sexual intercourse until marriage.” He claims that the program must cease all grants to health providers who do not require patients under age 18 to “obtain parental consent” before receiving Title X-funded medical care. This is not a new argument, and numerous courts have rejected similar challenges to publicly funded family planning programs, in part because the Deanda plaintiff’s legal argument “would undermine the minor’s right to privacy” which the Supreme Court has long held to include a right to contraception. But Kacsmaryk isn’t like most other judges. In his brief time on the bench — Trump appointed Kacsmaryk in 2019 — he has shown an extraordinary willingness to interpret the law creatively to benefit right-wing causes.
The “sexual revolution” didn’t begin in the 60’s or 70’s, but more likely the 1900’s. Like most historical fantasizing, you live your beta male lifestyle they love.
Really fine paper:
“Do Foreign Yield Curves Predict U.S. Recessions and GDP Growth?”
I know Cato is anathema on this blog, but there was an interesting post regarding term spreads the other day.
https://www.cato.org/blog/why-fed-further-inverting-yield-curve-4
Regarding the CPI coming in at 7.1% over prior year, I find it more useful to look at the index itself and then calculate trends from different points. For example, from January 2021 to June 2022, inflation as measure by the CPI rose almost 13.3%; since June 2022 there has been virtually no measured overall inflation. Part of the latter is due to the decline of gasoline prices which offsets some of the other price increases, but overall the most recent trend of inflation is flat. Now that’s good news and bad news. Obviously, the good news is that overall inflationary pressure has stopped for half a year; the bad news is that it’s still 13% or so higher than when Biden became POTUS and that’s a general hardship.
https://www.rateinflation.com/consumer-price-index/usa-historical-cpi/
There is some discussion about food prices continuing to increase because of poor crop results, but that’s a volatile sector for prices. Housing prices have moved slightly lower and demand has dropped, but inventory remains considerably lower than pre-COVID so the pressure against prices is not as great as 2008. https://fred.stlouisfed.org/series/ACTLISCOUUS
Prices for new vehicles have flattened since Spring, but still way too high, especially EVs which are supposed to be the bedrock of Biden’s climate plan. https://ycharts.com/indicators/us_consumer_price_index_new_cars_and_trucks_nsa
But supply chain issues persist.
https://www.mhlnews.com/global-supply-chain/article/21254630/forecasts-the-state-of-us-supply-chains-in-2023
It would seem that, given the current conditions, the Fed may want to reconsider plans to keep hiking interest rates or at least the amount of the hikes.
https://www.wsj.com/articles/slowing-inflation-could-intensify-fed-debate-over-when-to-stop-raising-rates-11670947999?tpl=cb
Given the babble here from you including your 7.1% maybe you might actually READ this note since you claim it was interesting. Come on Bruce – focus:
He provided charts depicting year‐to‐year changes about a variety of concerns, such as earnings and core services inflation, but took little notice of overall PCE inflation in recent months. “One problem I had with Powell’s speech,” tweeted Paul Krugman, “was that all the charts were YoY, [12‐month averages] which probably miss much of the disinflationary news of recent months.” Asked about recent inflation, Chair Powell’s only comment was “while the October inflation data received so far showed a welcome surprise to the downside. These are a single month’s data, which followed upside surprises over the previous two months.” A single month is certainly too short a period to detect changes in trend, but twelve months are too long. The past four months of lower inflation, on the other hand, cannot be casually dismissed just because some months were lower than others.
Oh wait – these considerations would tell us inflation right now is a lot lower than 7.1%. If you have any doubts – try reading Kevin Drum’s take on the CPI data released just today.
Now we know you are claiming inflation is rising so reality once again has become rather inconvenient for you. Too bad troll – the rest of us do not live in your Kelly Anne Conway Alternative Facts fantasy.
“Obviously, the good news is that overall inflationary pressure has stopped for half a year; the bad news is that it’s still 13% or so higher than when Biden became POTUS and that’s a general hardship”.
Oh gee – the price level rose by 13% over a TWO YEAR period. That is how Brucie boy calculates the inflation rate? Are you really THIS stupid or just helping Kelly Anne lie again? BTW Brucie – do us all a big favor and calculate the nominal rise in gross domestic income. Actually all if nominal income rises faster than the price level, real income is up. Not a general hardship.
Do you not even get the most basic concepts? It appears not.
Brucie thinks he is a clever boy always inventing new ways of distorting the data as if the rest of us will never figure out how cleverly deceptive he can be. His latest here is just lame. Report the increase over a TWO YEAR period of time as if “inflation” were 13% – which of course it is not.
But to tell us that people are worse off when the price level increases sort of forgets that nominal income can increase. And over the past TWO YEARS, nominal GDI has increased by 21.9%.
Now most of the kiddies in preK realize that a 21.9% increase is greater than a 13% increase. But not little Brucie boy.
Why is the Fed Further Inverting the Yield Curve? Did Alan Reynolds of CATO approve this dumb title.
The FED does not determine the yield curve. After all financial markets determine the 10-year government bond yield as well as shorter term government bond yields. Yes the FED can influence financial markets. I would have thought even the goof balls at CATO would understand this but maybe not.
“For example, from January 2021 to June 2022, inflation as measure by the CPI rose almost 13.3%”
I had to check to see if you were even lying about this and you were. CPI rose (CPI is not inflation as we have reminded the dumbest troll ever many times) but over this period it rose by 12.6%. Come on Brucie – lying is one thing but assuming we do not check is stupid.
BTW – one does not calculate the annual inflation rate by taking the increase over a 17 month period. I’m assuming you are not that dumb so I guess you abuse statistics to lie not to inform.
BTW I want to help your poor preK teacher. It is true from Nov. 2021 to Nov. 2022 CPI rose by 7.1%. So one can say inflation over this period = 7.1% but to say inflation rose by 7.1% is terrible writing. You need to stop making such retarded comments and get back to your remedial reading and writing classes.
“…the bad news is that it’s still 13% or so higher than when Biden became POTUS and that’s a general hardship.”
Pretty glib with those endpoints. Biden had no effect on the economy in the first months after inauguration. He didn’t cause Russia to invade Ukraine, which caused a brief very high rate of rise in energy prices. This is the usual “how to lie with statistics” stuff.
Even if the price level rose by 13.3% (it was only 12.6%), Brucie claim of hardship implicitly assumes that nominal income over this period did not rise at all. I fact, the increase in nominal income over this arbitrary period exceeded 15%.
But Brucie never learned either basic economics, reliable sources of data, or even counting past 10 without taking off his shoes.
https://fred.stlouisfed.org/graph/?g=CgJo
January 15, 2020
Sticky Consumer Price Index and Sticky Consumer Price Index less Shelter, 2020-2022
(Percent change)
https://fred.stlouisfed.org/graph/?g=w3Wk
January 15, 2018
Sticky Consumer Price Index and Sticky Consumer Price Index less Shelter, 2017-2022
(Percent change)
https://fred.stlouisfed.org/graph/?g=Fn2j
January 15, 2018
Consumer Price Index for Rent and Owners’ Equivalent Rent, 2017-2022
(Percent change)
https://fred.stlouisfed.org/graph/?g=MO8n
January 15, 2018
Consumer Price Index for Rent and Owners’ Equivalent Rent, 2017-2022
(Indexed to 2017)
https://fred.stlouisfed.org/graph/?g=BkzA
February 25, 2015
Velocity of M2 money stock, * 1960-2014
* http://krugman.blogs.nytimes.com/2015/02/25/monetarism-in-winter/
The velocity of M2 — the ratio of nominal Gross Domestic Product to a broadly defined version of the money supply — has turned out to be hugely variable.
Paul Krugman
https://fred.stlouisfed.org/graph/?g=E1g5
January 15, 2018
Velocity of M2 Money Stock, 1960-2022
I guess Princeton Steve might say there are some series which are very variable but mean revert. GDP/M2 is very volatile but the idea that it has exhibited mean reversion died a long time ago.
https://fred.stlouisfed.org/graph/?g=UQC8
January 30, 2020
Consumer Price Indexes for New and Used cars & trucks, 2020-2022
(Percent change)
https://fred.stlouisfed.org/graph/?g=UQCH
January 30, 2020
Consumer Price Indexes for New and Used cars & trucks, 2020-2022
(Indexed to 2020)
Dr. Chinn,
So is this a revised version of the paper you linked to earlier that suggested foreign yleld spreads predict US downturns better than US ones? The multiple regression result with both in is pretty impressive in that regard. My guess is that including ‘financial conditions” is probably gobbling up a lot of the explanatory power that the US yield spread had when it was run by itself.
So, with the US yield inversion more negative than the foreign ones, that suggests if this paper’s results hold, that the probability of recession in the US forthcoming is somewhat lower than would be predicted by just the spread of the now inverted US yield curve.
https://fred.stlouisfed.org/graph/?g=QeCl
January 4, 2018
Average Hourly Earnings of All Private and Production & Nonsupervisory Workers, * 2017-2022
* Production and nonsupervisory workers accounting for approximately four-fifths of the total employment on private nonfarm payrolls
(Indexed to 2017)
https://fred.stlouisfed.org/graph/?g=Qe7j
January 4, 2020
Real Average Hourly Earnings of All Private and Production & Nonsupervisory Workers, * 2020-2022
* Production and nonsupervisory workers accounting for approximately four-fifths of the total employment on private nonfarm payrolls
(Indexed to 2020)
I expect this game to be close but it wasn’t. Argentina 3 Crotia 0! Messi was brilliant.
Years ago, I worked with some operating characteristic curves related to binomial sampling, but must admit, not being familiar with ROC and AUROC. The link below was necessary for me to understand ROC and AUROC presented in the post. The YouTube link was very helpful to follow Professor Chinn’s post. Maybe others are as ignorant as I and the post could help with understanding.
https://www.youtube.com/watch?v=4jRBRDbJemM
Thanks for the share AS, it’s greatly appreciated.
Signed, Southern Plains Slow Guy
Moses,
You’re welcome.
We can’t know everything or perhaps most topics discussed here.
I find this to be a really interesting approach to researching this topic. I’m curious what prompted you and Mr Ahmed to look into foreign yield curves as a predictor of these domestic variables.
Econned,
Well, Dr. Chinn can provide his own answer, but on reading the paper while not much attention has been paid to this, there have been people previously who have suggested that foreign yield curves might have this effect going all the way back to a paper in 1994 by Plosser and Rouwenhurst. But this paper substantially advances this and studies it in much more detail, with some pretty impressive results. In any case, it is not something weird coming from way out in the blue yonder.