Undershoots consensus at 0.4%. M/M headline at -0.1 vs 0.3%.
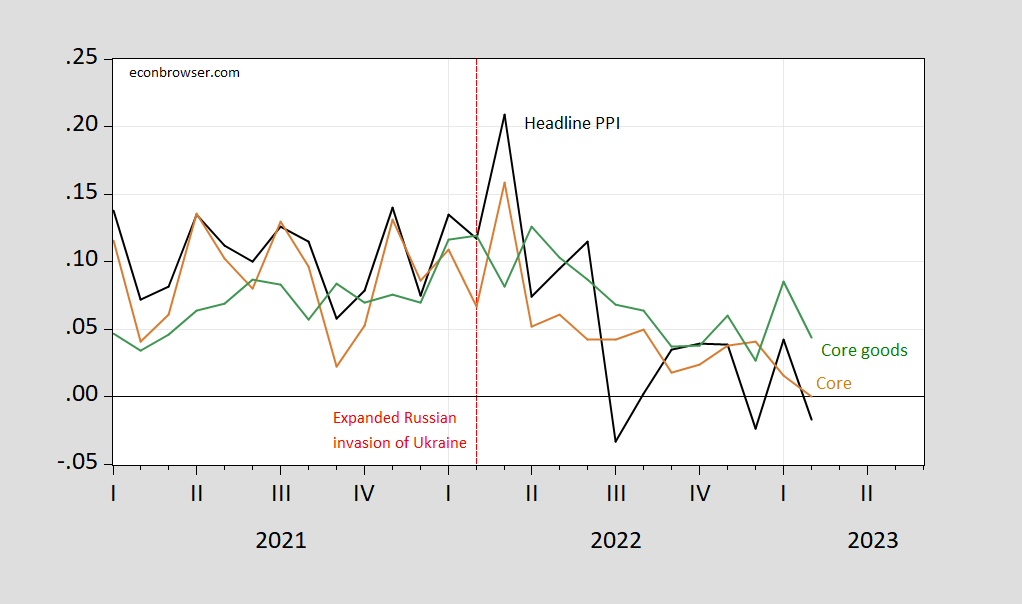
Figure 1: Annualized month-on-month PPI inflation (black), core PPI (tan), and core goods PPI (green), all in %. Source: BLS, and author’s calculations.
Instantaneous inflation (T=12, a=4) exhibits the same downward trend that core does.
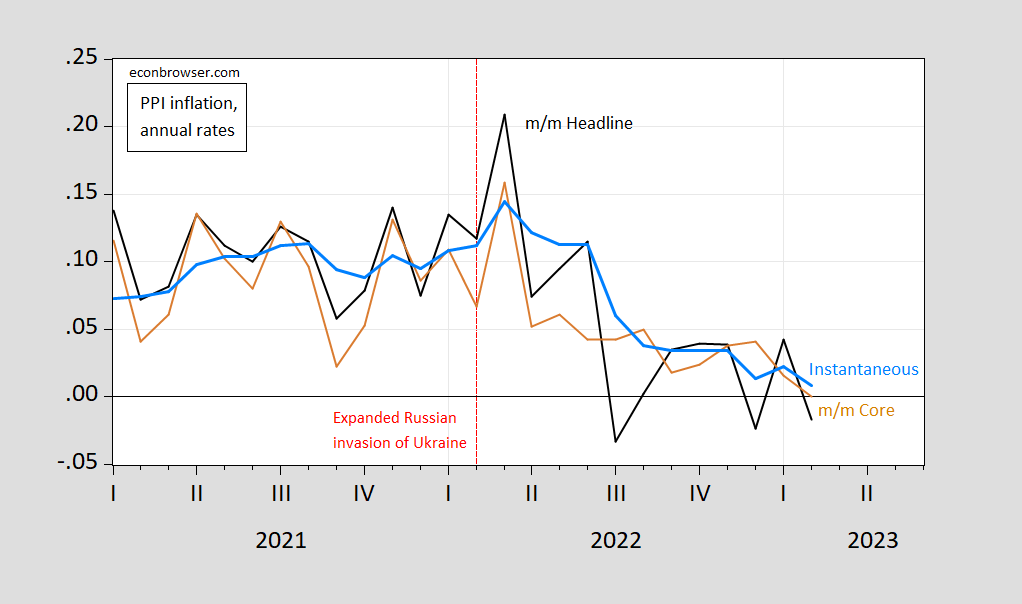
Figure 2: Annualized month-on-month PPI inflation (black), core PPI (tan), and instantaneous PPI inflation, T=12, a=4 (sky blue), all in %. Source: BLS, and author’s calculations.
For a perspective on what the levels of these indices look like, here’s Figure 3.
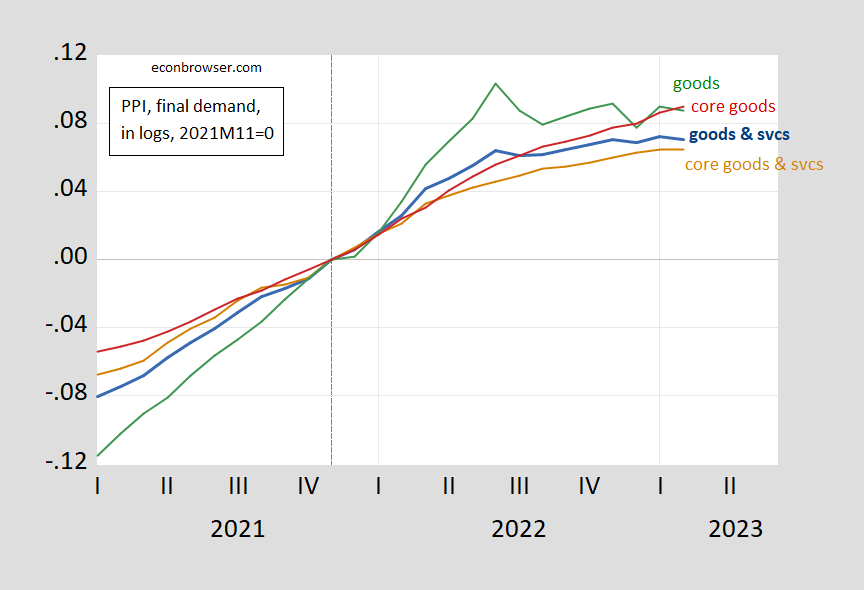
Figure 3: PPI inflation (blue), core PPI (red), goods PPI (green), core goods PPI (tan) all in logs, 2021M11=0. Source: BLS, and author’s calculations.
Headline PPI is down for the month and flat for the past 3 months.
There is a long-standing interest in the importance of PPI (rather, the prices represented in PPI) for consumer prices. Here’s FRED Blog being equivocal on the issue:
https://fredblog.stlouisfed.org/2021/04/from-ppi-to-cpi/
The Blog article cites a 1995 classic on the issue, without any mention of stuctural changes which might make research fom 1995 out-dated.
PPI is heavily focused on goods inflation. We know that goods inflation is behaving nicely. The Fed wants to draw our attention to services inflation. Here’s a picture of PPI, along with goods and services PCE deflators:
https://fred.stlouisfed.org/graph/?g=11fGW
You see the problem.
Clark, back in 1995, compared a variety of PPI measures to core CPI, but made no effort to tease apart consumer goods prices from consumer service prices. If he had, he might have found stronger pass-through from PPI to some consumer prices.
Anyhow, flat producer price inflation is probably a good sign for consumer goods prices, which the Fed seems willing to ignore for now.
By the way, the CEA has cooked up a new non-housing-services wage index to get a better look at the influence of wages on consumer services prices:
https://www.whitehouse.gov/cea/written-materials/2023/02/08/a-new-wage-measure-for-core-non-housing-services/
A good thing to do. At first glance, I haven’t found a link to the data series. It’s probably out there somewhere.
Macroduck: see also discussion in this post, this post, and article by Caporale (2022) cited in both.
Thank you. I was being lazy.
OK, kids, 5hos is the paper we’ve been looking for. How much has increased business concentration added to inflation? The Boston Fed has the answer, and it’s the one you’d expect:
https://www.bostonfed.org/publications/current-policy-perspectives/2022/cost-price-relationships-in-a-concentrated-economy.aspx
A 50% increase in concentration has resulted in a 25% increase in cost pass-through. All those “increased efficiencies from size will lower costs to consumers” claims were lies. Big size insulates profits from costs.
the trimmed mean is the one tol ook at and it is too high.
Not Trampis: As far as I know, there’s no series readily available for trimmed mean PPI inflation.
: ) Menzie, you’re a kind and considerate person…… very kind, and it serves you well : ) This is why I like you.
Yes, yes. Based on core goods which mostly follows cpi, inflation will be down in March. I have real doubts about the validity of CPI right now. A basket weighted for inflation will ignore mass deflations. This is what happened in the 90’s when real wages collapsed, yet the economy still grew. A learning experience as a youngster.
PPI, of course, doesn’t include rent or owner’s equivalent rent…some are suggesting that CPI would also show no inflation if one took out shelter (an index which includes more than rents, btw)
here’s New Deal democrat http://bonddad.blogspot.com/2023/03/properly-measured-consumer-prices-have.html
and Bill McBride: http://www.calculatedriskblog.com/2023/03/cleveland-fed-median-cpi-increased-06.html
being agnostic, i checked the special aggregate indexes that came with the CPI report, and i don’t see it. judge for yourselves:
https://www.bls.gov/news.release/cpi.t03.htm